| Tissue | Expression Dynamics | Abbreviation |
| Esophagus |  | ESCC: Esophageal squamous cell carcinoma |
| HGIN: High-grade intraepithelial neoplasias |
| LGIN: Low-grade intraepithelial neoplasias |
| Liver |  | HCC: Hepatocellular carcinoma |
| NAFLD: Non-alcoholic fatty liver disease |
| Oral Cavity | 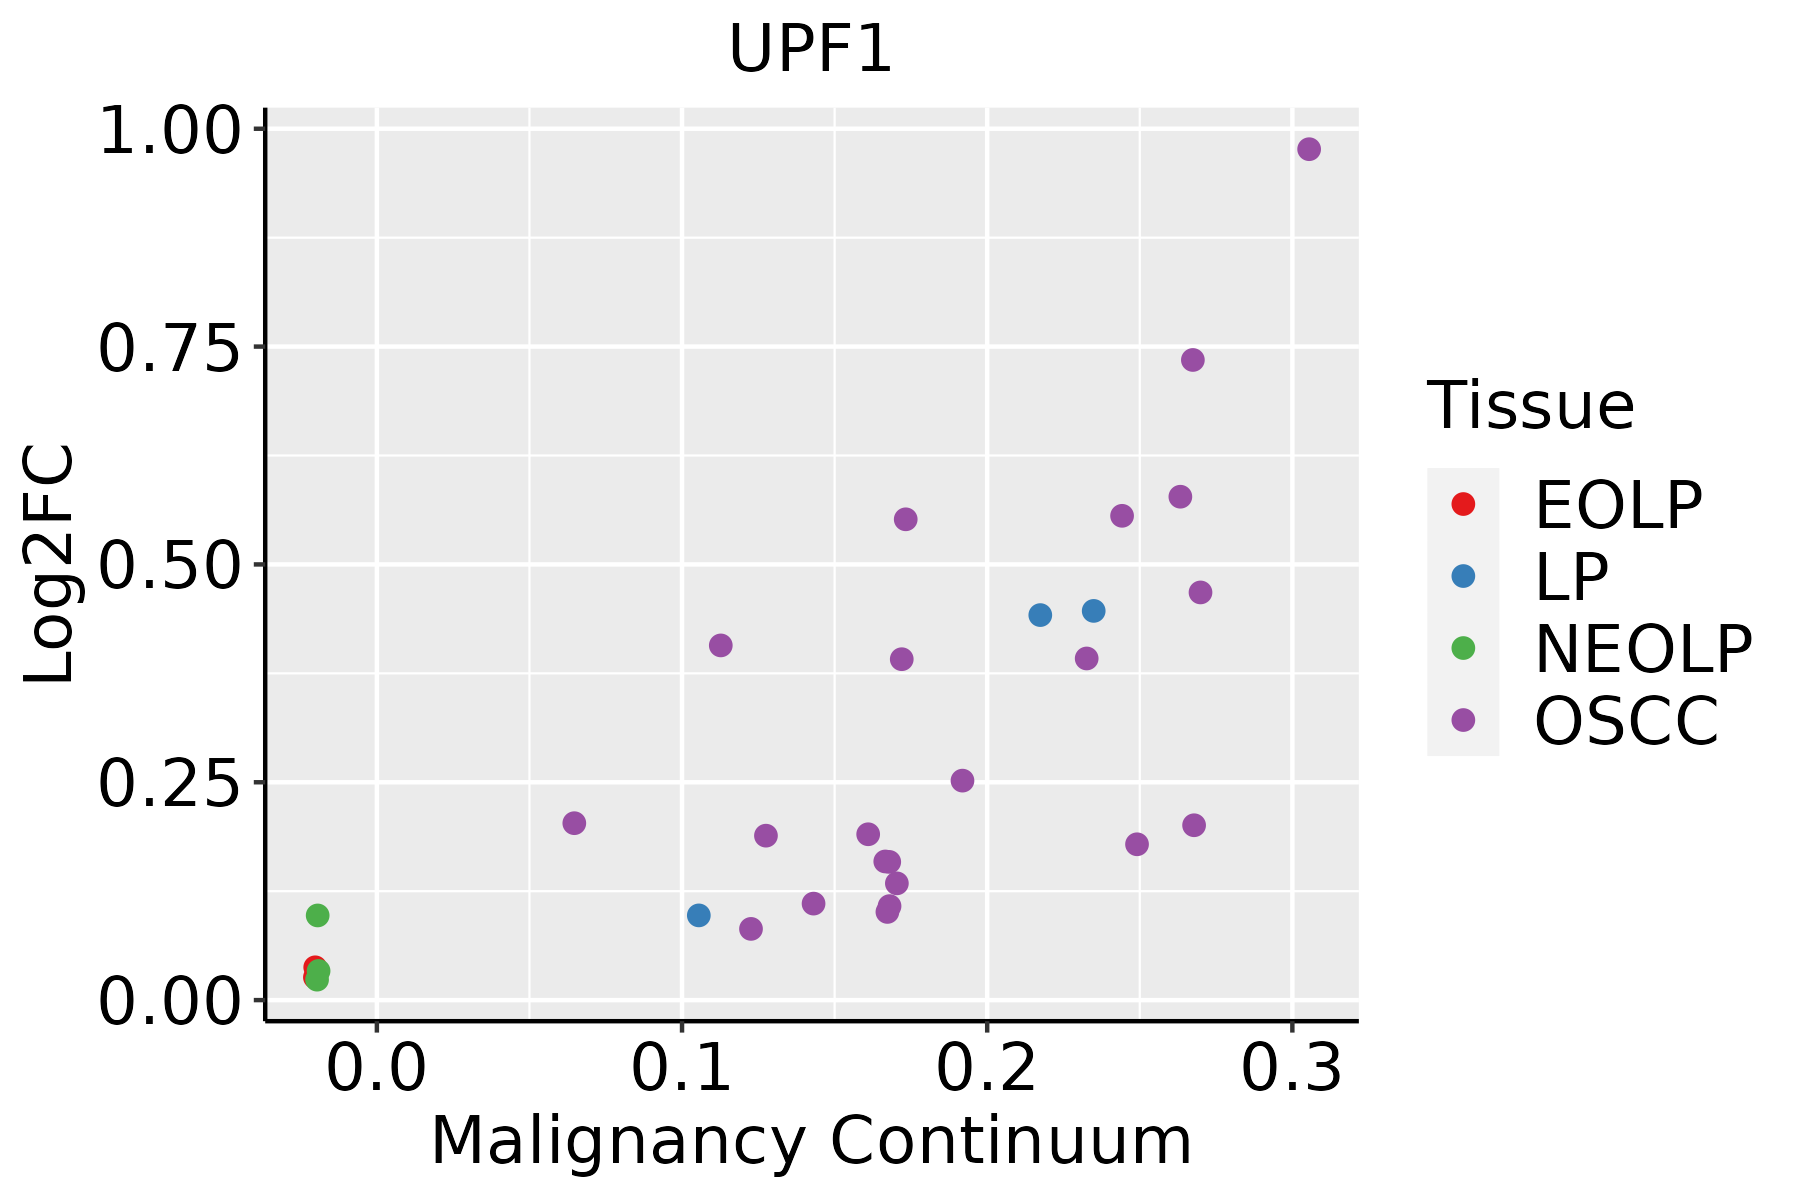 | EOLP: Erosive Oral lichen planus |
| LP: leukoplakia |
| NEOLP: Non-erosive oral lichen planus |
| OSCC: Oral squamous cell carcinoma |
| Prostate | 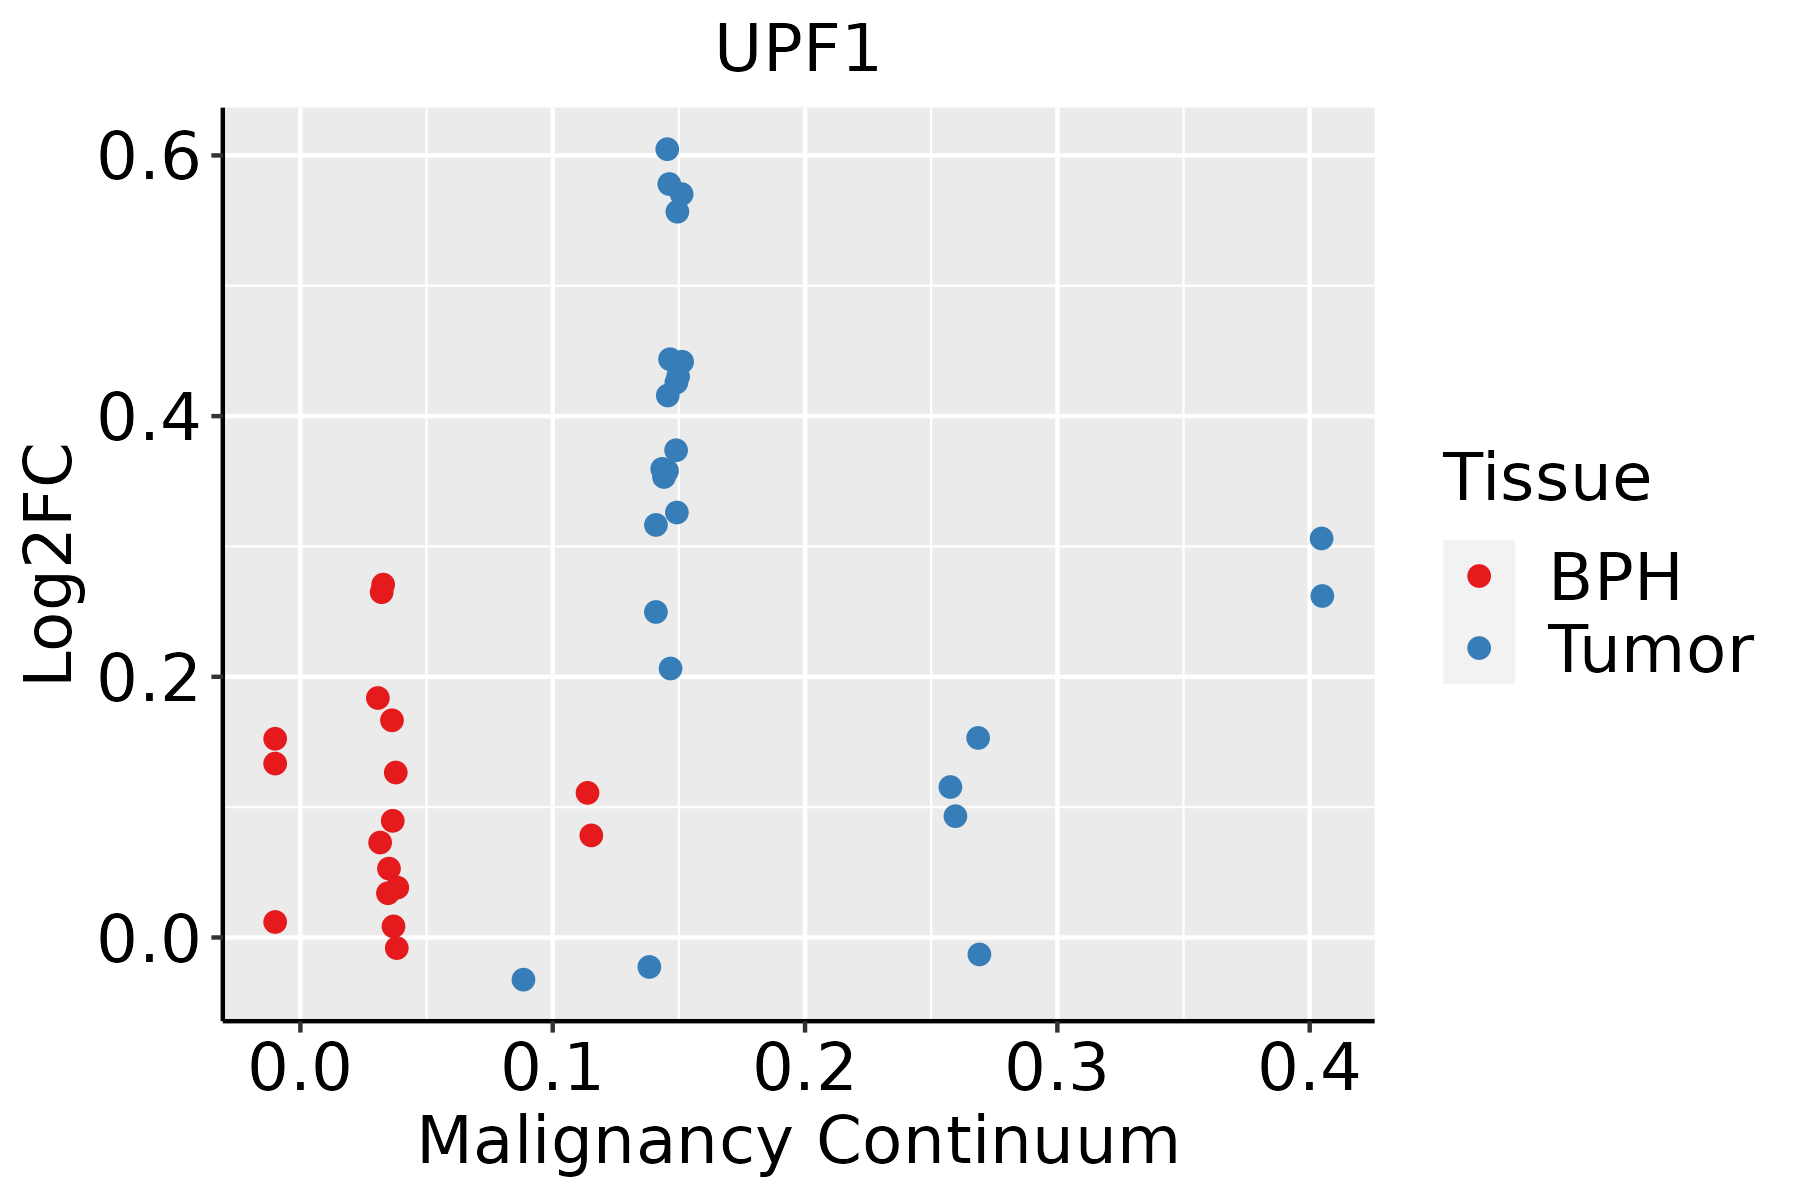 | BPH: Benign Prostatic Hyperplasia |
| Thyroid | 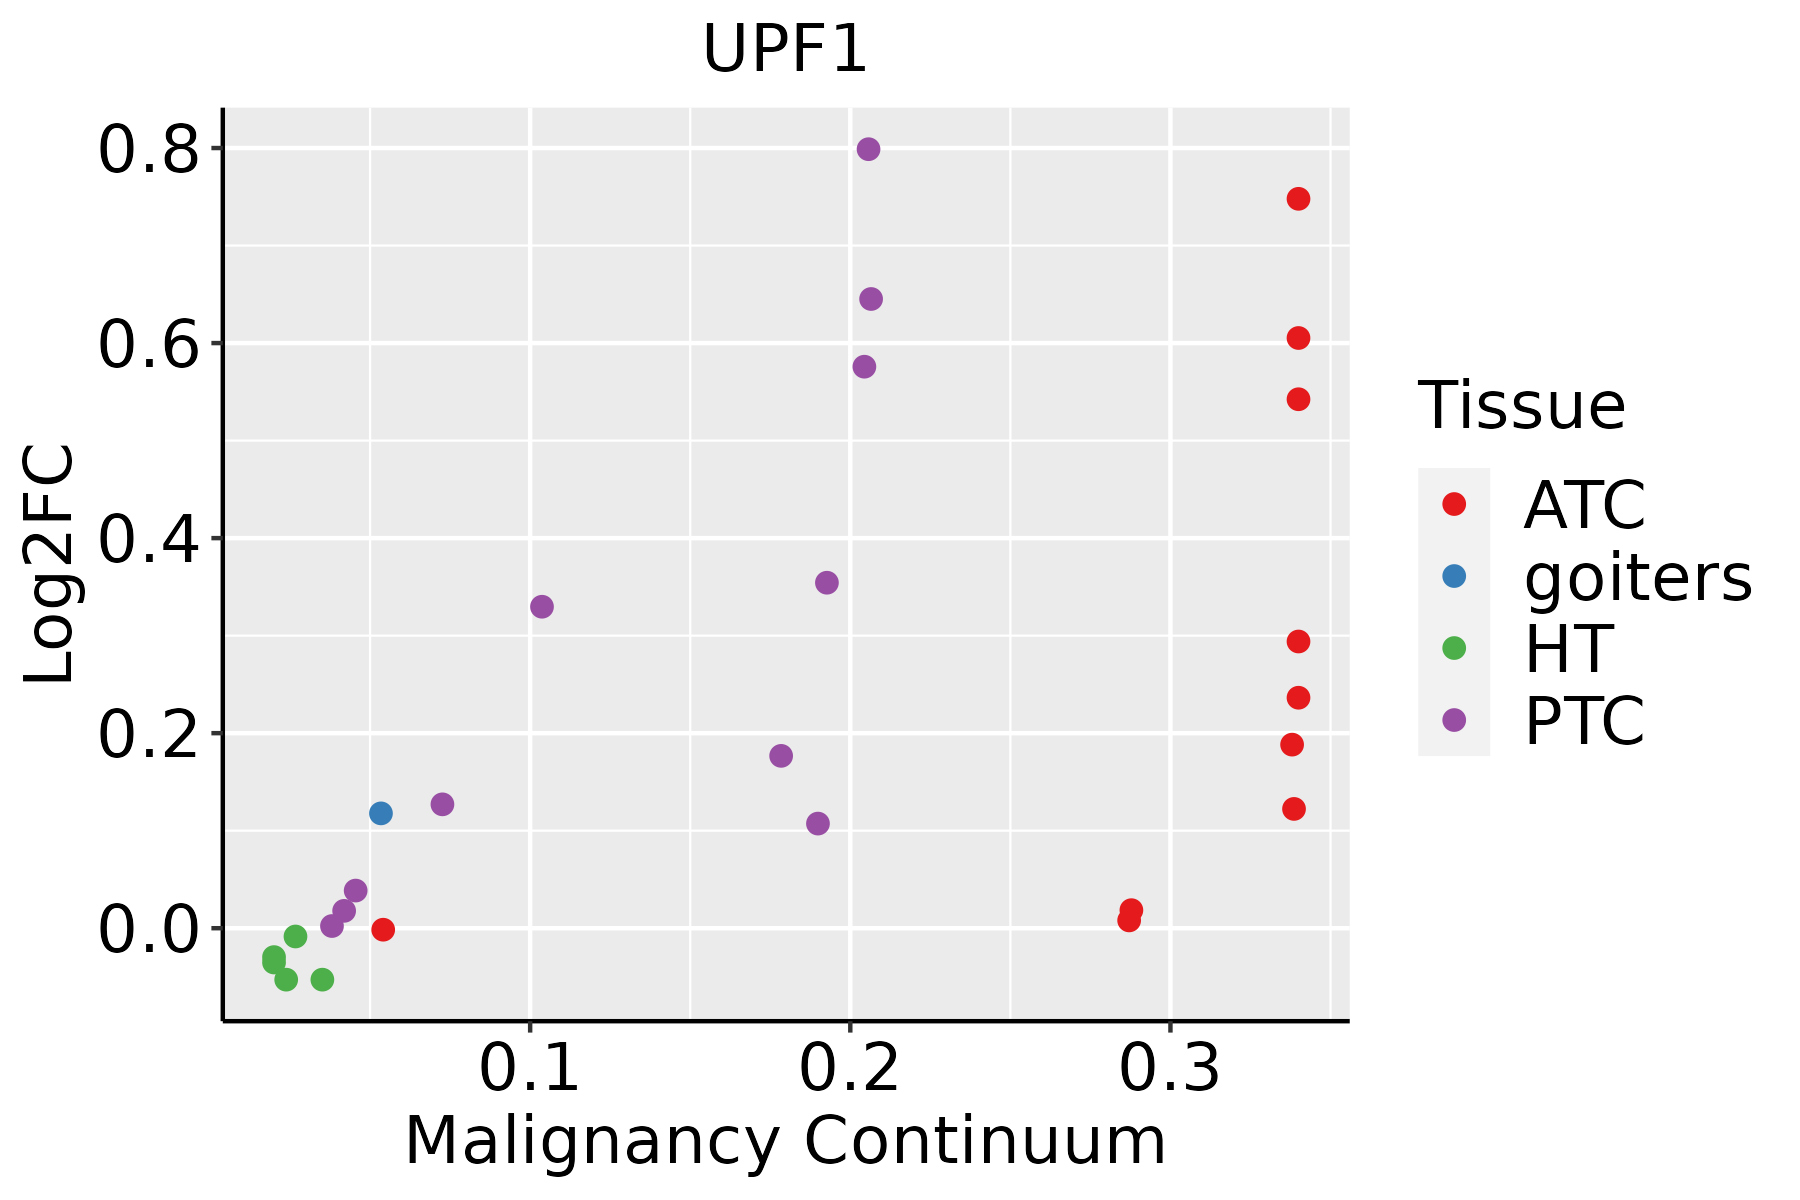 | ATC: Anaplastic thyroid cancer |
| HT: Hashimoto's thyroiditis |
| PTC: Papillary thyroid cancer |
| GO ID | Tissue | Disease Stage | Description | Gene Ratio | Bg Ratio | pvalue | p.adjust | Count |
| GO:00062604 | Esophagus | ESCC | DNA replication | 181/8552 | 260/18723 | 3.55e-15 | 2.05e-13 | 181 |
| GO:001943918 | Esophagus | ESCC | aromatic compound catabolic process | 295/8552 | 467/18723 | 1.09e-14 | 5.98e-13 | 295 |
| GO:190136118 | Esophagus | ESCC | organic cyclic compound catabolic process | 307/8552 | 495/18723 | 9.99e-14 | 4.80e-12 | 307 |
| GO:005105215 | Esophagus | ESCC | regulation of DNA metabolic process | 232/8552 | 359/18723 | 2.40e-13 | 1.13e-11 | 232 |
| GO:007116612 | Esophagus | ESCC | ribonucleoprotein complex localization | 66/8552 | 77/18723 | 2.94e-13 | 1.38e-11 | 66 |
| GO:007142612 | Esophagus | ESCC | ribonucleoprotein complex export from nucleus | 65/8552 | 76/18723 | 5.56e-13 | 2.50e-11 | 65 |
| GO:000095618 | Esophagus | ESCC | nuclear-transcribed mRNA catabolic process | 88/8552 | 112/18723 | 9.41e-13 | 4.14e-11 | 88 |
| GO:000072319 | Esophagus | ESCC | telomere maintenance | 99/8552 | 131/18723 | 2.68e-12 | 1.08e-10 | 99 |
| GO:000640512 | Esophagus | ESCC | RNA export from nucleus | 68/8552 | 84/18723 | 2.99e-11 | 1.01e-09 | 68 |
| GO:003298416 | Esophagus | ESCC | protein-containing complex disassembly | 151/8552 | 224/18723 | 3.45e-11 | 1.15e-09 | 151 |
| GO:003220417 | Esophagus | ESCC | regulation of telomere maintenance | 65/8552 | 80/18723 | 6.02e-11 | 1.90e-09 | 65 |
| GO:00064064 | Esophagus | ESCC | mRNA export from nucleus | 51/8552 | 59/18723 | 7.98e-11 | 2.47e-09 | 51 |
| GO:00714274 | Esophagus | ESCC | mRNA-containing ribonucleoprotein complex export from nucleus | 51/8552 | 59/18723 | 7.98e-11 | 2.47e-09 | 51 |
| GO:190331316 | Esophagus | ESCC | positive regulation of mRNA metabolic process | 87/8552 | 118/18723 | 5.10e-10 | 1.32e-08 | 87 |
| GO:006101319 | Esophagus | ESCC | regulation of mRNA catabolic process | 115/8552 | 166/18723 | 5.90e-10 | 1.49e-08 | 115 |
| GO:004348719 | Esophagus | ESCC | regulation of RNA stability | 117/8552 | 170/18723 | 7.91e-10 | 1.94e-08 | 117 |
| GO:004348819 | Esophagus | ESCC | regulation of mRNA stability | 109/8552 | 158/18723 | 2.40e-09 | 5.35e-08 | 109 |
| GO:003150314 | Esophagus | ESCC | protein-containing complex localization | 139/8552 | 220/18723 | 1.14e-07 | 1.85e-06 | 139 |
| GO:00400295 | Esophagus | ESCC | regulation of gene expression, epigenetic | 74/8552 | 105/18723 | 2.24e-07 | 3.42e-06 | 74 |
| GO:00062612 | Esophagus | ESCC | DNA-dependent DNA replication | 100/8552 | 151/18723 | 2.61e-07 | 3.94e-06 | 100 |
| Pathway ID | Tissue | Disease Stage | Description | Gene Ratio | Bg Ratio | pvalue | p.adjust | qvalue | Count |
| hsa0301321 | Esophagus | ESCC | Nucleocytoplasmic transport | 89/4205 | 108/8465 | 1.20e-12 | 2.37e-11 | 1.21e-11 | 89 |
| hsa0301524 | Esophagus | ESCC | mRNA surveillance pathway | 72/4205 | 97/8465 | 6.12e-07 | 4.10e-06 | 2.10e-06 | 72 |
| hsa0301331 | Esophagus | ESCC | Nucleocytoplasmic transport | 89/4205 | 108/8465 | 1.20e-12 | 2.37e-11 | 1.21e-11 | 89 |
| hsa0301534 | Esophagus | ESCC | mRNA surveillance pathway | 72/4205 | 97/8465 | 6.12e-07 | 4.10e-06 | 2.10e-06 | 72 |
| hsa03013 | Liver | HCC | Nucleocytoplasmic transport | 81/4020 | 108/8465 | 4.28e-09 | 6.83e-08 | 3.80e-08 | 81 |
| hsa0301521 | Liver | HCC | mRNA surveillance pathway | 66/4020 | 97/8465 | 3.16e-05 | 1.88e-04 | 1.04e-04 | 66 |
| hsa030131 | Liver | HCC | Nucleocytoplasmic transport | 81/4020 | 108/8465 | 4.28e-09 | 6.83e-08 | 3.80e-08 | 81 |
| hsa0301531 | Liver | HCC | mRNA surveillance pathway | 66/4020 | 97/8465 | 3.16e-05 | 1.88e-04 | 1.04e-04 | 66 |
| hsa030136 | Oral cavity | OSCC | Nucleocytoplasmic transport | 82/3704 | 108/8465 | 7.93e-12 | 1.33e-10 | 6.77e-11 | 82 |
| hsa030158 | Oral cavity | OSCC | mRNA surveillance pathway | 75/3704 | 97/8465 | 1.30e-11 | 2.01e-10 | 1.02e-10 | 75 |
| hsa0301311 | Oral cavity | OSCC | Nucleocytoplasmic transport | 82/3704 | 108/8465 | 7.93e-12 | 1.33e-10 | 6.77e-11 | 82 |
| hsa0301513 | Oral cavity | OSCC | mRNA surveillance pathway | 75/3704 | 97/8465 | 1.30e-11 | 2.01e-10 | 1.02e-10 | 75 |
| hsa030155 | Prostate | BPH | mRNA surveillance pathway | 32/1718 | 97/8465 | 2.20e-03 | 8.63e-03 | 5.34e-03 | 32 |
| hsa0301512 | Prostate | BPH | mRNA surveillance pathway | 32/1718 | 97/8465 | 2.20e-03 | 8.63e-03 | 5.34e-03 | 32 |
| hsa0301522 | Prostate | Tumor | mRNA surveillance pathway | 33/1791 | 97/8465 | 2.18e-03 | 8.60e-03 | 5.33e-03 | 33 |
| hsa0301532 | Prostate | Tumor | mRNA surveillance pathway | 33/1791 | 97/8465 | 2.18e-03 | 8.60e-03 | 5.33e-03 | 33 |
| Hugo Symbol | Variant Class | Variant Classification | dbSNP RS | HGVSc | HGVSp | HGVSp Short | SWISSPROT | BIOTYPE | SIFT | PolyPhen | Tumor Sample Barcode | Tissue | Histology | Sex | Age | Stage | Therapy Types | Drugs | Outcome |
| UPF1 | SNV | Missense_Mutation | | c.1319N>T | p.Thr440Met | p.T440M | Q92900 | protein_coding | deleterious(0.01) | possibly_damaging(0.506) | TCGA-A2-A0CQ-01 | Breast | breast invasive carcinoma | Female | <65 | I/II | Chemotherapy | adriamycin | SD |
| UPF1 | SNV | Missense_Mutation | | c.719C>G | p.Ser240Cys | p.S240C | Q92900 | protein_coding | deleterious(0.01) | probably_damaging(0.918) | TCGA-B6-A0I6-01 | Breast | breast invasive carcinoma | Female | <65 | I/II | Unknown | Unknown | PD |
| UPF1 | SNV | Missense_Mutation | | c.1417N>T | p.Arg473Cys | p.R473C | Q92900 | protein_coding | deleterious(0) | possibly_damaging(0.753) | TCGA-B6-A0RS-01 | Breast | breast invasive carcinoma | Female | <65 | I/II | Unknown | Unknown | PD |
| UPF1 | SNV | Missense_Mutation | | c.1073N>C | p.Val358Ala | p.V358A | Q92900 | protein_coding | tolerated_low_confidence(0.83) | benign(0) | TCGA-EW-A1PD-01 | Breast | breast invasive carcinoma | Male | <65 | I/II | Chemotherapy | docetaxel | SD |
| UPF1 | SNV | Missense_Mutation | novel | c.1835N>A | p.Thr612Asn | p.T612N | Q92900 | protein_coding | tolerated(0.27) | benign(0.001) | TCGA-LL-A5YL-01 | Breast | breast invasive carcinoma | Female | <65 | I/II | Chemotherapy | adriamycin | SD |
| UPF1 | insertion | Nonsense_Mutation | novel | c.2983_2984insATGTATGATGCCCGGGAGGCCATCATCCCAGGCT | p.Pro995HisfsTer3 | p.P995Hfs*3 | Q92900 | protein_coding | | | TCGA-A2-A0CP-01 | Breast | breast invasive carcinoma | Female | <65 | I/II | Chemotherapy | cytoxan | SD |
| UPF1 | insertion | Frame_Shift_Ins | novel | c.2707_2708insTCATCATCCTGTCCTGTGTGCGGGCC | p.Tyr903PhefsTer48 | p.Y903Ffs*48 | Q92900 | protein_coding | | | TCGA-A7-A0D9-01 | Breast | breast invasive carcinoma | Female | <65 | I/II | Chemotherapy | taxotere | SD |
| UPF1 | deletion | Frame_Shift_Del | novel | c.2442delN | p.Val815CysfsTer50 | p.V815Cfs*50 | Q92900 | protein_coding | | | TCGA-EW-A2FV-01 | Breast | breast invasive carcinoma | Female | <65 | III/IV | Chemotherapy | docetaxel | SD |
| UPF1 | SNV | Missense_Mutation | novel | c.2108N>A | p.Gly703Asp | p.G703D | Q92900 | protein_coding | deleterious(0.02) | possibly_damaging(0.697) | TCGA-2W-A8YY-01 | Cervix | cervical & endocervical cancer | Female | <65 | I/II | Chemotherapy | cisplatin | CR |
| UPF1 | SNV | Missense_Mutation | | c.1201G>C | p.Glu401Gln | p.E401Q | Q92900 | protein_coding | deleterious(0.01) | benign(0.293) | TCGA-C5-A2LY-01 | Cervix | cervical & endocervical cancer | Female | <65 | I/II | Chemotherapy | cisplatin | SD |


