
|
|||||
|
 | |
| |
| |
| |
| |
| |
|
Gene: ULK4 |
Gene summary for ULK4 |
| Gene information | Species | Human | Gene symbol | ULK4 | Gene ID | 54986 |
| Gene name | unc-51 like kinase 4 | |
| Gene Alias | FAM7C1 | |
| Cytomap | 3p22.1 | |
| Gene Type | protein-coding | GO ID | GO:0000165 | UniProtAcc | Q96C45 |
Top |
Malignant transformation analysis |
| Identification of the aberrant gene expression in precancerous and cancerous lesions by comparing the gene expression of stem-like cells in diseased tissues with normal stem cells |
| Entrez ID | Symbol | Replicates | Species | Organ | Tissue | Adj P-value | Log2FC | Malignancy |
| 54986 | ULK4 | CCI_2 | Human | Cervix | CC | 6.08e-05 | 5.27e-01 | 0.5249 |
| 54986 | ULK4 | CCI_3 | Human | Cervix | CC | 2.54e-11 | 5.12e-01 | 0.516 |
| 54986 | ULK4 | AEH-subject1 | Human | Endometrium | AEH | 7.94e-13 | 3.79e-01 | -0.3059 |
| 54986 | ULK4 | AEH-subject2 | Human | Endometrium | AEH | 3.08e-05 | 3.47e-01 | -0.2525 |
| 54986 | ULK4 | AEH-subject3 | Human | Endometrium | AEH | 3.30e-09 | 3.59e-01 | -0.2576 |
| 54986 | ULK4 | AEH-subject4 | Human | Endometrium | AEH | 3.37e-37 | 9.73e-01 | -0.2657 |
| 54986 | ULK4 | AEH-subject5 | Human | Endometrium | AEH | 2.25e-25 | 6.17e-01 | -0.2953 |
| 54986 | ULK4 | EEC-subject1 | Human | Endometrium | EEC | 5.66e-07 | 3.77e-01 | -0.2682 |
| 54986 | ULK4 | EEC-subject2 | Human | Endometrium | EEC | 2.31e-21 | 5.76e-01 | -0.2607 |
| 54986 | ULK4 | EEC-subject4 | Human | Endometrium | EEC | 5.43e-18 | 5.25e-01 | -0.2571 |
| 54986 | ULK4 | EEC-subject5 | Human | Endometrium | EEC | 4.44e-06 | 3.35e-01 | -0.249 |
| 54986 | ULK4 | GSM6177622_NYU_UCEC3_lib1_lib1 | Human | Endometrium | EEC | 1.63e-02 | -7.73e-02 | -0.1917 |
| 54986 | ULK4 | RNA-P25T1-P25T1-1 | Human | Lung | AIS | 1.77e-07 | 4.79e-01 | -0.2116 |
| 54986 | ULK4 | RNA-P25T1-P25T1-2 | Human | Lung | AIS | 1.68e-03 | 6.51e-01 | -0.1941 |
| 54986 | ULK4 | RNA-P25T1-P25T1-4 | Human | Lung | AIS | 2.09e-05 | 5.34e-01 | -0.2119 |
| 54986 | ULK4 | RNA-P6T2-P6T2-1 | Human | Lung | IAC | 3.49e-05 | 3.19e-01 | -0.0166 |
| 54986 | ULK4 | RNA-P6T2-P6T2-2 | Human | Lung | IAC | 3.28e-07 | 3.44e-01 | -0.0132 |
| 54986 | ULK4 | RNA-P6T2-P6T2-3 | Human | Lung | IAC | 1.46e-06 | 3.21e-01 | -0.013 |
| 54986 | ULK4 | RNA-P6T2-P6T2-4 | Human | Lung | IAC | 1.78e-07 | 3.69e-01 | -0.0121 |
| 54986 | ULK4 | HTA12-23-1 | Human | Pancreas | PDAC | 6.08e-06 | 6.24e-01 | 0.3405 |
| Page: 1 2 |
| Tissue | Expression Dynamics | Abbreviation |
| Cervix | 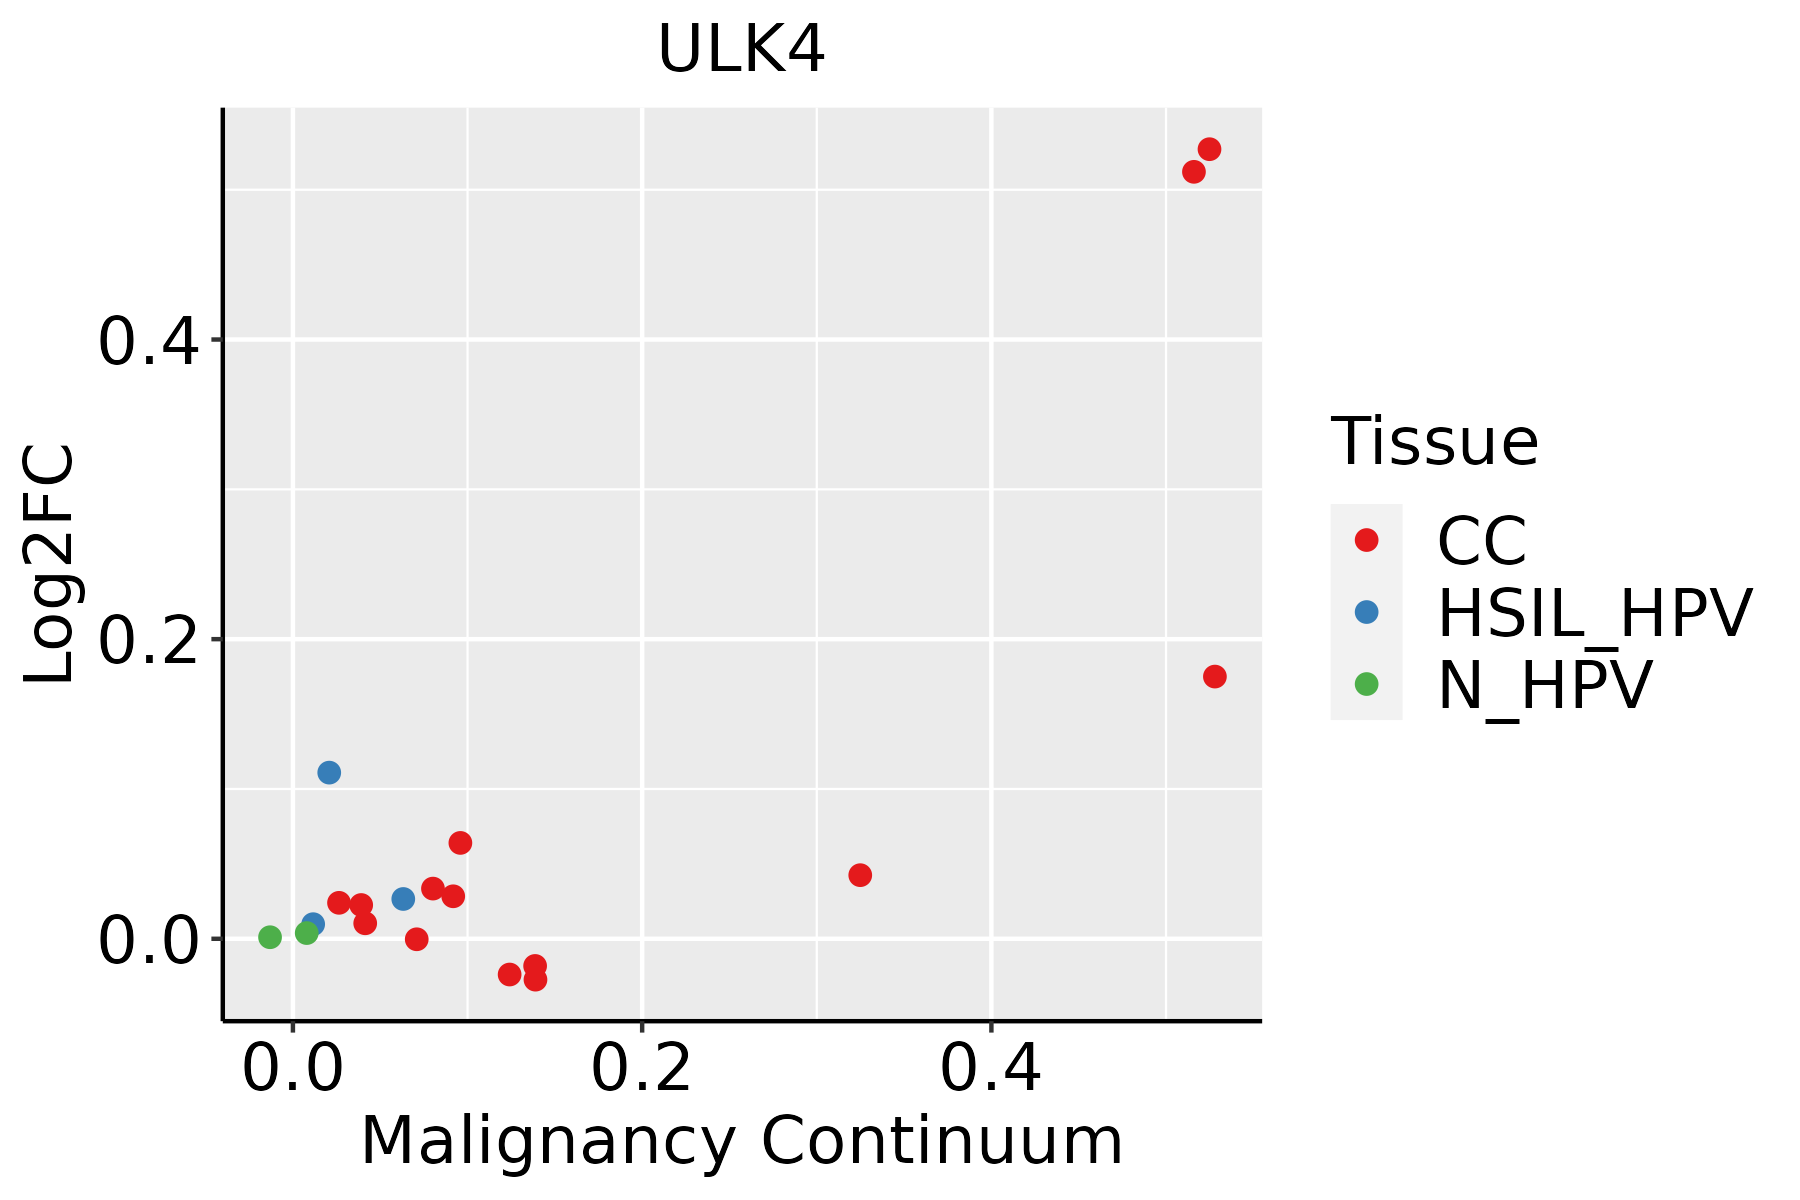 | CC: Cervix cancer |
| HSIL_HPV: HPV-infected high-grade squamous intraepithelial lesions | ||
| N_HPV: HPV-infected normal cervix | ||
| Endometrium | 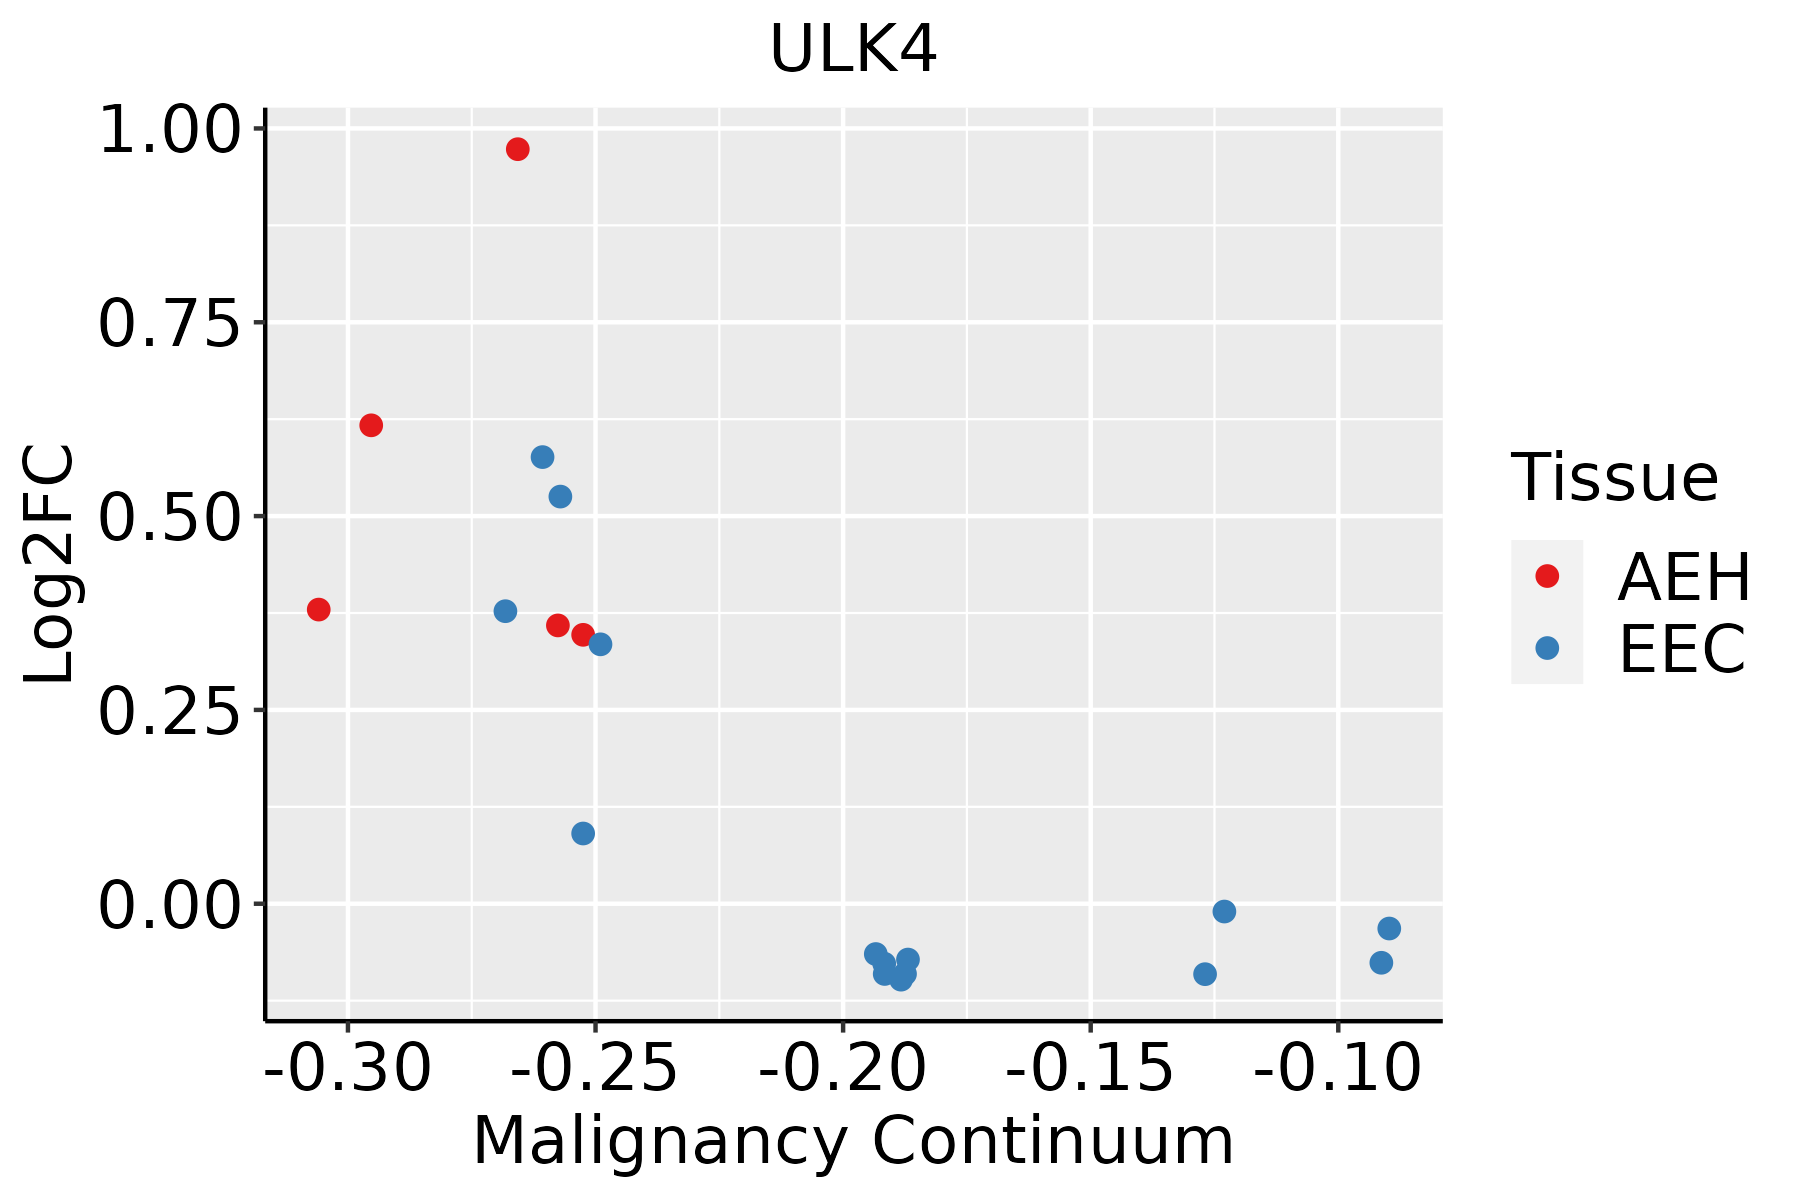 | AEH: Atypical endometrial hyperplasia |
| EEC: Endometrioid Cancer | ||
| Lung | 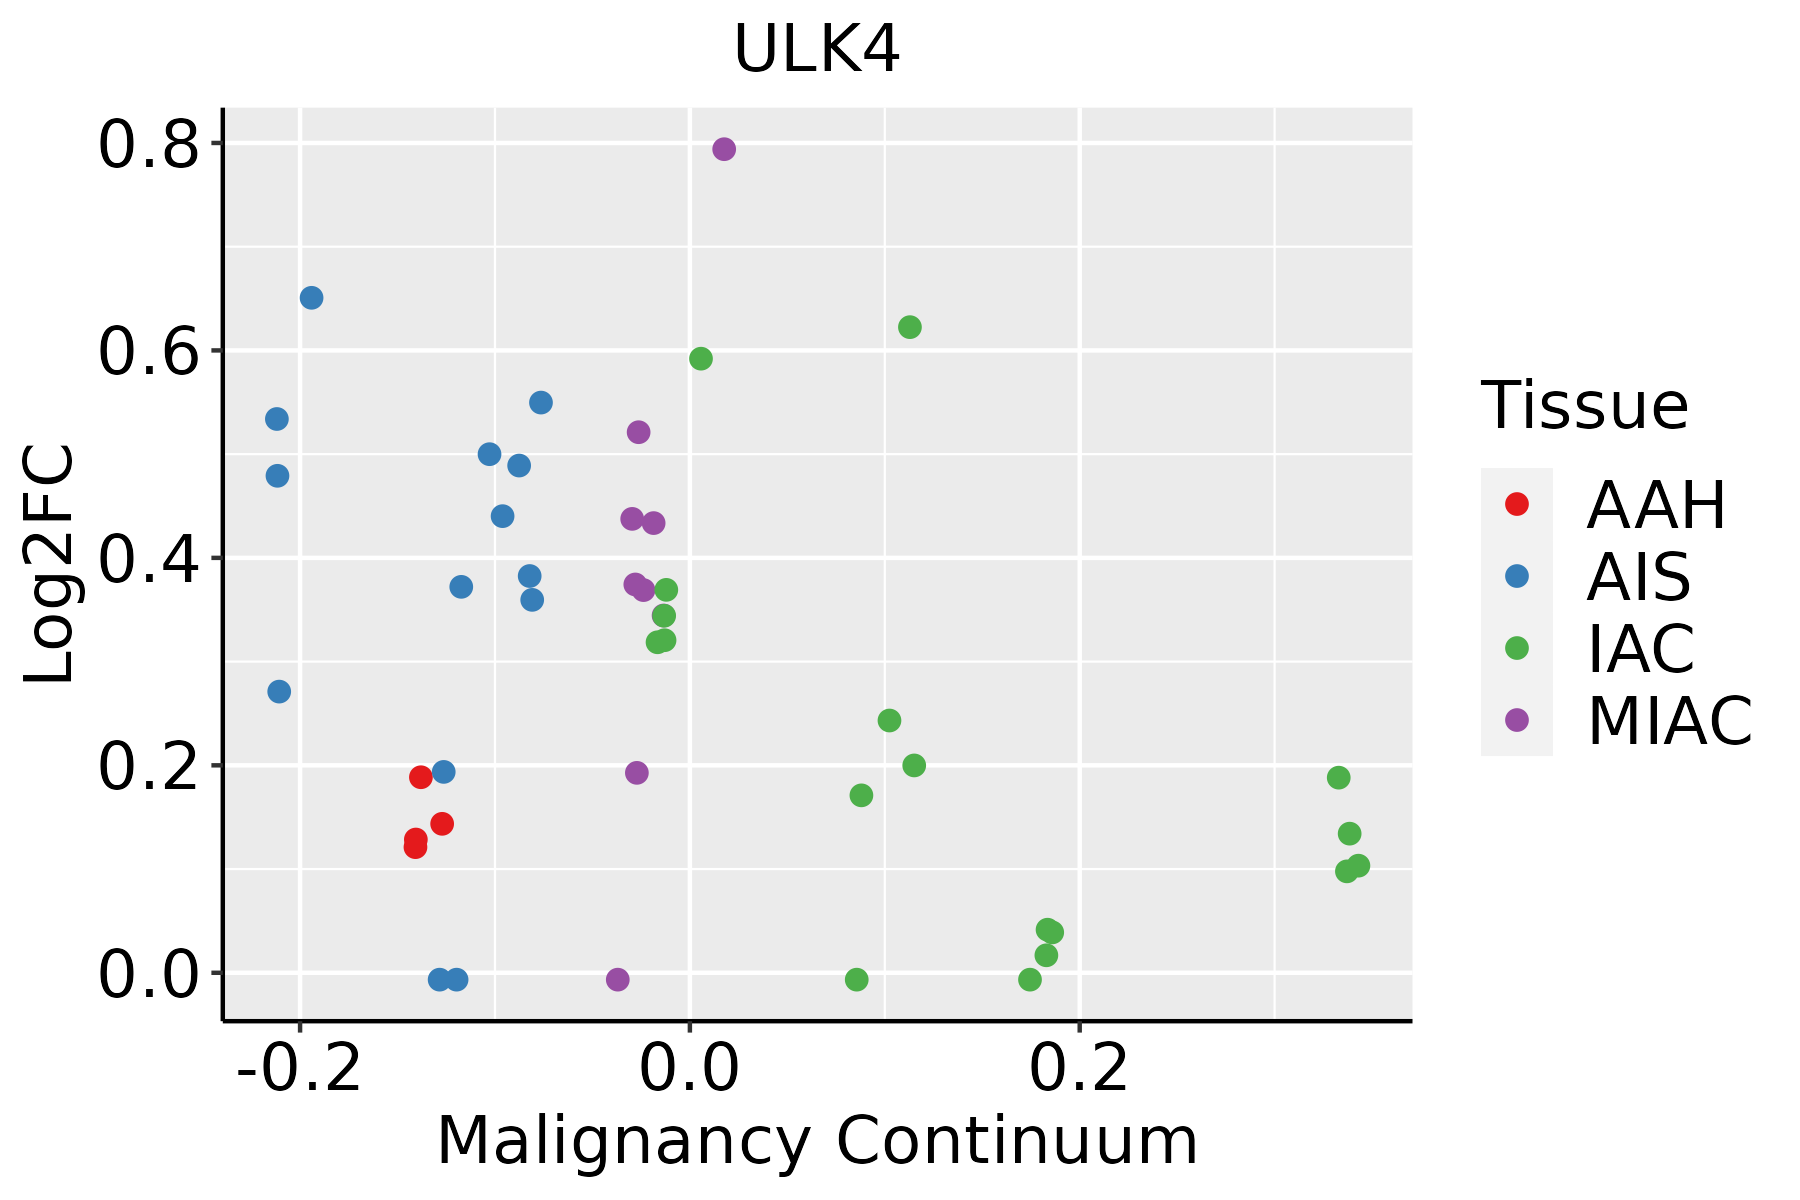 | AAH: Atypical adenomatous hyperplasia |
| AIS: Adenocarcinoma in situ | ||
| IAC: Invasive lung adenocarcinoma | ||
| MIA: Minimally invasive adenocarcinoma |
| ∗log2FC in expression of this searched gene in stem-like cells from each diseased tissue sample relative to stem-like cells in normal samples in each tissue plotted against the malignancy continuum. Samples are colored based on if they are from different disease stage. |
Top |
Malignant transformation related pathway analysis |
| Find out the enriched GO biological processes and KEGG pathways involved in transition from healthy to precancer to cancer |
| Tissue | Disease Stage | Enriched GO biological Processes |
| Colorectum | AD |  |
| Colorectum | SER |  |
| Colorectum | MSS |  |
| Colorectum | MSI-H |  |
| Colorectum | FAP |  |
| ∗Top 15 enriched GO BP terms are showed in the bar plot of each disease state in each tissue. Each row represents a significant GO biological process which is colored according to the -log10(p.adjust). |
| Page: 1 2 3 4 5 6 7 8 9 |
| GO ID | Tissue | Disease Stage | Description | Gene Ratio | Bg Ratio | pvalue | p.adjust | Count |
| GO:003109814 | Endometrium | EEC | stress-activated protein kinase signaling cascade | 56/2168 | 247/18723 | 5.25e-07 | 2.00e-05 | 56 |
| GO:003287214 | Endometrium | EEC | regulation of stress-activated MAPK cascade | 46/2168 | 192/18723 | 1.06e-06 | 3.56e-05 | 46 |
| GO:007030214 | Endometrium | EEC | regulation of stress-activated protein kinase signaling cascade | 46/2168 | 195/18723 | 1.67e-06 | 5.12e-05 | 46 |
| GO:190074411 | Endometrium | EEC | regulation of p38MAPK cascade | 18/2168 | 47/18723 | 2.16e-06 | 6.41e-05 | 18 |
| GO:001097513 | Endometrium | EEC | regulation of neuron projection development | 79/2168 | 445/18723 | 6.80e-05 | 1.01e-03 | 79 |
| GO:00017641 | Endometrium | EEC | neuron migration | 33/2168 | 156/18723 | 4.17e-04 | 4.38e-03 | 33 |
| GO:000725414 | Endometrium | EEC | JNK cascade | 33/2168 | 167/18723 | 1.44e-03 | 1.17e-02 | 33 |
| GO:00463286 | Endometrium | EEC | regulation of JNK cascade | 27/2168 | 133/18723 | 2.50e-03 | 1.83e-02 | 27 |
| GO:00310987 | Lung | IAC | stress-activated protein kinase signaling cascade | 57/2061 | 247/18723 | 3.95e-08 | 4.57e-06 | 57 |
| GO:00514037 | Lung | IAC | stress-activated MAPK cascade | 54/2061 | 239/18723 | 1.86e-07 | 1.56e-05 | 54 |
| GO:00072544 | Lung | IAC | JNK cascade | 42/2061 | 167/18723 | 1.99e-07 | 1.62e-05 | 42 |
| GO:00703026 | Lung | IAC | regulation of stress-activated protein kinase signaling cascade | 45/2061 | 195/18723 | 1.03e-06 | 5.65e-05 | 45 |
| GO:00109756 | Lung | IAC | regulation of neuron projection development | 82/2061 | 445/18723 | 1.82e-06 | 8.78e-05 | 82 |
| GO:00463284 | Lung | IAC | regulation of JNK cascade | 34/2061 | 133/18723 | 1.88e-06 | 8.87e-05 | 34 |
| GO:00380663 | Lung | IAC | p38MAPK cascade | 19/2061 | 55/18723 | 3.20e-06 | 1.38e-04 | 19 |
| GO:00328726 | Lung | IAC | regulation of stress-activated MAPK cascade | 43/2061 | 192/18723 | 4.06e-06 | 1.66e-04 | 43 |
| GO:1900744 | Lung | IAC | regulation of p38MAPK cascade | 15/2061 | 47/18723 | 9.77e-05 | 1.93e-03 | 15 |
| GO:0001764 | Lung | IAC | neuron migration | 31/2061 | 156/18723 | 7.89e-04 | 1.02e-02 | 31 |
| GO:003109813 | Lung | AIS | stress-activated protein kinase signaling cascade | 51/1849 | 247/18723 | 2.69e-07 | 2.37e-05 | 51 |
| GO:000725413 | Lung | AIS | JNK cascade | 38/1849 | 167/18723 | 7.27e-07 | 5.36e-05 | 38 |
| Page: 1 2 3 |
| Pathway ID | Tissue | Disease Stage | Description | Gene Ratio | Bg Ratio | pvalue | p.adjust | qvalue | Count |
| Page: 1 |
Top |
Cell-cell communication analysis |
| Identification of potential cell-cell interactions between two cell types and their ligand-receptor pairs for different disease states |
| Ligand | Receptor | LRpair | Pathway | Tissue | Disease Stage |
| Page: 1 |
Top |
Single-cell gene regulatory network inference analysis |
| Find out the significant the regulons (TFs) and the target genes of each regulon across cell types for different disease states |
| TF | Cell Type | Tissue | Disease Stage | Target Gene | RSS | Regulon Activity |
| ∗The dot plots of a searched regulon are shown for all cell subpopulations in each disease state of each tissue based on the regulon specific score inferred using pySCENIC and by calculating the average expression. |
| Page: 1 |
Top |
Somatic mutation of malignant transformation related genes |
| Annotation of somatic variants for genes involved in malignant transformation |
| Hugo Symbol | Variant Class | Variant Classification | dbSNP RS | HGVSc | HGVSp | HGVSp Short | SWISSPROT | BIOTYPE | SIFT | PolyPhen | Tumor Sample Barcode | Tissue | Histology | Sex | Age | Stage | Therapy Types | Drugs | Outcome |
| ULK4 | SNV | Missense_Mutation | novel | c.2920G>A | p.Ala974Thr | p.A974T | Q96C45 | protein_coding | tolerated(0.57) | benign(0.015) | TCGA-A8-A09Z-01 | Breast | breast invasive carcinoma | Female | >=65 | I/II | Unknown | Unknown | SD |
| ULK4 | SNV | Missense_Mutation | c.1174N>G | p.Leu392Val | p.L392V | Q96C45 | protein_coding | tolerated(0.3) | benign(0.001) | TCGA-AC-A23H-01 | Breast | breast invasive carcinoma | Female | >=65 | I/II | Unknown | Unknown | PD | |
| ULK4 | SNV | Missense_Mutation | c.81C>G | p.Ile27Met | p.I27M | Q96C45 | protein_coding | deleterious(0) | possibly_damaging(0.85) | TCGA-AO-A0JC-01 | Breast | breast invasive carcinoma | Female | <65 | I/II | Chemotherapy | fluorouracil | SD | |
| ULK4 | SNV | Missense_Mutation | c.2280N>C | p.Leu760Phe | p.L760F | Q96C45 | protein_coding | deleterious(0.04) | probably_damaging(0.959) | TCGA-D8-A1J8-01 | Breast | breast invasive carcinoma | Female | >=65 | I/II | Hormone Therapy | nolvadex | SD | |
| ULK4 | SNV | Missense_Mutation | rs767374190 | c.1409N>T | p.Ser470Leu | p.S470L | Q96C45 | protein_coding | tolerated(0.09) | benign(0.006) | TCGA-D8-A1Y3-01 | Breast | breast invasive carcinoma | Female | <65 | III/IV | Chemotherapy | doxorubicine+cyclophosphamide | SD |
| ULK4 | SNV | Missense_Mutation | c.2470T>G | p.Ser824Ala | p.S824A | Q96C45 | protein_coding | tolerated(1) | benign(0) | TCGA-E2-A1LH-01 | Breast | breast invasive carcinoma | Female | <65 | I/II | Chemotherapy | adriamycin | SD | |
| ULK4 | SNV | Missense_Mutation | c.1375C>G | p.Gln459Glu | p.Q459E | Q96C45 | protein_coding | tolerated(0.94) | benign(0.003) | TCGA-EW-A1J5-01 | Breast | breast invasive carcinoma | Female | <65 | I/II | Chemotherapy | adriamycin | SD | |
| ULK4 | SNV | Missense_Mutation | novel | c.1147N>A | p.His383Asn | p.H383N | Q96C45 | protein_coding | tolerated(0.23) | benign(0.013) | TCGA-PE-A5DD-01 | Breast | breast invasive carcinoma | Female | <65 | I/II | Chemotherapy | CR | |
| ULK4 | insertion | Nonsense_Mutation | novel | c.549_550insCCCAAAGCTCTGGGATTATAGGCATGAGCCACTGTGCCTGGCCA | p.Val184ProfsTer7 | p.V184Pfs*7 | Q96C45 | protein_coding | TCGA-A8-A07L-01 | Breast | breast invasive carcinoma | Female | <65 | III/IV | Chemotherapy | CR | |||
| ULK4 | deletion | Frame_Shift_Del | novel | c.313delN | p.Leu105Ter | p.L105* | Q96C45 | protein_coding | TCGA-D8-A27V-01 | Breast | breast invasive carcinoma | Female | <65 | I/II | Hormone Therapy | tamoxiphen | SD |
| Page: 1 2 3 4 5 6 7 8 9 10 11 12 |
Top |
Related drugs of malignant transformation related genes |
| Identification of chemicals and drugs interact with genes involved in malignant transfromation |
| (DGIdb 4.0) |
| Entrez ID | Symbol | Category | Interaction Types | Drug Claim Name | Drug Name | PMIDs |
| Page: 1 |

Copyright 2023-Present -The University of Texas Health Science Center at Houston |