
|
|||||
|
 | |
| |
| |
| |
| |
| |
|
Gene: UIMC1 |
Gene summary for UIMC1 |
| Gene information | Species | Human | Gene symbol | UIMC1 | Gene ID | 51720 |
| Gene name | ubiquitin interaction motif containing 1 | |
| Gene Alias | RAP80 | |
| Cytomap | 5q35.2 | |
| Gene Type | protein-coding | GO ID | GO:0000075 | UniProtAcc | A0A024R7R0 |
Top |
Malignant transformation analysis |
| Identification of the aberrant gene expression in precancerous and cancerous lesions by comparing the gene expression of stem-like cells in diseased tissues with normal stem cells |
| Entrez ID | Symbol | Replicates | Species | Organ | Tissue | Adj P-value | Log2FC | Malignancy |
| 51720 | UIMC1 | HTA11_3410_2000001011 | Human | Colorectum | AD | 3.81e-05 | -4.14e-01 | 0.0155 |
| 51720 | UIMC1 | HTA11_866_3004761011 | Human | Colorectum | AD | 4.19e-04 | -4.38e-01 | 0.096 |
| 51720 | UIMC1 | HTA11_7696_3000711011 | Human | Colorectum | AD | 2.58e-07 | -3.05e-01 | 0.0674 |
| 51720 | UIMC1 | HTA11_99999974143_84620 | Human | Colorectum | MSS | 1.33e-04 | -3.34e-01 | 0.3005 |
| 51720 | UIMC1 | A015-C-203 | Human | Colorectum | FAP | 1.67e-22 | -3.95e-01 | -0.1294 |
| 51720 | UIMC1 | A015-C-204 | Human | Colorectum | FAP | 1.55e-05 | -3.64e-01 | -0.0228 |
| 51720 | UIMC1 | A014-C-040 | Human | Colorectum | FAP | 4.28e-03 | -5.10e-01 | -0.1184 |
| 51720 | UIMC1 | A002-C-201 | Human | Colorectum | FAP | 4.82e-12 | -4.21e-01 | 0.0324 |
| 51720 | UIMC1 | A002-C-203 | Human | Colorectum | FAP | 4.35e-04 | -2.32e-01 | 0.2786 |
| 51720 | UIMC1 | A001-C-108 | Human | Colorectum | FAP | 3.53e-11 | -3.48e-01 | -0.0272 |
| 51720 | UIMC1 | A002-C-205 | Human | Colorectum | FAP | 8.75e-14 | -3.22e-01 | -0.1236 |
| 51720 | UIMC1 | A015-C-005 | Human | Colorectum | FAP | 1.34e-02 | -2.39e-01 | -0.0336 |
| 51720 | UIMC1 | A015-C-006 | Human | Colorectum | FAP | 4.42e-09 | -3.25e-01 | -0.0994 |
| 51720 | UIMC1 | A015-C-106 | Human | Colorectum | FAP | 1.99e-09 | -2.51e-01 | -0.0511 |
| 51720 | UIMC1 | A002-C-114 | Human | Colorectum | FAP | 5.09e-12 | -3.91e-01 | -0.1561 |
| 51720 | UIMC1 | A015-C-104 | Human | Colorectum | FAP | 1.07e-21 | -3.67e-01 | -0.1899 |
| 51720 | UIMC1 | A001-C-014 | Human | Colorectum | FAP | 4.60e-10 | -2.82e-01 | 0.0135 |
| 51720 | UIMC1 | A002-C-016 | Human | Colorectum | FAP | 2.05e-21 | -4.26e-01 | 0.0521 |
| 51720 | UIMC1 | A015-C-002 | Human | Colorectum | FAP | 5.31e-07 | -3.61e-01 | -0.0763 |
| 51720 | UIMC1 | A001-C-203 | Human | Colorectum | FAP | 3.39e-09 | -3.07e-01 | -0.0481 |
| Page: 1 2 3 4 5 6 |
| Tissue | Expression Dynamics | Abbreviation |
| Colorectum (GSE201348) |  | FAP: Familial adenomatous polyposis |
| CRC: Colorectal cancer | ||
| Colorectum (HTA11) |  | AD: Adenomas |
| SER: Sessile serrated lesions | ||
| MSI-H: Microsatellite-high colorectal cancer | ||
| MSS: Microsatellite stable colorectal cancer | ||
| Esophagus | 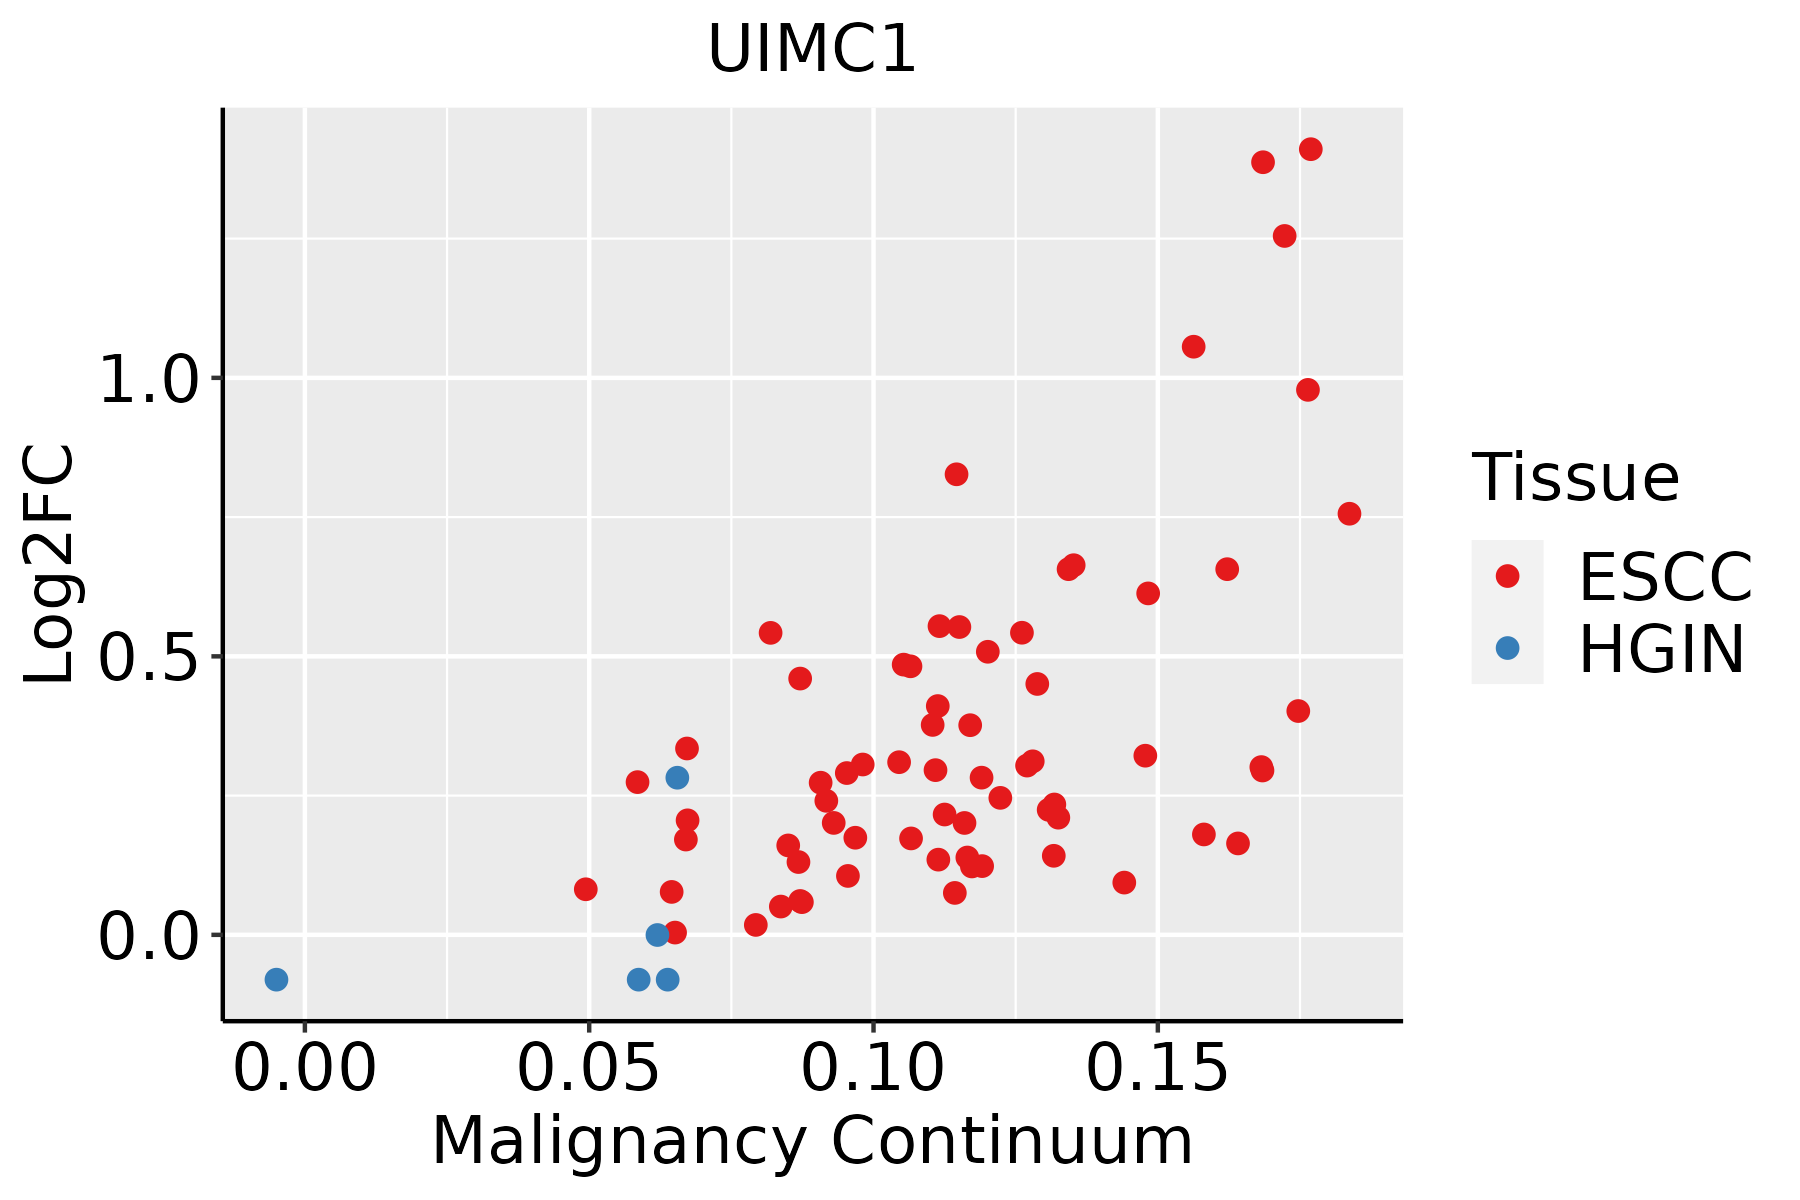 | ESCC: Esophageal squamous cell carcinoma |
| HGIN: High-grade intraepithelial neoplasias | ||
| LGIN: Low-grade intraepithelial neoplasias | ||
| Oral Cavity | 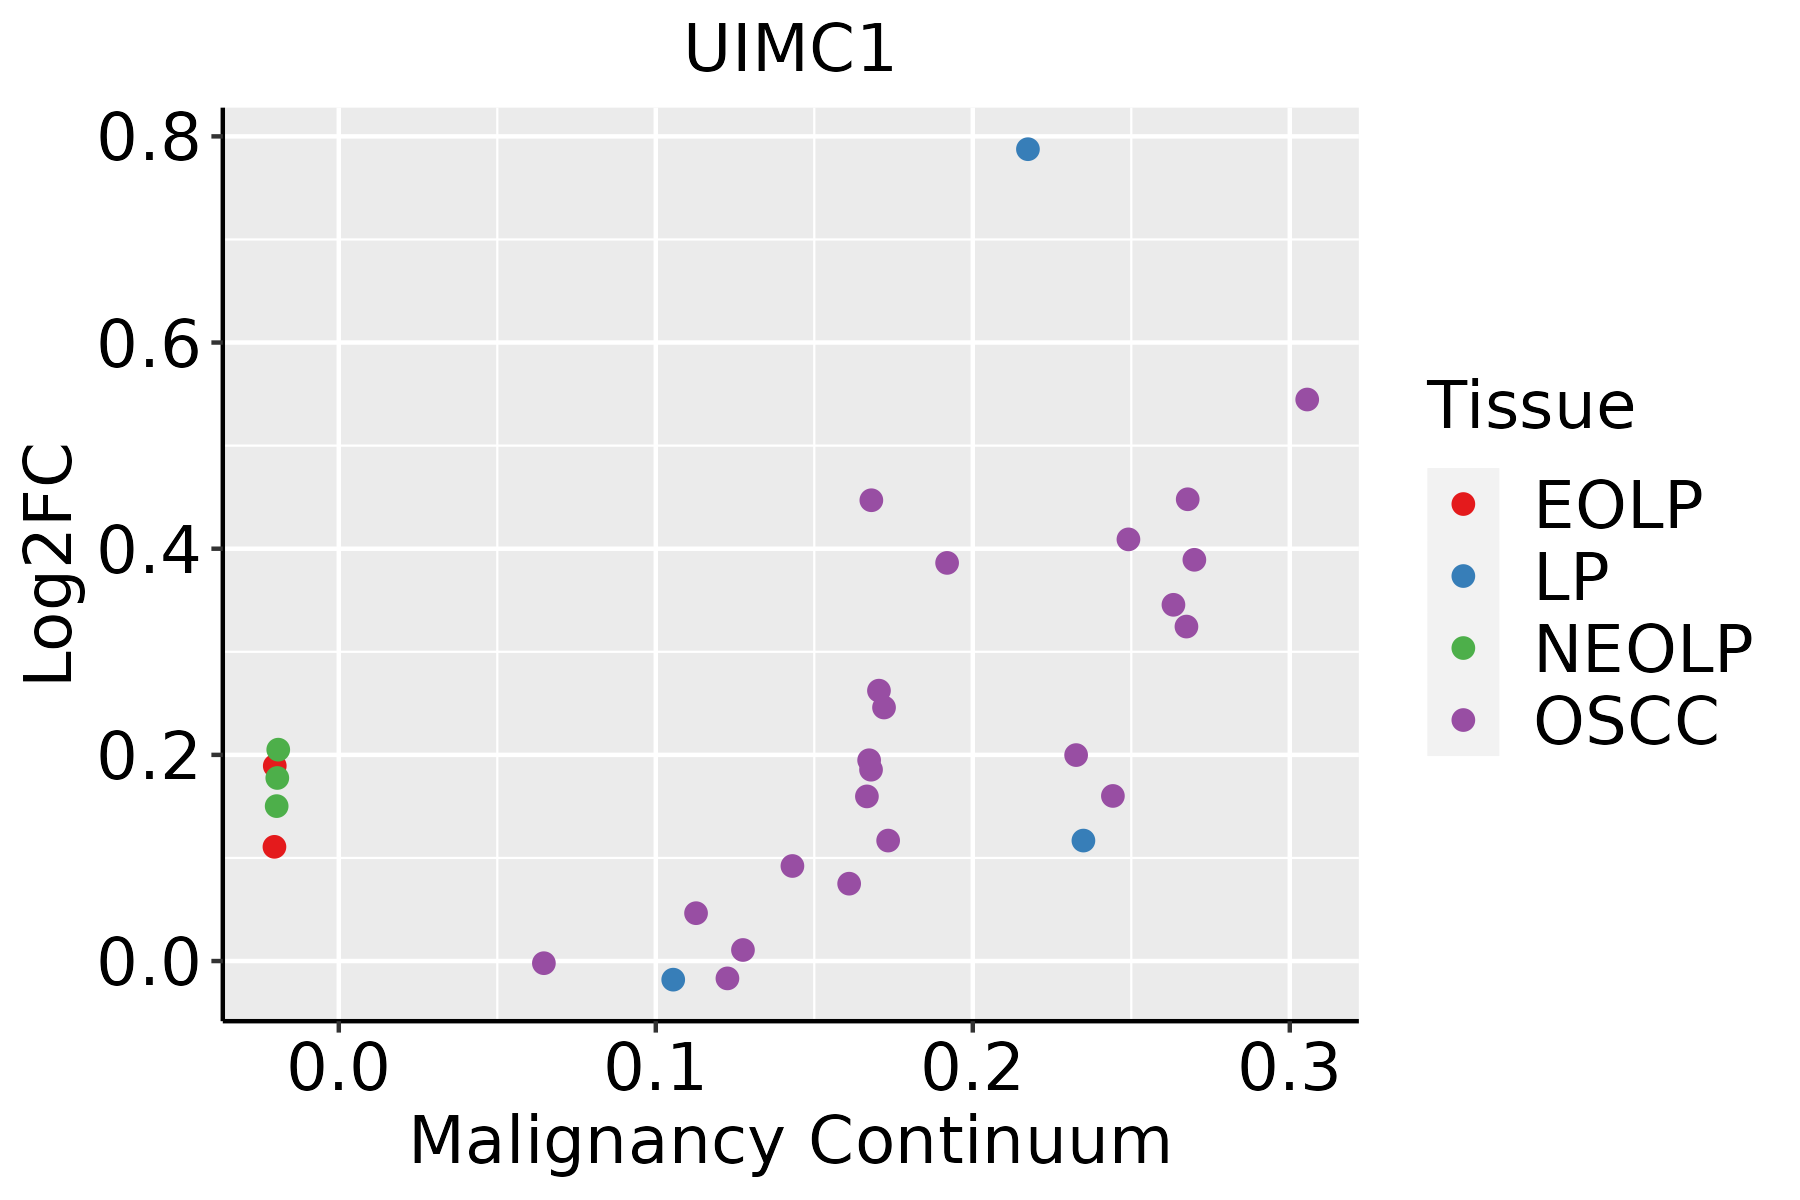 | EOLP: Erosive Oral lichen planus |
| LP: leukoplakia | ||
| NEOLP: Non-erosive oral lichen planus | ||
| OSCC: Oral squamous cell carcinoma | ||
| Thyroid | 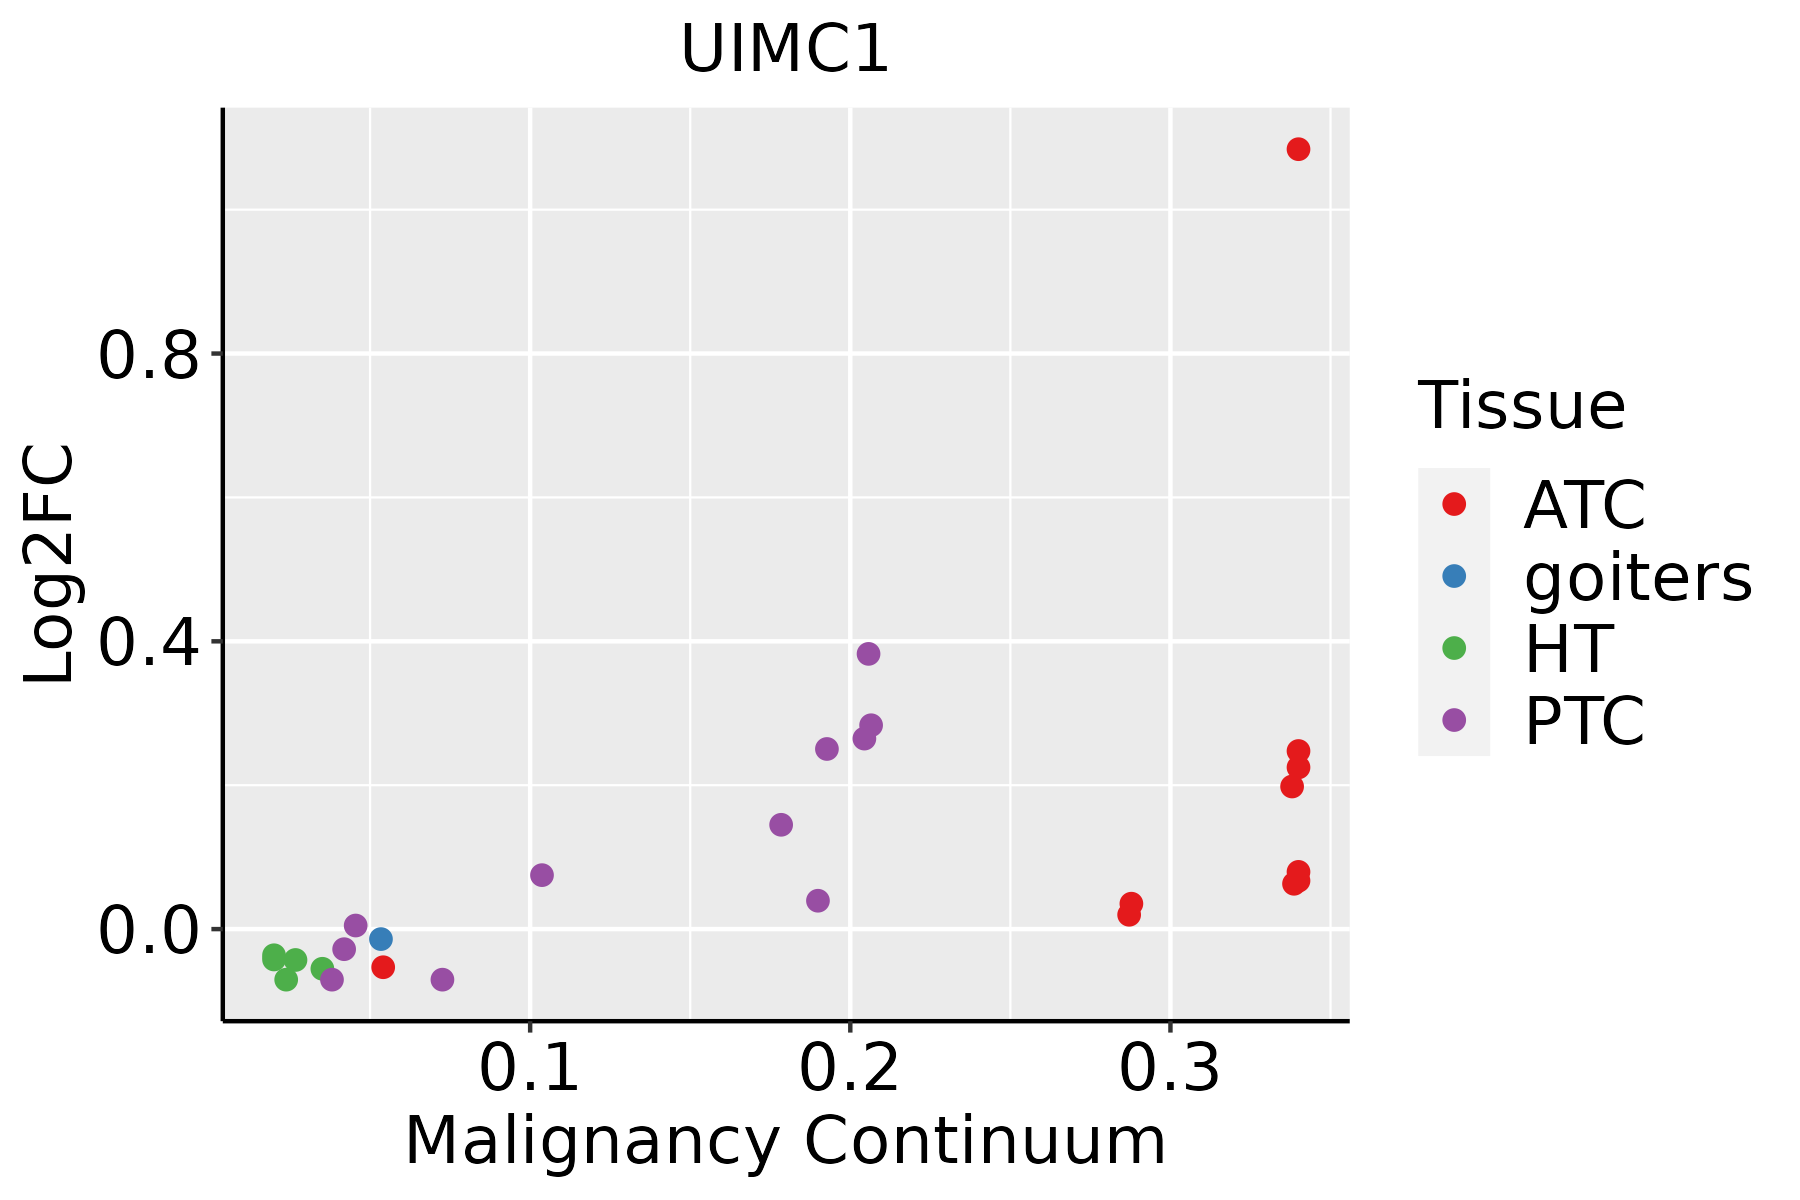 | ATC: Anaplastic thyroid cancer |
| HT: Hashimoto's thyroiditis | ||
| PTC: Papillary thyroid cancer |
| ∗log2FC in expression of this searched gene in stem-like cells from each diseased tissue sample relative to stem-like cells in normal samples in each tissue plotted against the malignancy continuum. Samples are colored based on if they are from different disease stage. |
Top |
Malignant transformation related pathway analysis |
| Find out the enriched GO biological processes and KEGG pathways involved in transition from healthy to precancer to cancer |
| Tissue | Disease Stage | Enriched GO biological Processes |
| Colorectum | AD |  |
| Colorectum | SER |  |
| Colorectum | MSS |  |
| Colorectum | MSI-H |  |
| Colorectum | FAP |  |
| ∗Top 15 enriched GO BP terms are showed in the bar plot of each disease state in each tissue. Each row represents a significant GO biological process which is colored according to the -log10(p.adjust). |
| Page: 1 2 3 4 5 6 7 8 9 |
| GO ID | Tissue | Disease Stage | Description | Gene Ratio | Bg Ratio | pvalue | p.adjust | Count |
| GO:20010222 | Colorectum | FAP | positive regulation of response to DNA damage stimulus | 27/2622 | 105/18723 | 1.04e-03 | 1.02e-02 | 27 |
| GO:00073462 | Colorectum | FAP | regulation of mitotic cell cycle | 85/2622 | 457/18723 | 3.41e-03 | 2.48e-02 | 85 |
| GO:00457391 | Colorectum | FAP | positive regulation of DNA repair | 19/2622 | 73/18723 | 4.71e-03 | 3.17e-02 | 19 |
| GO:00510545 | Colorectum | CRC | positive regulation of DNA metabolic process | 46/2078 | 201/18723 | 1.26e-06 | 7.21e-05 | 46 |
| GO:00510525 | Colorectum | CRC | regulation of DNA metabolic process | 70/2078 | 359/18723 | 1.75e-06 | 8.92e-05 | 70 |
| GO:20010205 | Colorectum | CRC | regulation of response to DNA damage stimulus | 45/2078 | 219/18723 | 3.13e-05 | 8.09e-04 | 45 |
| GO:00062823 | Colorectum | CRC | regulation of DNA repair | 30/2078 | 130/18723 | 7.15e-05 | 1.52e-03 | 30 |
| GO:20010223 | Colorectum | CRC | positive regulation of response to DNA damage stimulus | 25/2078 | 105/18723 | 1.64e-04 | 2.94e-03 | 25 |
| GO:00165702 | Colorectum | CRC | histone modification | 75/2078 | 463/18723 | 4.95e-04 | 7.06e-03 | 75 |
| GO:00457392 | Colorectum | CRC | positive regulation of DNA repair | 18/2078 | 73/18723 | 8.33e-04 | 1.04e-02 | 18 |
| GO:001657015 | Esophagus | ESCC | histone modification | 323/8552 | 463/18723 | 2.61e-26 | 7.88e-24 | 323 |
| GO:004477216 | Esophagus | ESCC | mitotic cell cycle phase transition | 281/8552 | 424/18723 | 4.63e-18 | 4.45e-16 | 281 |
| GO:000734615 | Esophagus | ESCC | regulation of mitotic cell cycle | 293/8552 | 457/18723 | 8.00e-16 | 5.64e-14 | 293 |
| GO:005105215 | Esophagus | ESCC | regulation of DNA metabolic process | 232/8552 | 359/18723 | 2.40e-13 | 1.13e-11 | 232 |
| GO:001021217 | Esophagus | ESCC | response to ionizing radiation | 110/8552 | 148/18723 | 1.11e-12 | 4.78e-11 | 110 |
| GO:005105417 | Esophagus | ESCC | positive regulation of DNA metabolic process | 139/8552 | 201/18723 | 1.20e-11 | 4.33e-10 | 139 |
| GO:190198713 | Esophagus | ESCC | regulation of cell cycle phase transition | 242/8552 | 390/18723 | 3.86e-11 | 1.26e-09 | 242 |
| GO:000931419 | Esophagus | ESCC | response to radiation | 277/8552 | 456/18723 | 4.42e-11 | 1.43e-09 | 277 |
| GO:190199013 | Esophagus | ESCC | regulation of mitotic cell cycle phase transition | 191/8552 | 299/18723 | 1.35e-10 | 3.94e-09 | 191 |
| GO:00457865 | Esophagus | ESCC | negative regulation of cell cycle | 236/8552 | 385/18723 | 3.62e-10 | 9.93e-09 | 236 |
| Page: 1 2 3 4 5 6 7 8 9 10 11 |
| Pathway ID | Tissue | Disease Stage | Description | Gene Ratio | Bg Ratio | pvalue | p.adjust | qvalue | Count |
| Page: 1 |
Top |
Cell-cell communication analysis |
| Identification of potential cell-cell interactions between two cell types and their ligand-receptor pairs for different disease states |
| Ligand | Receptor | LRpair | Pathway | Tissue | Disease Stage |
| Page: 1 |
Top |
Single-cell gene regulatory network inference analysis |
| Find out the significant the regulons (TFs) and the target genes of each regulon across cell types for different disease states |
| TF | Cell Type | Tissue | Disease Stage | Target Gene | RSS | Regulon Activity |
| ∗The dot plots of a searched regulon are shown for all cell subpopulations in each disease state of each tissue based on the regulon specific score inferred using pySCENIC and by calculating the average expression. |
| Page: 1 |
Top |
Somatic mutation of malignant transformation related genes |
| Annotation of somatic variants for genes involved in malignant transformation |
| Hugo Symbol | Variant Class | Variant Classification | dbSNP RS | HGVSc | HGVSp | HGVSp Short | SWISSPROT | BIOTYPE | SIFT | PolyPhen | Tumor Sample Barcode | Tissue | Histology | Sex | Age | Stage | Therapy Types | Drugs | Outcome |
| UIMC1 | SNV | Missense_Mutation | c.461N>G | p.Glu154Gly | p.E154G | Q96RL1 | protein_coding | tolerated(0.33) | benign(0.135) | TCGA-C8-A27A-01 | Breast | breast invasive carcinoma | Female | <65 | I/II | Chemotherapy | 5-fluorouracil | CR | |
| UIMC1 | SNV | Missense_Mutation | novel | c.1222N>C | p.Glu408Gln | p.E408Q | Q96RL1 | protein_coding | deleterious(0.01) | benign(0.224) | TCGA-S3-AA0Z-01 | Breast | breast invasive carcinoma | Female | <65 | I/II | Ancillary | neulasta | CR |
| UIMC1 | SNV | Missense_Mutation | c.977N>G | p.Pro326Arg | p.P326R | Q96RL1 | protein_coding | deleterious(0) | probably_damaging(0.996) | TCGA-FU-A3TQ-01 | Cervix | cervical & endocervical cancer | Female | <65 | III/IV | Unknown | Unknown | SD | |
| UIMC1 | insertion | Frame_Shift_Ins | novel | c.954_955insTCCTT | p.Gly319SerfsTer15 | p.G319Sfs*15 | Q96RL1 | protein_coding | TCGA-DS-A1OA-01 | Cervix | cervical & endocervical cancer | Female | >=65 | I/II | Chemotherapy | carboplatin | PD | ||
| UIMC1 | SNV | Missense_Mutation | c.350N>T | p.Ser117Ile | p.S117I | Q96RL1 | protein_coding | deleterious(0) | probably_damaging(0.999) | TCGA-AA-A01P-01 | Colorectum | colon adenocarcinoma | Female | >=65 | III/IV | Unknown | Unknown | PD | |
| UIMC1 | SNV | Missense_Mutation | novel | c.1912N>A | p.Asp638Asn | p.D638N | Q96RL1 | protein_coding | tolerated(0.1) | possibly_damaging(0.846) | TCGA-CA-6717-01 | Colorectum | colon adenocarcinoma | Male | <65 | I/II | Chemotherapy | oxaliplatin | CR |
| UIMC1 | SNV | Missense_Mutation | novel | c.1054G>T | p.Asp352Tyr | p.D352Y | Q96RL1 | protein_coding | deleterious(0) | probably_damaging(0.935) | TCGA-AG-A002-01 | Colorectum | rectum adenocarcinoma | Male | <65 | I/II | Unknown | Unknown | SD |
| UIMC1 | SNV | Missense_Mutation | rs779796802 | c.365N>A | p.Arg122Gln | p.R122Q | Q96RL1 | protein_coding | tolerated(1) | benign(0.003) | TCGA-AG-A032-01 | Colorectum | rectum adenocarcinoma | Male | >=65 | III/IV | Targeted Molecular therapy | bevacizumab | PD |
| UIMC1 | insertion | Nonsense_Mutation | novel | c.2034_2035insTACTAATGGTTTT | p.Val679TyrfsTer2 | p.V679Yfs*2 | Q96RL1 | protein_coding | TCGA-AM-5820-01 | Colorectum | colon adenocarcinoma | Female | <65 | I/II | Unknown | Unknown | SD | ||
| UIMC1 | SNV | Missense_Mutation | novel | c.1916N>A | p.Ala639Glu | p.A639E | Q96RL1 | protein_coding | deleterious(0) | benign(0.29) | TCGA-A5-A0G2-01 | Endometrium | uterine corpus endometrioid carcinoma | Female | <65 | III/IV | Unknown | Unknown | SD |
| Page: 1 2 3 4 5 6 |
Top |
Related drugs of malignant transformation related genes |
| Identification of chemicals and drugs interact with genes involved in malignant transfromation |
| (DGIdb 4.0) |
| Entrez ID | Symbol | Category | Interaction Types | Drug Claim Name | Drug Name | PMIDs |
| Page: 1 |

Copyright 2023-Present -The University of Texas Health Science Center at Houston |