
|
|||||
|
 | |
| |
| |
| |
| |
| |
|
Gene: UBE2V2 |
Gene summary for UBE2V2 |
| Gene information | Species | Human | Gene symbol | UBE2V2 | Gene ID | 7336 |
| Gene name | ubiquitin conjugating enzyme E2 V2 | |
| Gene Alias | DDVIT1 | |
| Cytomap | 8q11.21 | |
| Gene Type | protein-coding | GO ID | GO:0000209 | UniProtAcc | A0M8W4 |
Top |
Malignant transformation analysis |
| Identification of the aberrant gene expression in precancerous and cancerous lesions by comparing the gene expression of stem-like cells in diseased tissues with normal stem cells |
| Entrez ID | Symbol | Replicates | Species | Organ | Tissue | Adj P-value | Log2FC | Malignancy |
| 7336 | UBE2V2 | GSM4909281 | Human | Breast | IDC | 6.74e-21 | 5.47e-01 | 0.21 |
| 7336 | UBE2V2 | GSM4909282 | Human | Breast | IDC | 2.29e-09 | 3.38e-01 | -0.0288 |
| 7336 | UBE2V2 | GSM4909293 | Human | Breast | IDC | 3.25e-03 | 1.90e-01 | 0.1581 |
| 7336 | UBE2V2 | GSM4909294 | Human | Breast | IDC | 3.54e-10 | 4.06e-01 | 0.2022 |
| 7336 | UBE2V2 | GSM4909296 | Human | Breast | IDC | 5.52e-06 | -2.01e-01 | 0.1524 |
| 7336 | UBE2V2 | GSM4909297 | Human | Breast | IDC | 1.16e-06 | -4.04e-02 | 0.1517 |
| 7336 | UBE2V2 | GSM4909301 | Human | Breast | IDC | 2.10e-04 | -2.02e-01 | 0.1577 |
| 7336 | UBE2V2 | GSM4909311 | Human | Breast | IDC | 1.00e-19 | -2.09e-01 | 0.1534 |
| 7336 | UBE2V2 | GSM4909312 | Human | Breast | IDC | 7.24e-09 | -4.95e-02 | 0.1552 |
| 7336 | UBE2V2 | GSM4909315 | Human | Breast | IDC | 1.61e-10 | 4.69e-01 | 0.21 |
| 7336 | UBE2V2 | GSM4909317 | Human | Breast | IDC | 2.52e-11 | 5.13e-01 | 0.1355 |
| 7336 | UBE2V2 | GSM4909318 | Human | Breast | IDC | 7.32e-05 | 5.37e-01 | 0.2031 |
| 7336 | UBE2V2 | GSM4909319 | Human | Breast | IDC | 3.82e-21 | -1.57e-01 | 0.1563 |
| 7336 | UBE2V2 | GSM4909320 | Human | Breast | IDC | 8.31e-05 | -2.19e-01 | 0.1575 |
| 7336 | UBE2V2 | GSM4909321 | Human | Breast | IDC | 3.46e-08 | -1.40e-01 | 0.1559 |
| 7336 | UBE2V2 | brca1 | Human | Breast | Precancer | 3.42e-08 | 3.13e-01 | -0.0338 |
| 7336 | UBE2V2 | brca2 | Human | Breast | Precancer | 6.99e-07 | 2.84e-01 | -0.024 |
| 7336 | UBE2V2 | brca3 | Human | Breast | Precancer | 1.44e-02 | 2.31e-01 | -0.0263 |
| 7336 | UBE2V2 | NCCBC14 | Human | Breast | DCIS | 2.68e-03 | 5.61e-02 | 0.2021 |
| 7336 | UBE2V2 | NCCBC5 | Human | Breast | DCIS | 1.54e-06 | 6.30e-02 | 0.2046 |
| Page: 1 2 3 4 5 6 7 8 |
| Tissue | Expression Dynamics | Abbreviation |
| Breast | 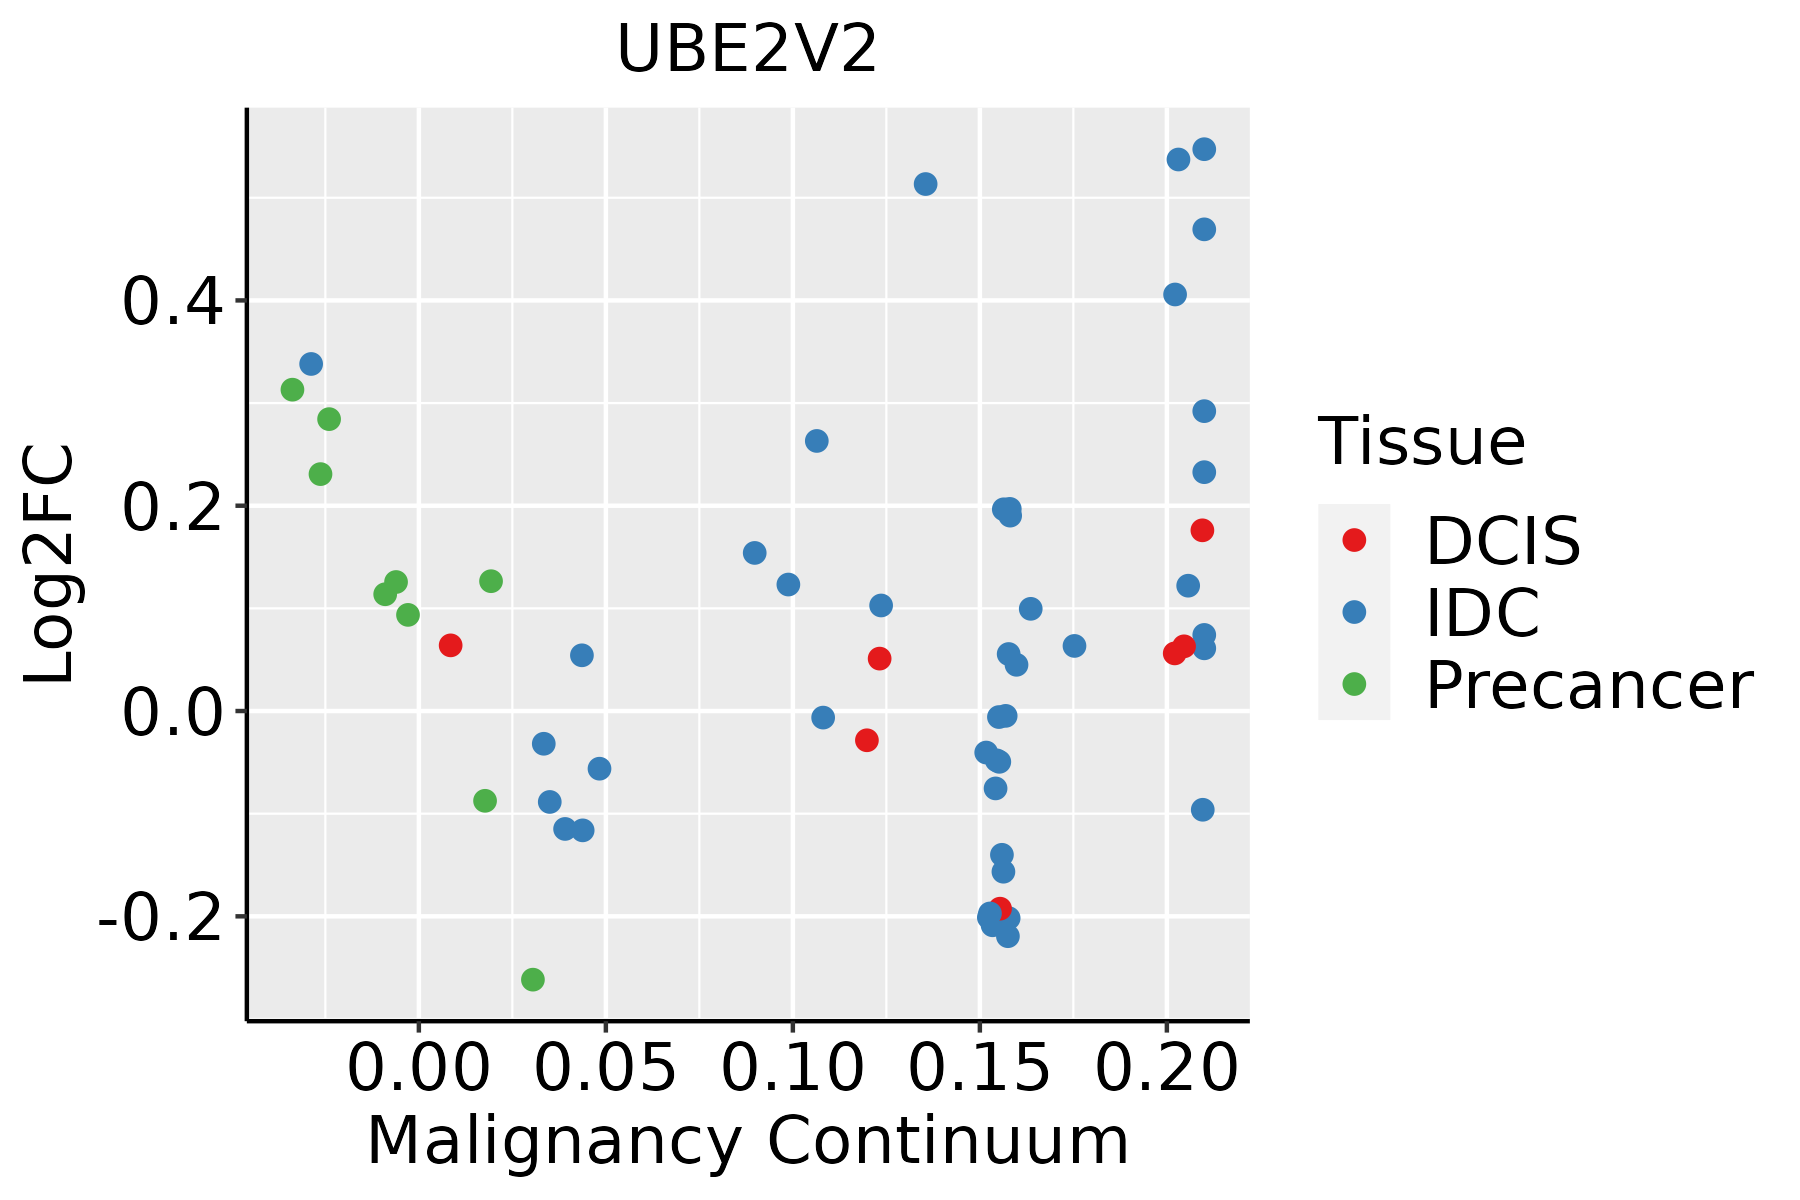 | IDC: Invasive ductal carcinoma |
| DCIS: Ductal carcinoma in situ | ||
| Precancer(BRCA1-mut): Precancerous lesion from BRCA1 mutation carriers | ||
| Esophagus | 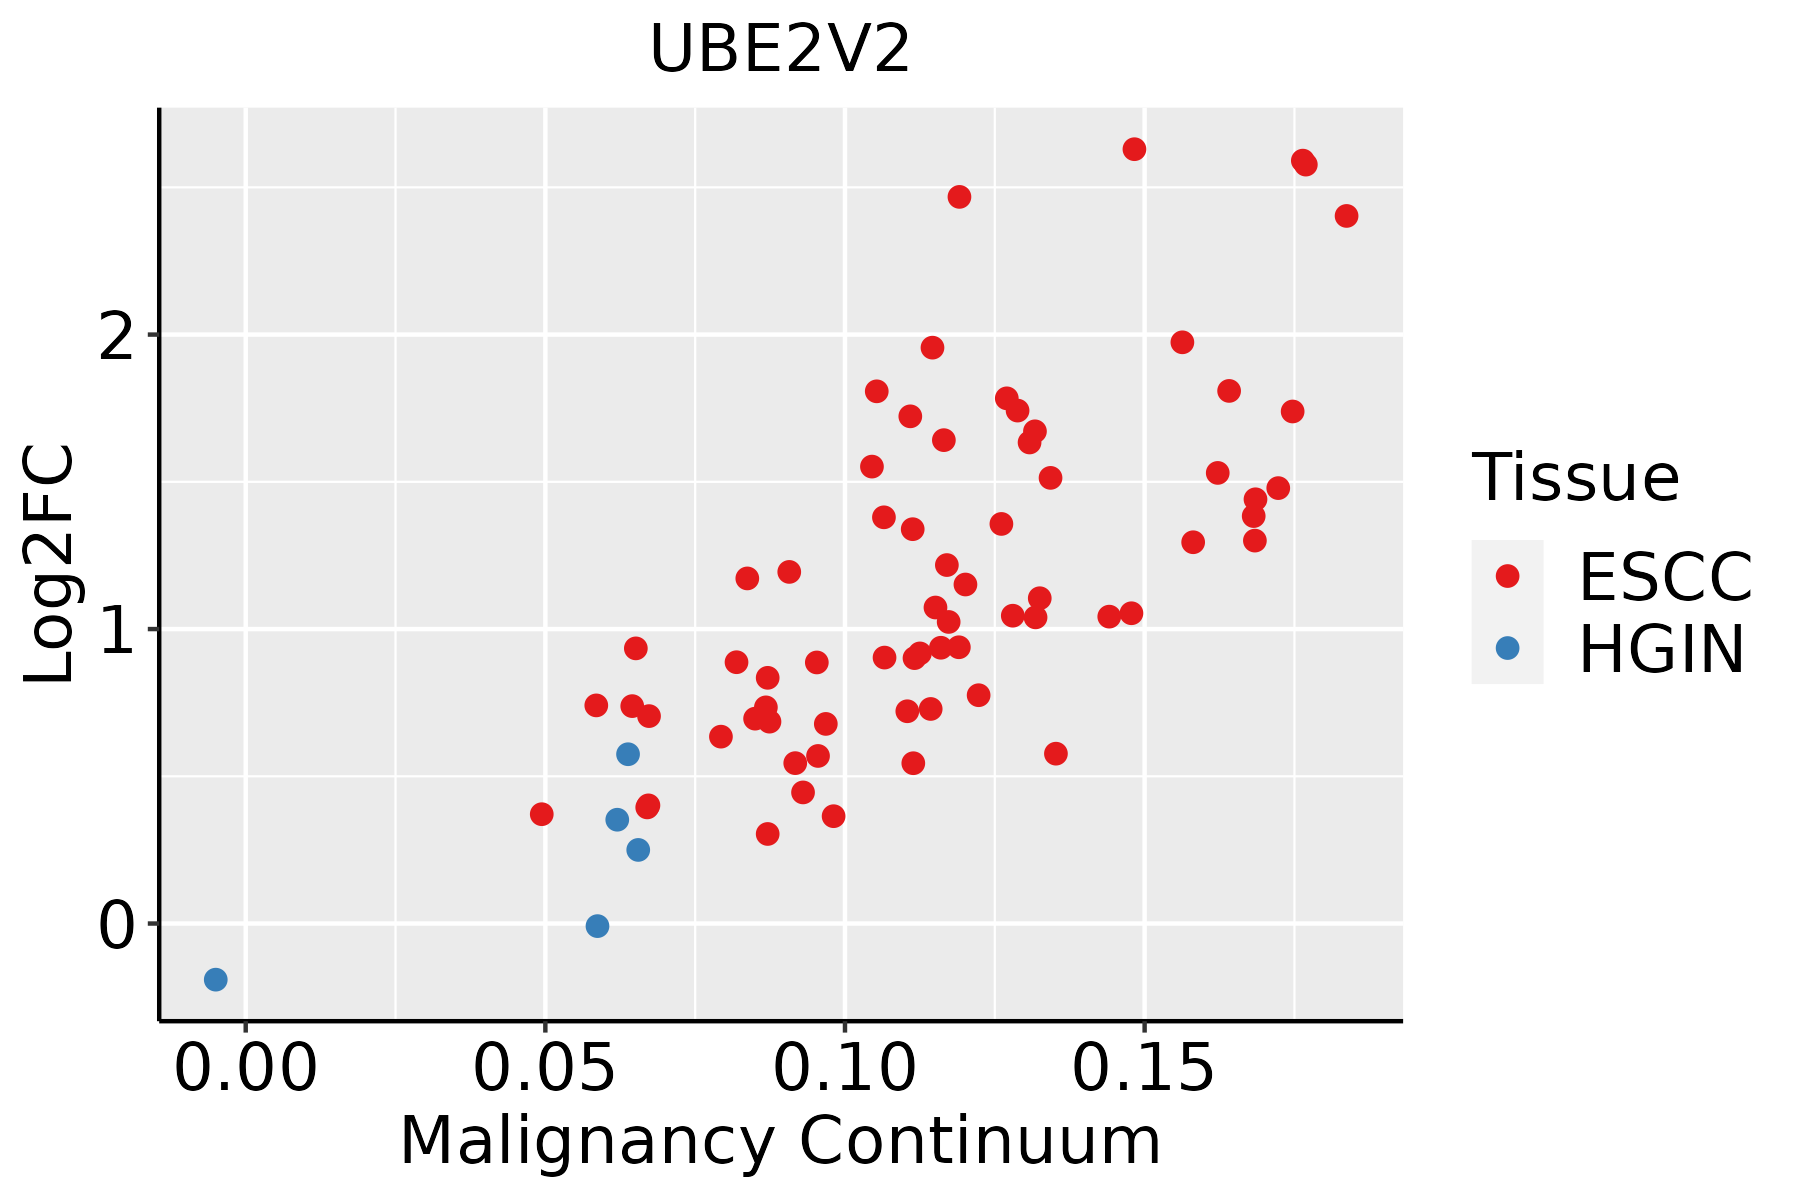 | ESCC: Esophageal squamous cell carcinoma |
| HGIN: High-grade intraepithelial neoplasias | ||
| LGIN: Low-grade intraepithelial neoplasias | ||
| Liver |  | HCC: Hepatocellular carcinoma |
| NAFLD: Non-alcoholic fatty liver disease | ||
| Oral Cavity | 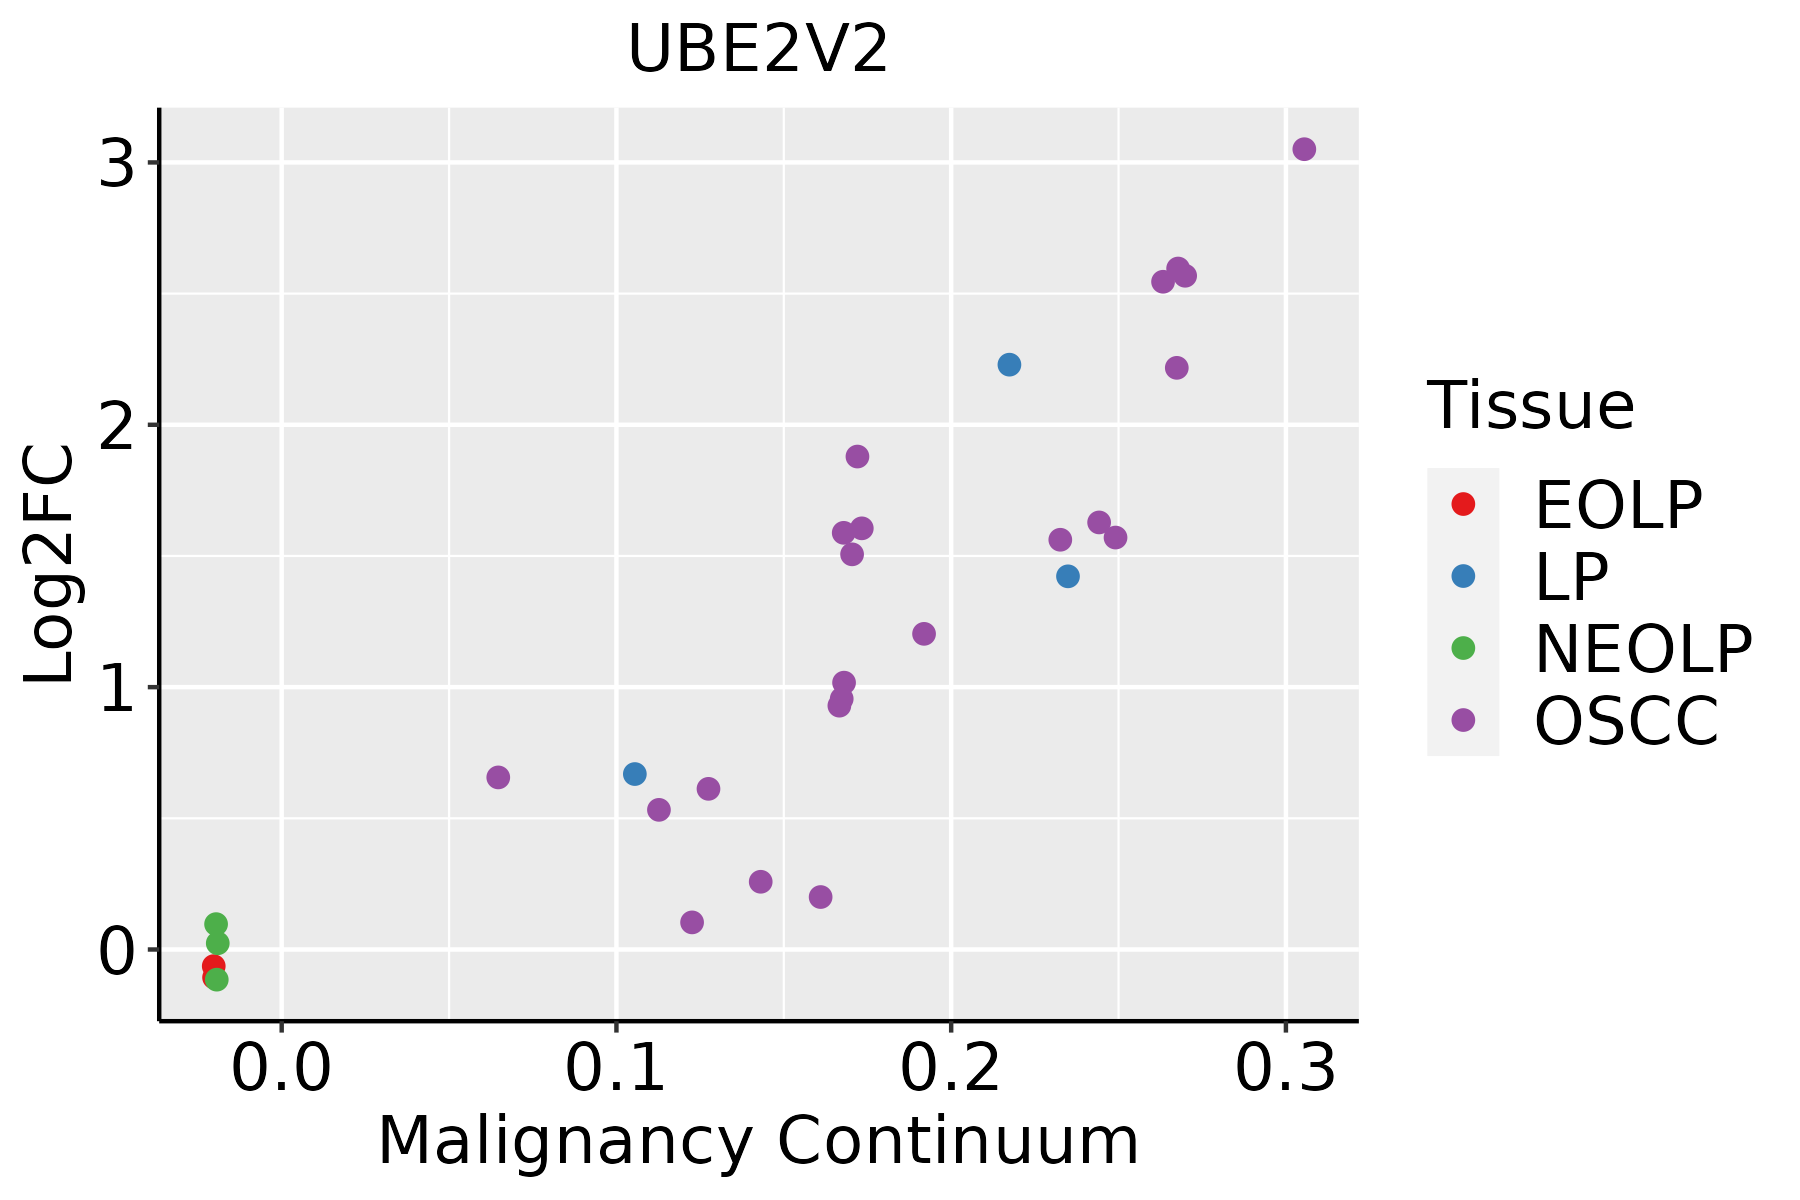 | EOLP: Erosive Oral lichen planus |
| LP: leukoplakia | ||
| NEOLP: Non-erosive oral lichen planus | ||
| OSCC: Oral squamous cell carcinoma | ||
| Skin |  | AK: Actinic keratosis |
| cSCC: Cutaneous squamous cell carcinoma | ||
| SCCIS:squamous cell carcinoma in situ | ||
| Thyroid |  | ATC: Anaplastic thyroid cancer |
| HT: Hashimoto's thyroiditis | ||
| PTC: Papillary thyroid cancer |
| ∗log2FC in expression of this searched gene in stem-like cells from each diseased tissue sample relative to stem-like cells in normal samples in each tissue plotted against the malignancy continuum. Samples are colored based on if they are from different disease stage. |
Top |
Malignant transformation related pathway analysis |
| Find out the enriched GO biological processes and KEGG pathways involved in transition from healthy to precancer to cancer |
| Tissue | Disease Stage | Enriched GO biological Processes |
| Colorectum | AD |  |
| Colorectum | SER |  |
| Colorectum | MSS |  |
| Colorectum | MSI-H |  |
| Colorectum | FAP |  |
| ∗Top 15 enriched GO BP terms are showed in the bar plot of each disease state in each tissue. Each row represents a significant GO biological process which is colored according to the -log10(p.adjust). |
| Page: 1 2 3 4 5 6 7 8 9 |
| GO ID | Tissue | Disease Stage | Description | Gene Ratio | Bg Ratio | pvalue | p.adjust | Count |
| GO:20010208 | Breast | Precancer | regulation of response to DNA damage stimulus | 24/1080 | 219/18723 | 1.93e-03 | 1.87e-02 | 24 |
| GO:19018007 | Breast | Precancer | positive regulation of proteasomal protein catabolic process | 15/1080 | 114/18723 | 2.31e-03 | 2.15e-02 | 15 |
| GO:00324349 | Breast | Precancer | regulation of proteasomal ubiquitin-dependent protein catabolic process | 16/1080 | 134/18723 | 4.51e-03 | 3.50e-02 | 16 |
| GO:004586214 | Breast | IDC | positive regulation of proteolysis | 66/1434 | 372/18723 | 9.76e-11 | 1.29e-08 | 66 |
| GO:001049814 | Breast | IDC | proteasomal protein catabolic process | 75/1434 | 490/18723 | 5.59e-09 | 4.41e-07 | 75 |
| GO:004217614 | Breast | IDC | regulation of protein catabolic process | 63/1434 | 391/18723 | 1.32e-08 | 9.61e-07 | 63 |
| GO:190336214 | Breast | IDC | regulation of cellular protein catabolic process | 46/1434 | 255/18723 | 4.00e-08 | 2.68e-06 | 46 |
| GO:190305014 | Breast | IDC | regulation of proteolysis involved in cellular protein catabolic process | 41/1434 | 221/18723 | 9.77e-08 | 5.84e-06 | 41 |
| GO:007099714 | Breast | IDC | neuron death | 57/1434 | 361/18723 | 1.31e-07 | 7.38e-06 | 57 |
| GO:005140213 | Breast | IDC | neuron apoptotic process | 42/1434 | 246/18723 | 7.21e-07 | 3.35e-05 | 42 |
| GO:190121414 | Breast | IDC | regulation of neuron death | 48/1434 | 319/18723 | 5.01e-06 | 1.69e-04 | 48 |
| GO:006113614 | Breast | IDC | regulation of proteasomal protein catabolic process | 33/1434 | 187/18723 | 5.24e-06 | 1.75e-04 | 33 |
| GO:190336414 | Breast | IDC | positive regulation of cellular protein catabolic process | 29/1434 | 155/18723 | 5.93e-06 | 1.90e-04 | 29 |
| GO:200005814 | Breast | IDC | regulation of ubiquitin-dependent protein catabolic process | 30/1434 | 164/18723 | 6.62e-06 | 2.05e-04 | 30 |
| GO:004316114 | Breast | IDC | proteasome-mediated ubiquitin-dependent protein catabolic process | 57/1434 | 412/18723 | 9.55e-06 | 2.68e-04 | 57 |
| GO:004352313 | Breast | IDC | regulation of neuron apoptotic process | 35/1434 | 212/18723 | 1.26e-05 | 3.29e-04 | 35 |
| GO:004573214 | Breast | IDC | positive regulation of protein catabolic process | 37/1434 | 231/18723 | 1.46e-05 | 3.71e-04 | 37 |
| GO:190305213 | Breast | IDC | positive regulation of proteolysis involved in cellular protein catabolic process | 25/1434 | 133/18723 | 2.34e-05 | 5.59e-04 | 25 |
| GO:190180014 | Breast | IDC | positive regulation of proteasomal protein catabolic process | 22/1434 | 114/18723 | 4.68e-05 | 1.04e-03 | 22 |
| GO:000989614 | Breast | IDC | positive regulation of catabolic process | 62/1434 | 492/18723 | 7.06e-05 | 1.42e-03 | 62 |
| Page: 1 2 3 4 5 6 7 8 9 10 11 12 13 14 15 16 17 18 |
| Pathway ID | Tissue | Disease Stage | Description | Gene Ratio | Bg Ratio | pvalue | p.adjust | qvalue | Count |
| hsa0513118 | Breast | Precancer | Shigellosis | 44/684 | 247/8465 | 3.91e-07 | 6.86e-06 | 5.26e-06 | 44 |
| hsa0513119 | Breast | Precancer | Shigellosis | 44/684 | 247/8465 | 3.91e-07 | 6.86e-06 | 5.26e-06 | 44 |
| hsa0513124 | Breast | IDC | Shigellosis | 47/867 | 247/8465 | 1.78e-05 | 2.00e-04 | 1.49e-04 | 47 |
| hsa0513134 | Breast | IDC | Shigellosis | 47/867 | 247/8465 | 1.78e-05 | 2.00e-04 | 1.49e-04 | 47 |
| hsa0513144 | Breast | DCIS | Shigellosis | 46/846 | 247/8465 | 2.06e-05 | 2.38e-04 | 1.75e-04 | 46 |
| hsa0513154 | Breast | DCIS | Shigellosis | 46/846 | 247/8465 | 2.06e-05 | 2.38e-04 | 1.75e-04 | 46 |
| hsa05131211 | Esophagus | ESCC | Shigellosis | 176/4205 | 247/8465 | 2.27e-12 | 4.01e-11 | 2.05e-11 | 176 |
| hsa05131310 | Esophagus | ESCC | Shigellosis | 176/4205 | 247/8465 | 2.27e-12 | 4.01e-11 | 2.05e-11 | 176 |
| hsa0513122 | Liver | Cirrhotic | Shigellosis | 105/2530 | 247/8465 | 1.31e-05 | 1.21e-04 | 7.48e-05 | 105 |
| hsa0513132 | Liver | Cirrhotic | Shigellosis | 105/2530 | 247/8465 | 1.31e-05 | 1.21e-04 | 7.48e-05 | 105 |
| hsa0513142 | Liver | HCC | Shigellosis | 150/4020 | 247/8465 | 1.53e-05 | 1.04e-04 | 5.81e-05 | 150 |
| hsa0513152 | Liver | HCC | Shigellosis | 150/4020 | 247/8465 | 1.53e-05 | 1.04e-04 | 5.81e-05 | 150 |
| hsa0513130 | Oral cavity | OSCC | Shigellosis | 150/3704 | 247/8465 | 3.96e-08 | 3.12e-07 | 1.59e-07 | 150 |
| hsa05131113 | Oral cavity | OSCC | Shigellosis | 150/3704 | 247/8465 | 3.96e-08 | 3.12e-07 | 1.59e-07 | 150 |
| hsa05131210 | Oral cavity | LP | Shigellosis | 103/2418 | 247/8465 | 4.98e-06 | 4.14e-05 | 2.67e-05 | 103 |
| hsa0513138 | Oral cavity | LP | Shigellosis | 103/2418 | 247/8465 | 4.98e-06 | 4.14e-05 | 2.67e-05 | 103 |
| Page: 1 |
Top |
Cell-cell communication analysis |
| Identification of potential cell-cell interactions between two cell types and their ligand-receptor pairs for different disease states |
| Ligand | Receptor | LRpair | Pathway | Tissue | Disease Stage |
| Page: 1 |
Top |
Single-cell gene regulatory network inference analysis |
| Find out the significant the regulons (TFs) and the target genes of each regulon across cell types for different disease states |
| TF | Cell Type | Tissue | Disease Stage | Target Gene | RSS | Regulon Activity |
| ∗The dot plots of a searched regulon are shown for all cell subpopulations in each disease state of each tissue based on the regulon specific score inferred using pySCENIC and by calculating the average expression. |
| Page: 1 |
Top |
Somatic mutation of malignant transformation related genes |
| Annotation of somatic variants for genes involved in malignant transformation |
| Hugo Symbol | Variant Class | Variant Classification | dbSNP RS | HGVSc | HGVSp | HGVSp Short | SWISSPROT | BIOTYPE | SIFT | PolyPhen | Tumor Sample Barcode | Tissue | Histology | Sex | Age | Stage | Therapy Types | Drugs | Outcome |
| UBE2V2 | SNV | Missense_Mutation | c.281N>G | p.Ser94Cys | p.S94C | Q15819 | protein_coding | deleterious(0) | benign(0.017) | TCGA-E2-A1IN-01 | Breast | breast invasive carcinoma | Female | <65 | I/II | Hormone Therapy | arimidex | SD | |
| UBE2V2 | SNV | Missense_Mutation | novel | c.223G>C | p.Glu75Gln | p.E75Q | Q15819 | protein_coding | tolerated(0.1) | benign(0.027) | TCGA-ZJ-AAXD-01 | Cervix | cervical & endocervical cancer | Female | <65 | III/IV | Unknown | Unknown | SD |
| UBE2V2 | SNV | Missense_Mutation | c.229N>T | p.Pro77Ser | p.P77S | Q15819 | protein_coding | deleterious(0.03) | possibly_damaging(0.653) | TCGA-CM-5348-01 | Colorectum | colon adenocarcinoma | Male | >=65 | III/IV | Unknown | Unknown | SD | |
| UBE2V2 | SNV | Missense_Mutation | c.32N>A | p.Arg11His | p.R11H | Q15819 | protein_coding | tolerated(0.11) | benign(0.069) | TCGA-AP-A059-01 | Endometrium | uterine corpus endometrioid carcinoma | Female | >=65 | I/II | Unknown | Unknown | SD | |
| UBE2V2 | SNV | Missense_Mutation | rs11557776 | c.107N>G | p.Glu36Gly | p.E36G | Q15819 | protein_coding | deleterious(0.02) | possibly_damaging(0.894) | TCGA-AX-A06F-01 | Endometrium | uterine corpus endometrioid carcinoma | Female | <65 | III/IV | Chemotherapy | carboplatin | SD |
| UBE2V2 | SNV | Missense_Mutation | rs772913593 | c.371N>A | p.Arg124His | p.R124H | Q15819 | protein_coding | tolerated(0.15) | benign(0.009) | TCGA-AX-A1CE-01 | Endometrium | uterine corpus endometrioid carcinoma | Female | <65 | I/II | Unspecific | Paclitaxel | SD |
| UBE2V2 | SNV | Missense_Mutation | c.124N>G | p.Thr42Ala | p.T42A | Q15819 | protein_coding | tolerated(0.13) | benign(0.011) | TCGA-B5-A11E-01 | Endometrium | uterine corpus endometrioid carcinoma | Female | <65 | I/II | Unknown | Unknown | SD | |
| UBE2V2 | SNV | Missense_Mutation | novel | c.143N>A | p.Gly48Asp | p.G48D | Q15819 | protein_coding | deleterious(0.02) | benign(0.39) | TCGA-B5-A1MX-01 | Endometrium | uterine corpus endometrioid carcinoma | Female | <65 | I/II | Hormone Therapy | megace | SD |
| UBE2V2 | SNV | Missense_Mutation | c.32G>A | p.Arg11His | p.R11H | Q15819 | protein_coding | tolerated(0.11) | benign(0.069) | TCGA-B5-A3FC-01 | Endometrium | uterine corpus endometrioid carcinoma | Female | <65 | I/II | Unknown | Unknown | SD | |
| UBE2V2 | SNV | Missense_Mutation | novel | c.121A>T | p.Met41Leu | p.M41L | Q15819 | protein_coding | tolerated(0.19) | benign(0.007) | TCGA-BG-A222-01 | Endometrium | uterine corpus endometrioid carcinoma | Female | <65 | I/II | Unknown | Unknown | SD |
| Page: 1 2 |
Top |
Related drugs of malignant transformation related genes |
| Identification of chemicals and drugs interact with genes involved in malignant transfromation |
| (DGIdb 4.0) |
| Entrez ID | Symbol | Category | Interaction Types | Drug Claim Name | Drug Name | PMIDs |
| Page: 1 |

Copyright 2023-Present -The University of Texas Health Science Center at Houston |