
|
|||||
|
 | |
| |
| |
| |
| |
| |
|
Gene: UBE2G2 |
Gene summary for UBE2G2 |
| Gene information | Species | Human | Gene symbol | UBE2G2 | Gene ID | 7327 |
| Gene name | ubiquitin conjugating enzyme E2 G2 | |
| Gene Alias | UBC7 | |
| Cytomap | 21q22.3 | |
| Gene Type | protein-coding | GO ID | GO:0000209 | UniProtAcc | P60604 |
Top |
Malignant transformation analysis |
| Identification of the aberrant gene expression in precancerous and cancerous lesions by comparing the gene expression of stem-like cells in diseased tissues with normal stem cells |
| Entrez ID | Symbol | Replicates | Species | Organ | Tissue | Adj P-value | Log2FC | Malignancy |
| 7327 | UBE2G2 | LZE4T | Human | Esophagus | ESCC | 7.95e-12 | 1.72e-01 | 0.0811 |
| 7327 | UBE2G2 | LZE7T | Human | Esophagus | ESCC | 2.30e-03 | 2.17e-01 | 0.0667 |
| 7327 | UBE2G2 | LZE8T | Human | Esophagus | ESCC | 6.52e-06 | 1.58e-01 | 0.067 |
| 7327 | UBE2G2 | LZE20T | Human | Esophagus | ESCC | 1.10e-06 | 1.44e-01 | 0.0662 |
| 7327 | UBE2G2 | LZE24T | Human | Esophagus | ESCC | 8.99e-20 | 5.17e-01 | 0.0596 |
| 7327 | UBE2G2 | P1T-E | Human | Esophagus | ESCC | 9.82e-07 | 4.53e-01 | 0.0875 |
| 7327 | UBE2G2 | P2T-E | Human | Esophagus | ESCC | 1.75e-30 | 6.47e-01 | 0.1177 |
| 7327 | UBE2G2 | P4T-E | Human | Esophagus | ESCC | 1.25e-31 | 8.41e-01 | 0.1323 |
| 7327 | UBE2G2 | P5T-E | Human | Esophagus | ESCC | 6.39e-14 | 4.55e-01 | 0.1327 |
| 7327 | UBE2G2 | P8T-E | Human | Esophagus | ESCC | 1.93e-12 | 1.72e-01 | 0.0889 |
| 7327 | UBE2G2 | P9T-E | Human | Esophagus | ESCC | 8.39e-12 | 3.62e-01 | 0.1131 |
| 7327 | UBE2G2 | P10T-E | Human | Esophagus | ESCC | 2.58e-48 | 9.27e-01 | 0.116 |
| 7327 | UBE2G2 | P11T-E | Human | Esophagus | ESCC | 8.79e-12 | 3.85e-01 | 0.1426 |
| 7327 | UBE2G2 | P12T-E | Human | Esophagus | ESCC | 1.65e-23 | 4.66e-01 | 0.1122 |
| 7327 | UBE2G2 | P15T-E | Human | Esophagus | ESCC | 1.54e-15 | 2.93e-01 | 0.1149 |
| 7327 | UBE2G2 | P16T-E | Human | Esophagus | ESCC | 2.34e-21 | 5.78e-01 | 0.1153 |
| 7327 | UBE2G2 | P17T-E | Human | Esophagus | ESCC | 4.28e-13 | 5.04e-01 | 0.1278 |
| 7327 | UBE2G2 | P19T-E | Human | Esophagus | ESCC | 1.40e-02 | 3.46e-01 | 0.1662 |
| 7327 | UBE2G2 | P20T-E | Human | Esophagus | ESCC | 1.79e-16 | 3.46e-01 | 0.1124 |
| 7327 | UBE2G2 | P21T-E | Human | Esophagus | ESCC | 1.32e-26 | 5.31e-01 | 0.1617 |
| Page: 1 2 3 4 5 6 |
| Tissue | Expression Dynamics | Abbreviation |
| Esophagus |  | ESCC: Esophageal squamous cell carcinoma |
| HGIN: High-grade intraepithelial neoplasias | ||
| LGIN: Low-grade intraepithelial neoplasias | ||
| Liver | 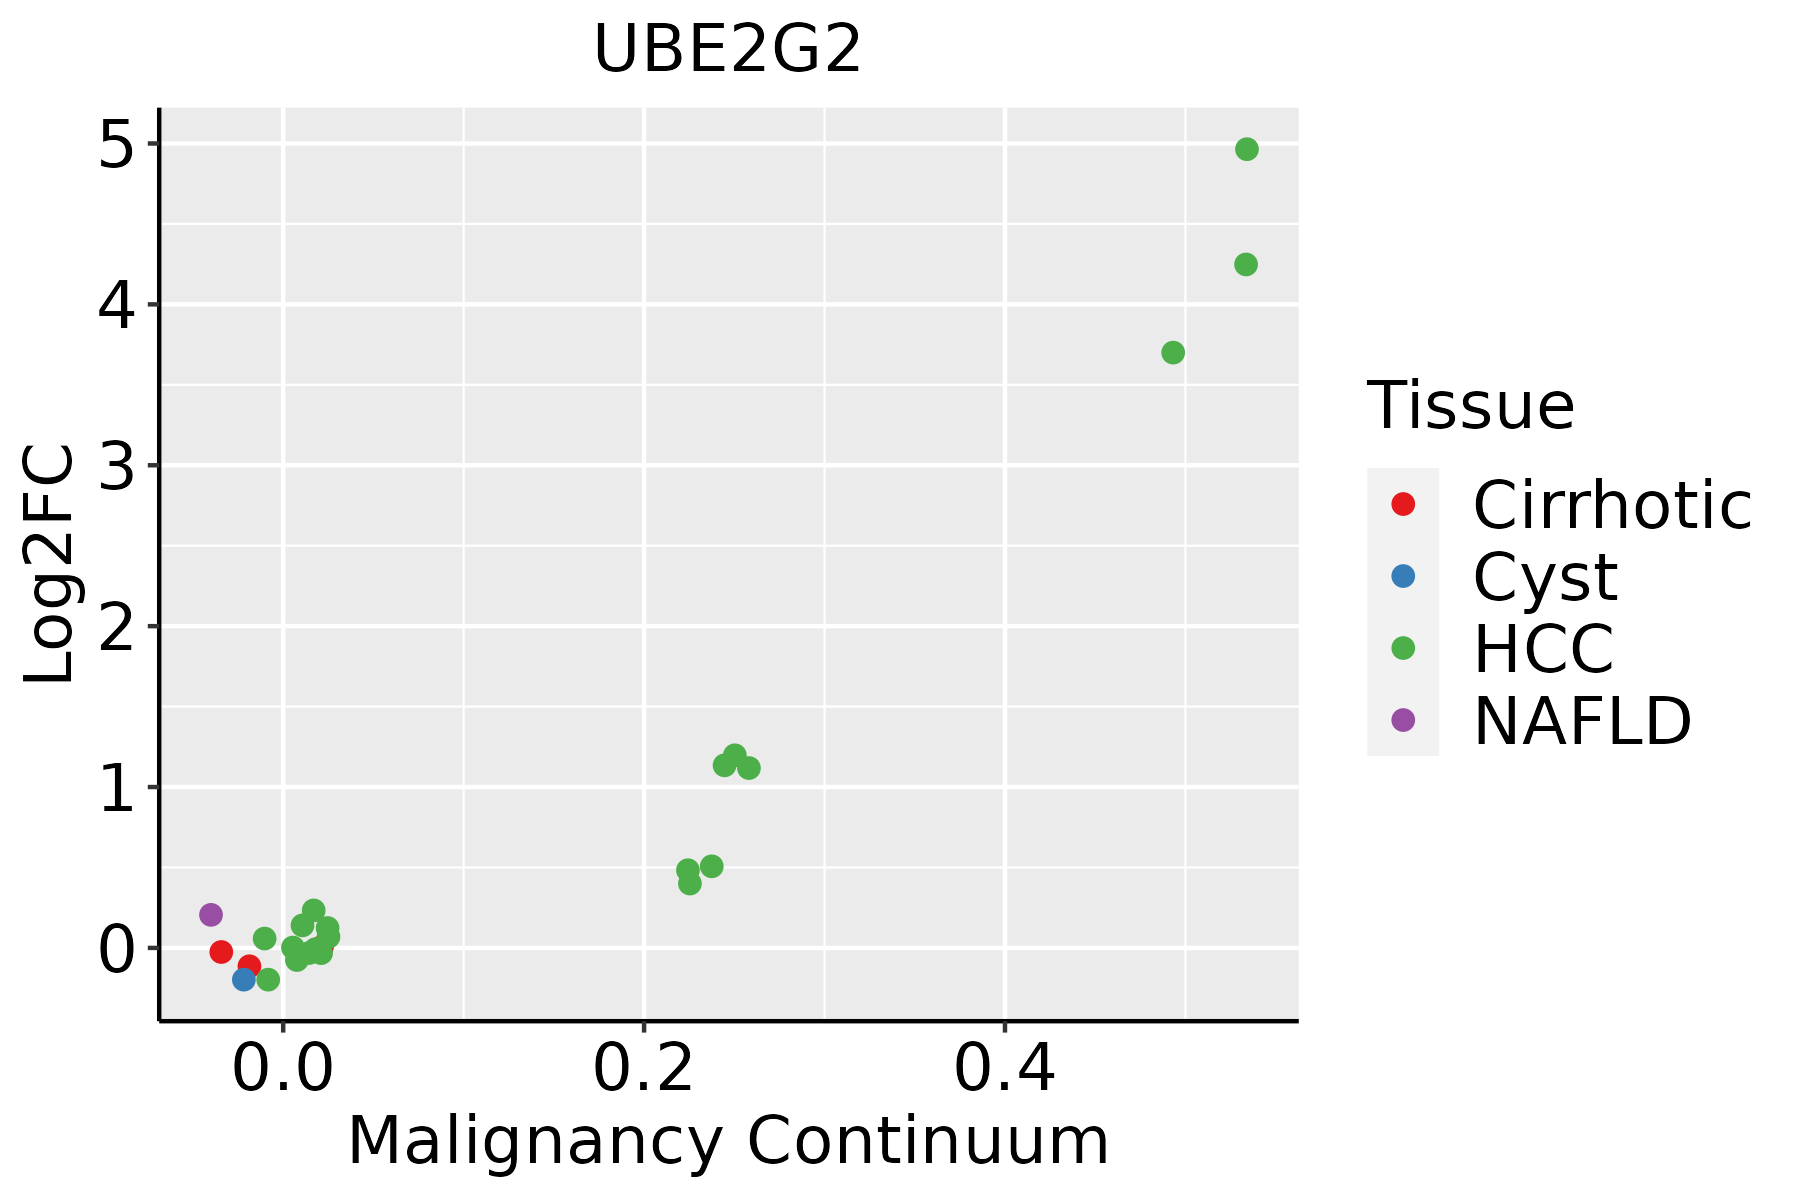 | HCC: Hepatocellular carcinoma |
| NAFLD: Non-alcoholic fatty liver disease | ||
| Oral Cavity | 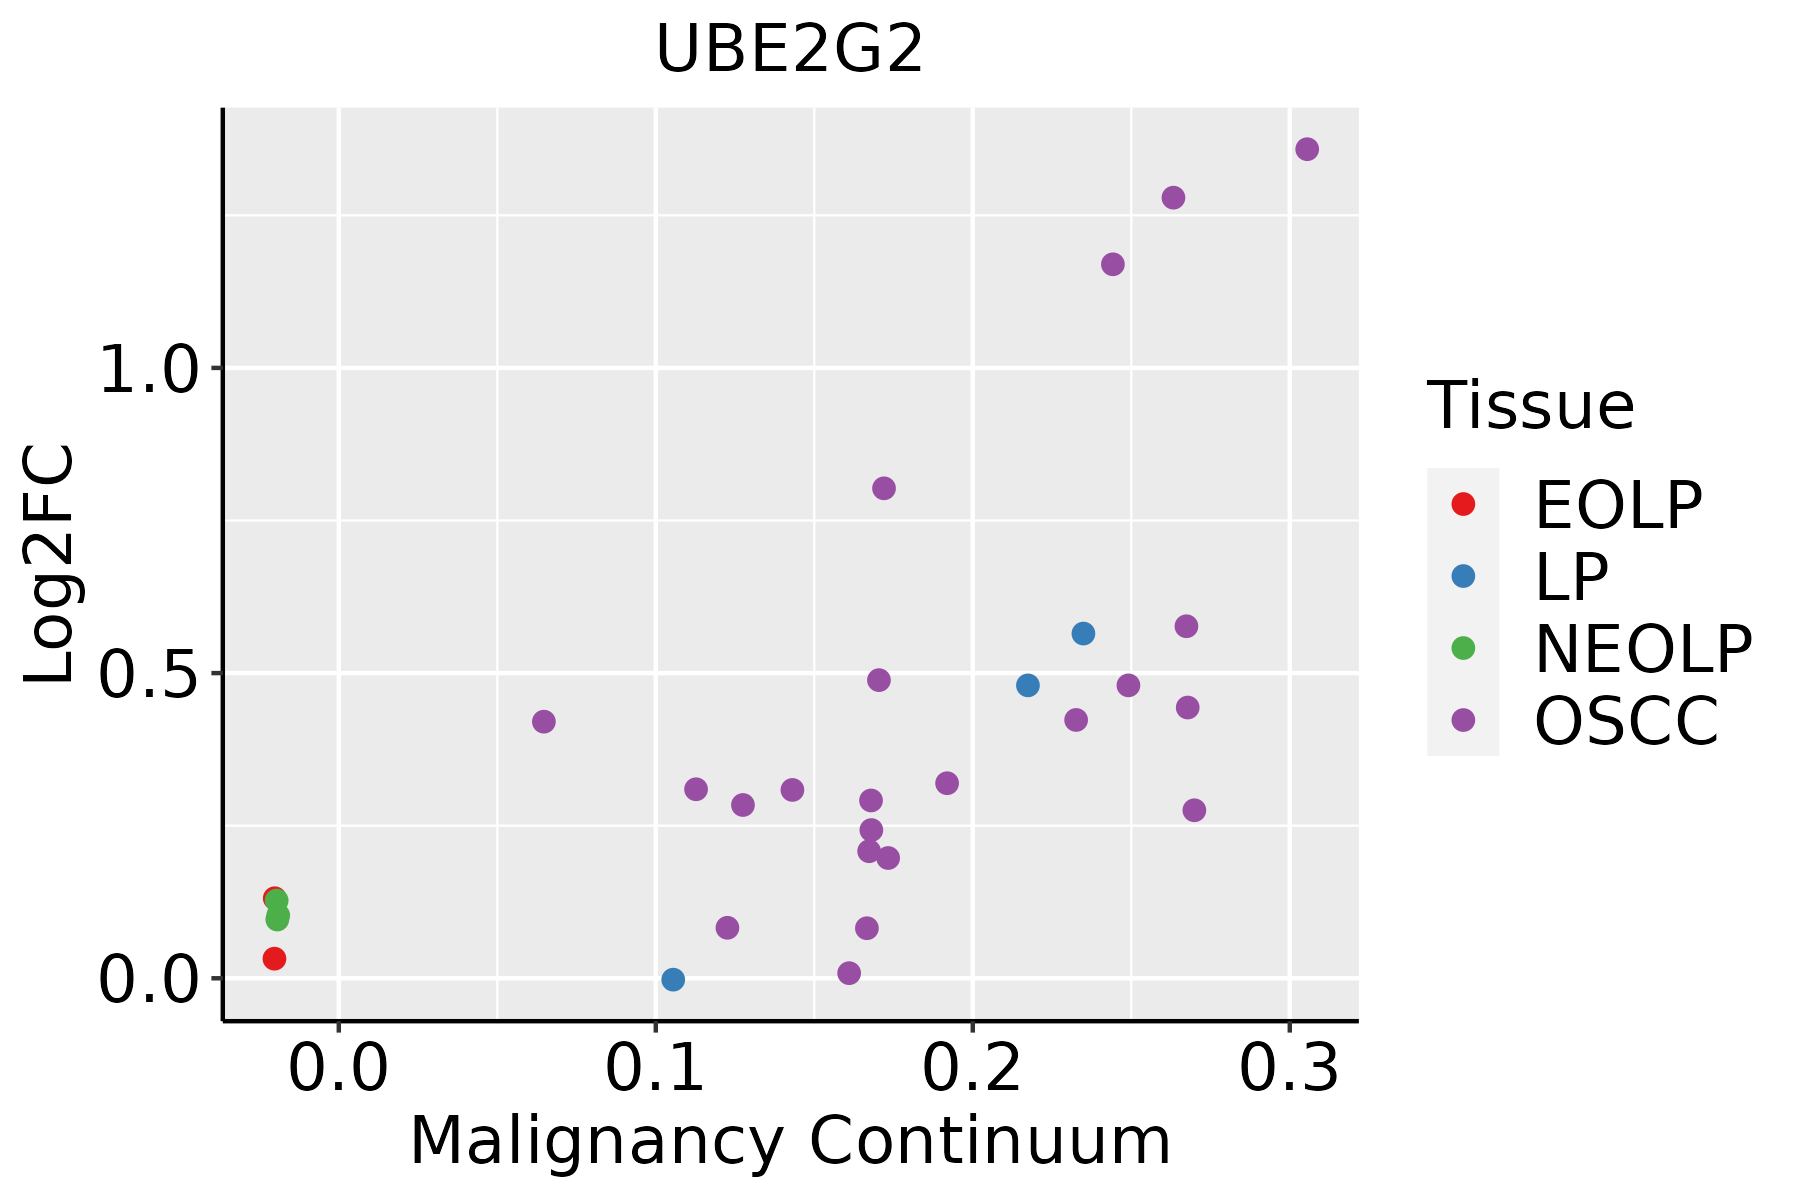 | EOLP: Erosive Oral lichen planus |
| LP: leukoplakia | ||
| NEOLP: Non-erosive oral lichen planus | ||
| OSCC: Oral squamous cell carcinoma | ||
| Prostate | 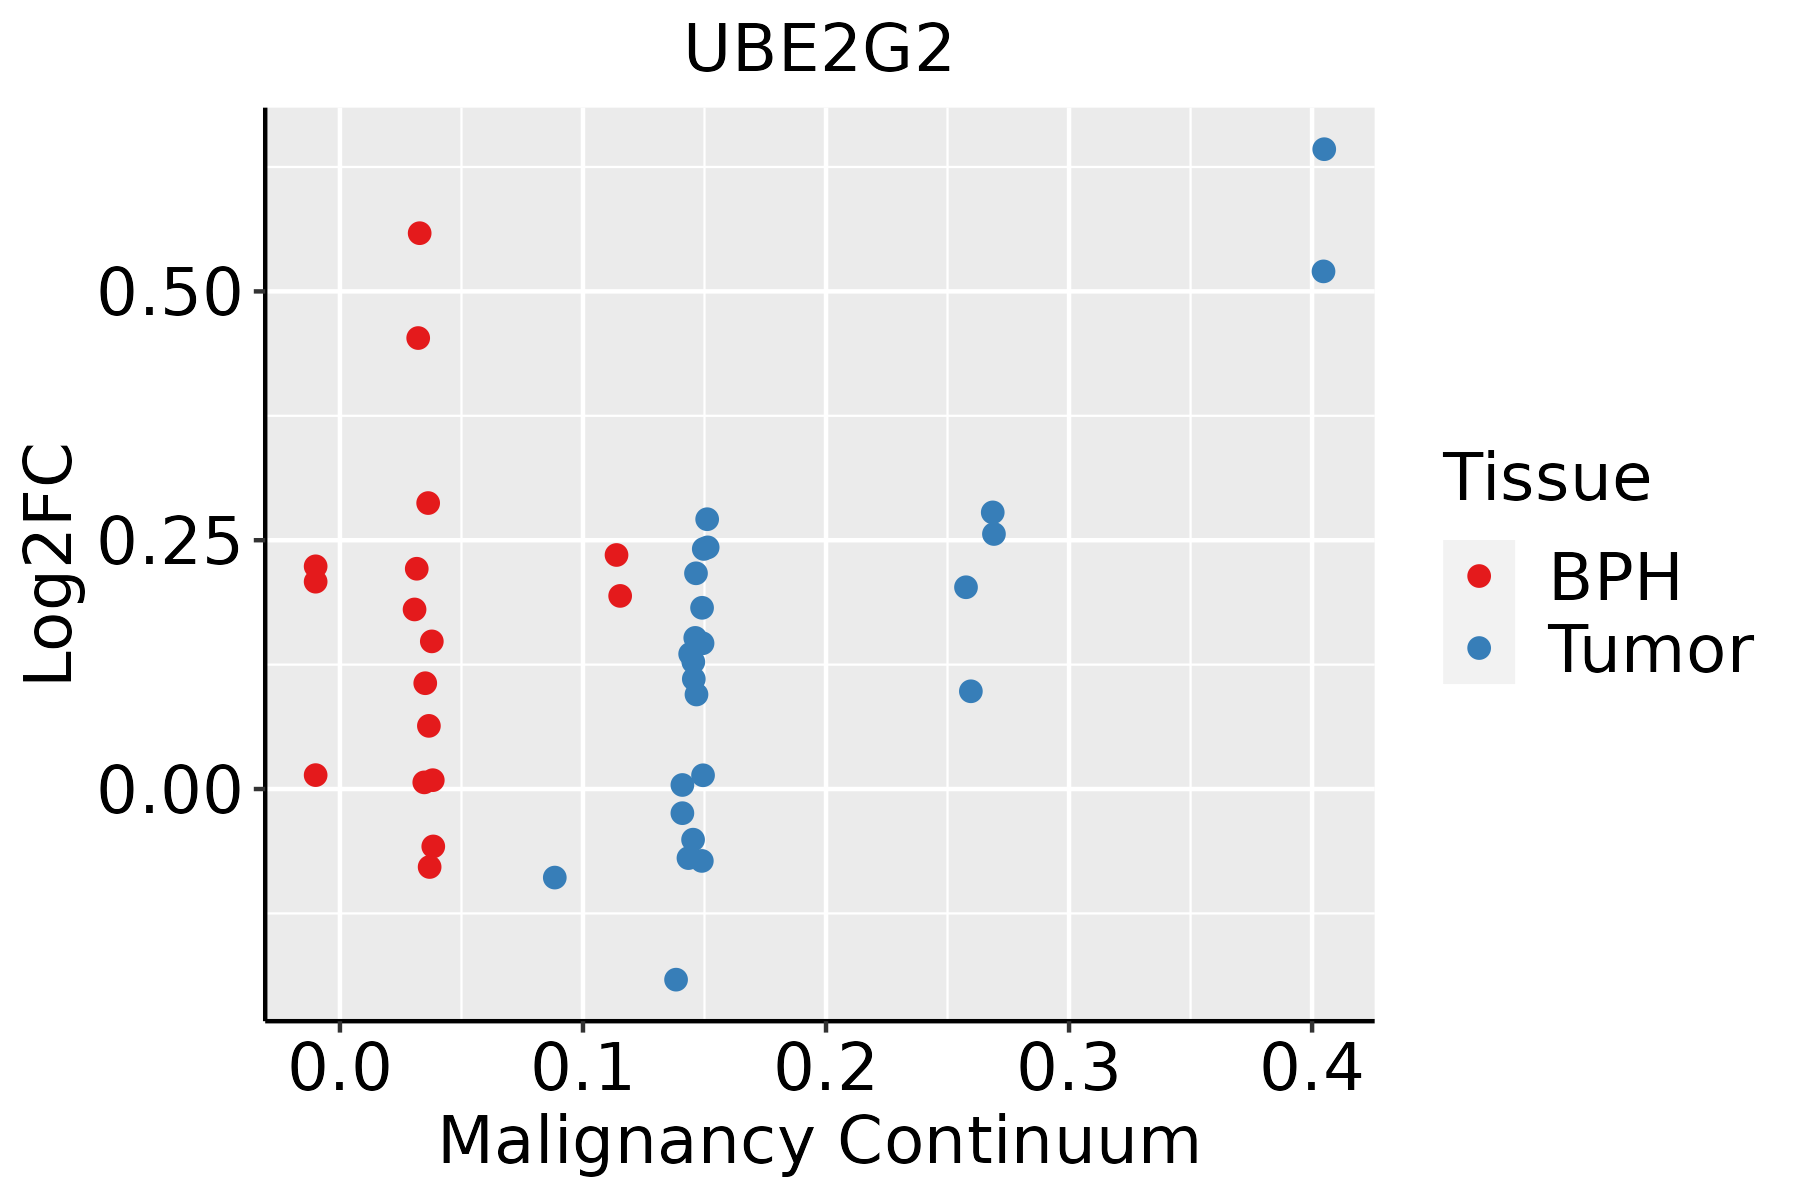 | BPH: Benign Prostatic Hyperplasia |
| Skin | 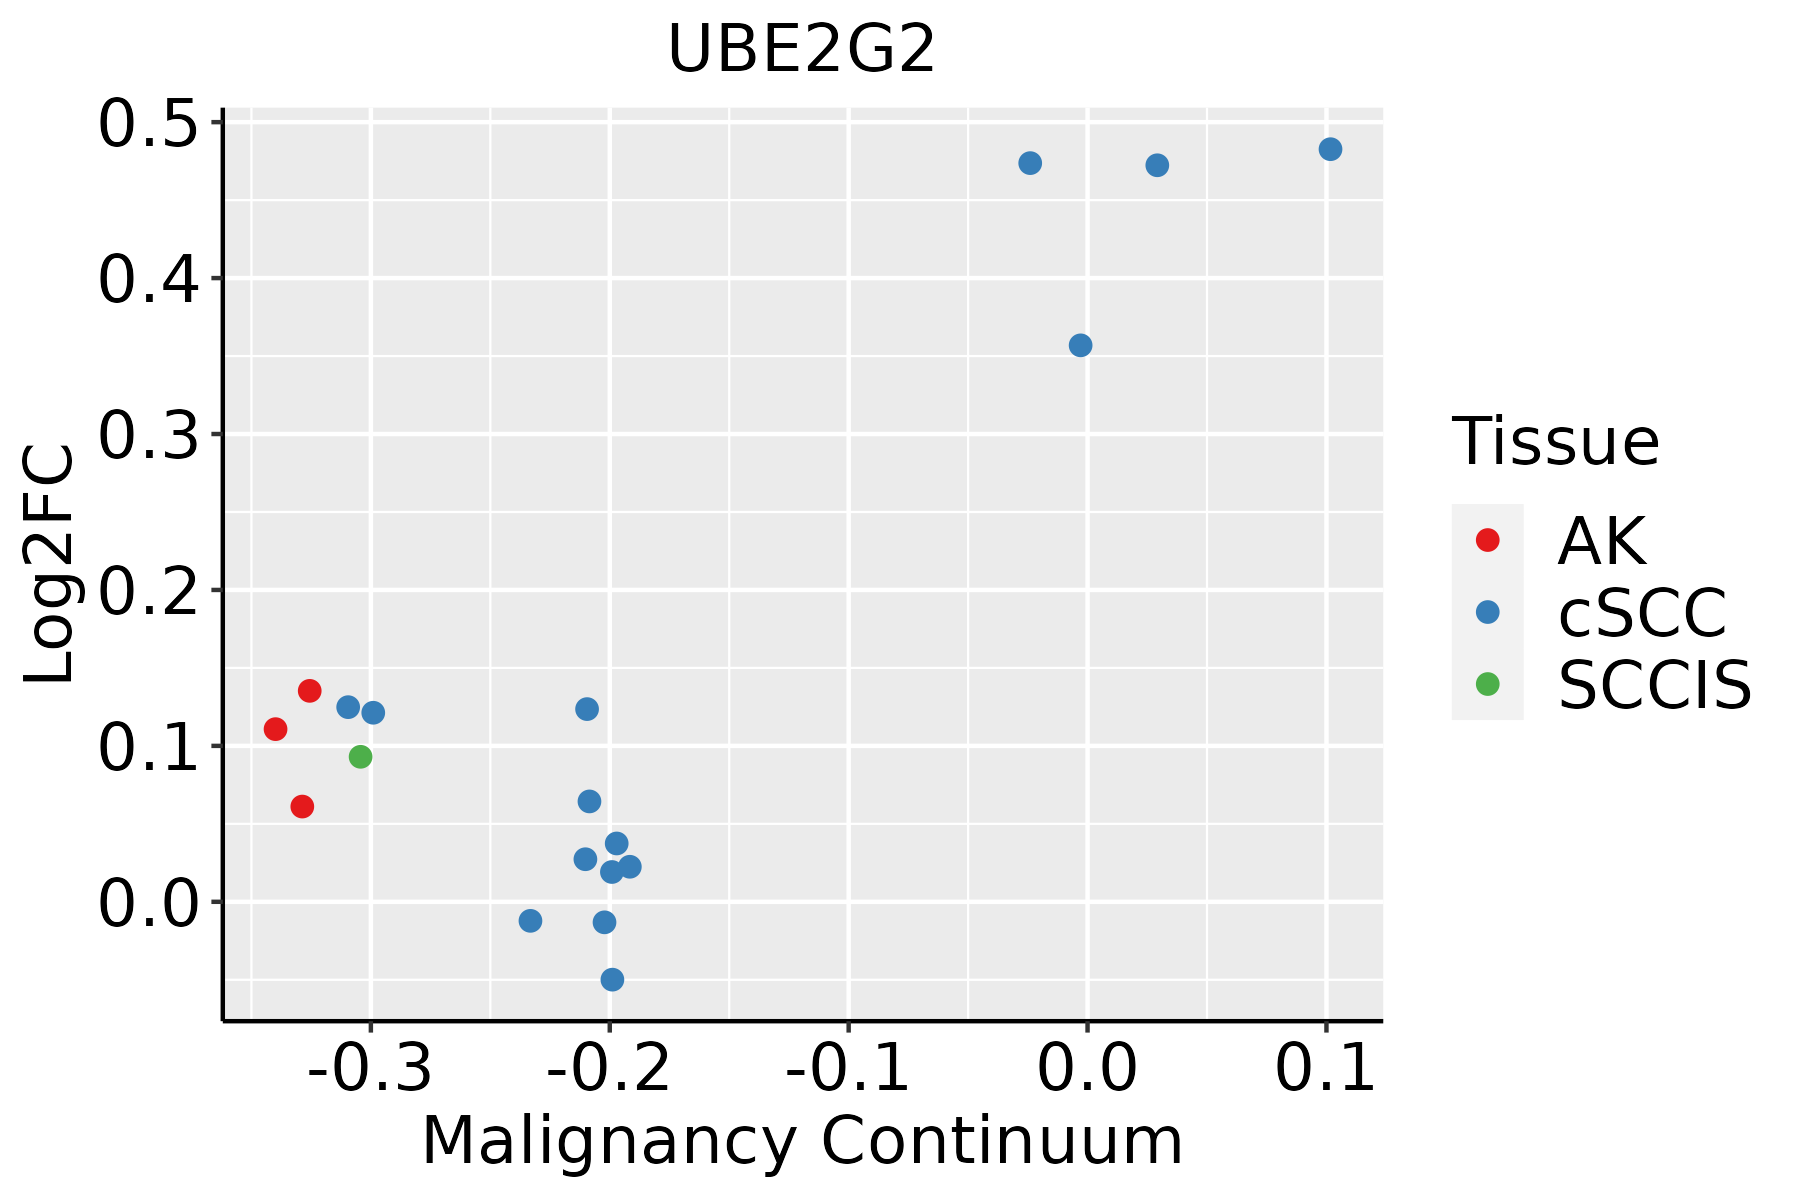 | AK: Actinic keratosis |
| cSCC: Cutaneous squamous cell carcinoma | ||
| SCCIS:squamous cell carcinoma in situ | ||
| Thyroid | 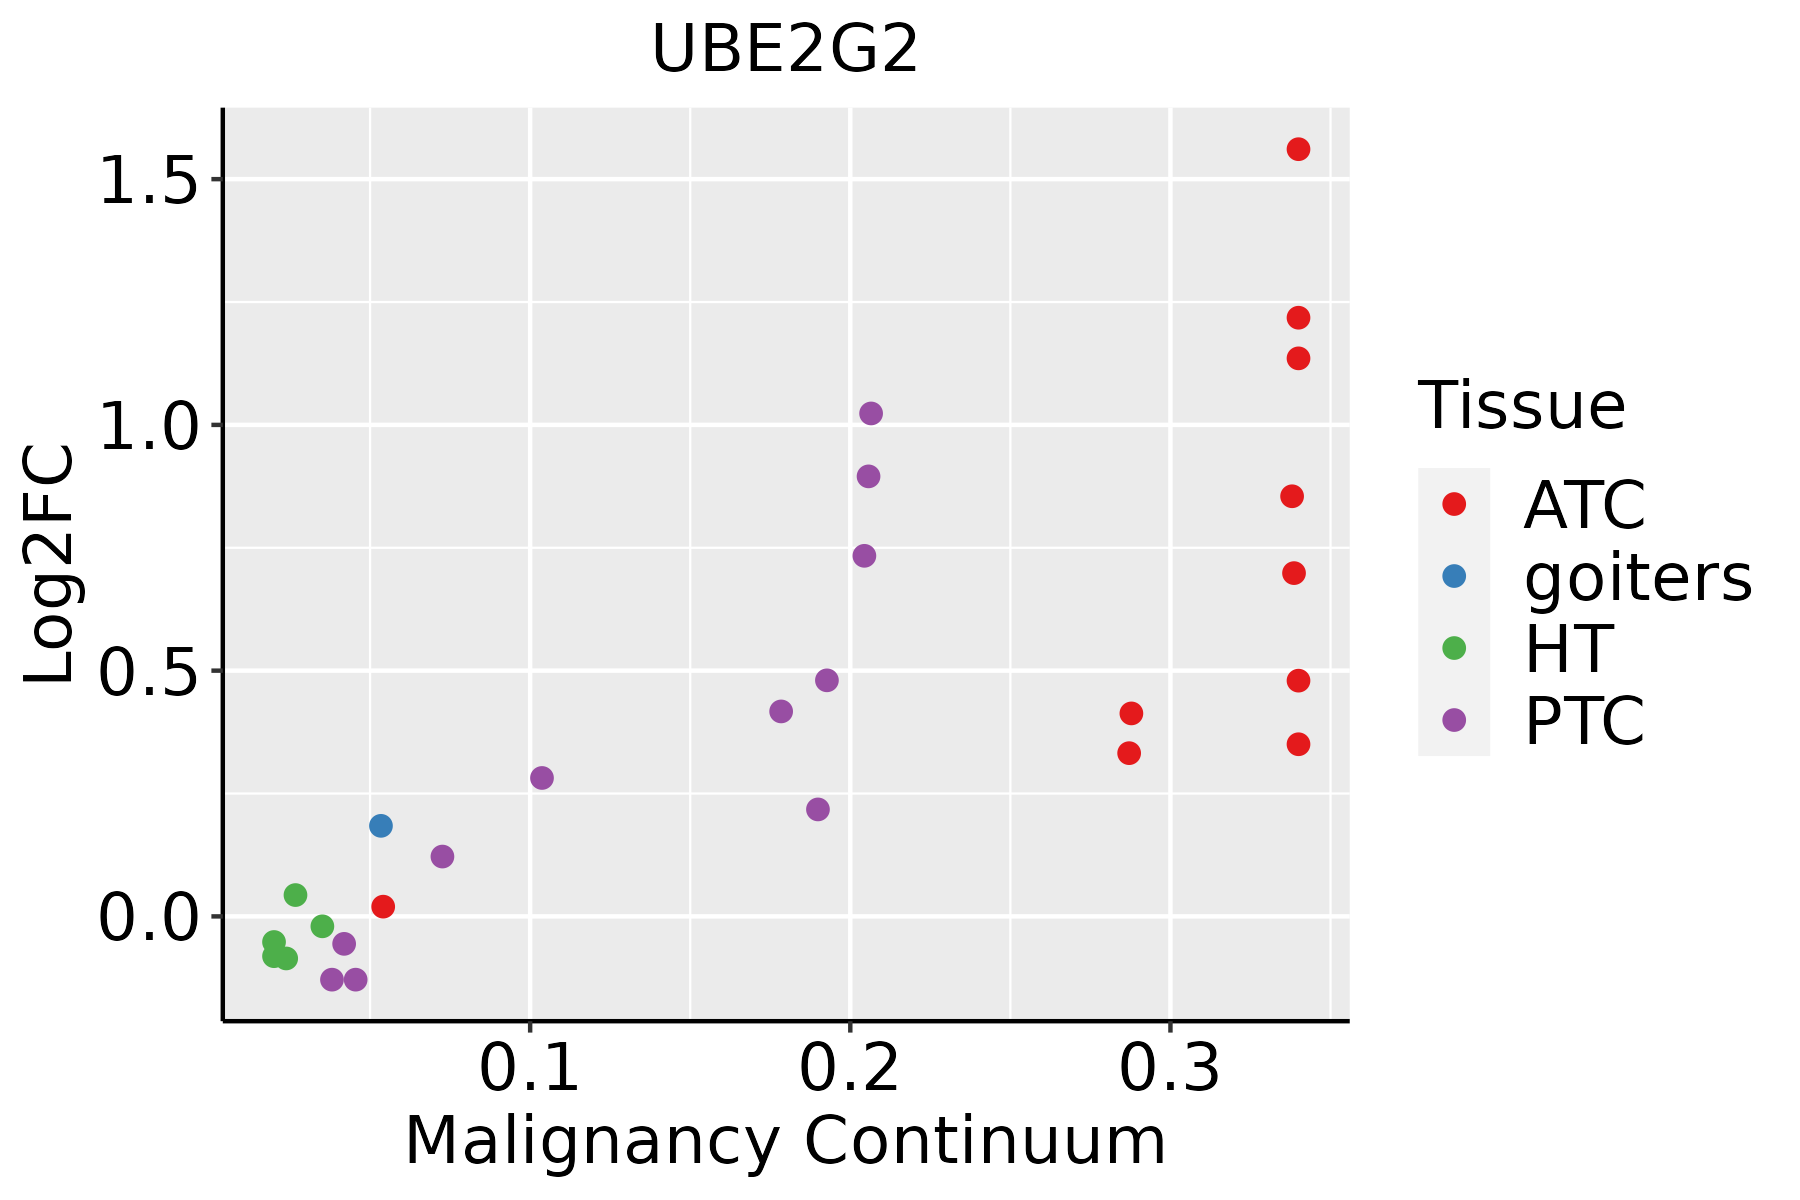 | ATC: Anaplastic thyroid cancer |
| HT: Hashimoto's thyroiditis | ||
| PTC: Papillary thyroid cancer |
| ∗log2FC in expression of this searched gene in stem-like cells from each diseased tissue sample relative to stem-like cells in normal samples in each tissue plotted against the malignancy continuum. Samples are colored based on if they are from different disease stage. |
Top |
Malignant transformation related pathway analysis |
| Find out the enriched GO biological processes and KEGG pathways involved in transition from healthy to precancer to cancer |
| Tissue | Disease Stage | Enriched GO biological Processes |
| Colorectum | AD |  |
| Colorectum | SER |  |
| Colorectum | MSS |  |
| Colorectum | MSI-H |  |
| Colorectum | FAP |  |
| ∗Top 15 enriched GO BP terms are showed in the bar plot of each disease state in each tissue. Each row represents a significant GO biological process which is colored according to the -log10(p.adjust). |
| Page: 1 2 3 4 5 6 7 8 9 |
| GO ID | Tissue | Disease Stage | Description | Gene Ratio | Bg Ratio | pvalue | p.adjust | Count |
| GO:00349767 | Liver | Cirrhotic | response to endoplasmic reticulum stress | 130/4634 | 256/18723 | 1.72e-19 | 3.86e-17 | 130 |
| GO:004316112 | Liver | Cirrhotic | proteasome-mediated ubiquitin-dependent protein catabolic process | 184/4634 | 412/18723 | 4.52e-19 | 8.85e-17 | 184 |
| GO:003238611 | Liver | Cirrhotic | regulation of intracellular transport | 147/4634 | 337/18723 | 1.84e-14 | 1.72e-12 | 147 |
| GO:003315711 | Liver | Cirrhotic | regulation of intracellular protein transport | 108/4634 | 229/18723 | 1.23e-13 | 1.04e-11 | 108 |
| GO:0030433 | Liver | Cirrhotic | ubiquitin-dependent ERAD pathway | 45/4634 | 85/18723 | 2.19e-08 | 7.75e-07 | 45 |
| GO:00365032 | Liver | Cirrhotic | ERAD pathway | 53/4634 | 107/18723 | 2.58e-08 | 8.89e-07 | 53 |
| GO:007093611 | Liver | Cirrhotic | protein K48-linked ubiquitination | 36/4634 | 65/18723 | 1.23e-07 | 3.41e-06 | 36 |
| GO:00325271 | Liver | Cirrhotic | protein exit from endoplasmic reticulum | 29/4634 | 48/18723 | 1.63e-07 | 4.30e-06 | 29 |
| GO:00309702 | Liver | Cirrhotic | retrograde protein transport, ER to cytosol | 19/4634 | 29/18723 | 4.10e-06 | 6.90e-05 | 19 |
| GO:19035132 | Liver | Cirrhotic | endoplasmic reticulum to cytosol transport | 19/4634 | 29/18723 | 4.10e-06 | 6.90e-05 | 19 |
| GO:000020911 | Liver | Cirrhotic | protein polyubiquitination | 89/4634 | 236/18723 | 6.09e-06 | 9.80e-05 | 89 |
| GO:00708611 | Liver | Cirrhotic | regulation of protein exit from endoplasmic reticulum | 17/4634 | 27/18723 | 2.89e-05 | 3.65e-04 | 17 |
| GO:19038285 | Liver | Cirrhotic | negative regulation of cellular protein localization | 48/4634 | 117/18723 | 7.59e-05 | 8.41e-04 | 48 |
| GO:0070862 | Liver | Cirrhotic | negative regulation of protein exit from endoplasmic reticulum | 8/4634 | 10/18723 | 3.84e-04 | 3.19e-03 | 8 |
| GO:19049502 | Liver | Cirrhotic | negative regulation of establishment of protein localization | 49/4634 | 131/18723 | 8.50e-04 | 6.15e-03 | 49 |
| GO:0090317 | Liver | Cirrhotic | negative regulation of intracellular protein transport | 20/4634 | 42/18723 | 1.08e-03 | 7.54e-03 | 20 |
| GO:0051224 | Liver | Cirrhotic | negative regulation of protein transport | 47/4634 | 127/18723 | 1.39e-03 | 9.27e-03 | 47 |
| GO:0032387 | Liver | Cirrhotic | negative regulation of intracellular transport | 25/4634 | 58/18723 | 1.66e-03 | 1.07e-02 | 25 |
| GO:1904152 | Liver | Cirrhotic | regulation of retrograde protein transport, ER to cytosol | 9/4634 | 14/18723 | 1.99e-03 | 1.23e-02 | 9 |
| GO:00510514 | Liver | Cirrhotic | negative regulation of transport | 141/4634 | 470/18723 | 5.06e-03 | 2.62e-02 | 141 |
| Page: 1 2 3 4 5 6 7 8 9 10 11 |
| Pathway ID | Tissue | Disease Stage | Description | Gene Ratio | Bg Ratio | pvalue | p.adjust | qvalue | Count |
| hsa04141211 | Esophagus | ESCC | Protein processing in endoplasmic reticulum | 147/4205 | 174/8465 | 3.29e-22 | 1.10e-19 | 5.64e-20 | 147 |
| hsa0412027 | Esophagus | ESCC | Ubiquitin mediated proteolysis | 122/4205 | 142/8465 | 6.53e-20 | 7.29e-18 | 3.74e-18 | 122 |
| hsa05012211 | Esophagus | ESCC | Parkinson disease | 201/4205 | 266/8465 | 1.56e-18 | 8.72e-17 | 4.46e-17 | 201 |
| hsa05022210 | Esophagus | ESCC | Pathways of neurodegeneration - multiple diseases | 318/4205 | 476/8465 | 6.10e-15 | 2.04e-13 | 1.05e-13 | 318 |
| hsa04141310 | Esophagus | ESCC | Protein processing in endoplasmic reticulum | 147/4205 | 174/8465 | 3.29e-22 | 1.10e-19 | 5.64e-20 | 147 |
| hsa0412036 | Esophagus | ESCC | Ubiquitin mediated proteolysis | 122/4205 | 142/8465 | 6.53e-20 | 7.29e-18 | 3.74e-18 | 122 |
| hsa05012310 | Esophagus | ESCC | Parkinson disease | 201/4205 | 266/8465 | 1.56e-18 | 8.72e-17 | 4.46e-17 | 201 |
| hsa0502238 | Esophagus | ESCC | Pathways of neurodegeneration - multiple diseases | 318/4205 | 476/8465 | 6.10e-15 | 2.04e-13 | 1.05e-13 | 318 |
| hsa0412021 | Liver | Cirrhotic | Ubiquitin mediated proteolysis | 72/2530 | 142/8465 | 1.32e-07 | 1.97e-06 | 1.21e-06 | 72 |
| hsa0412031 | Liver | Cirrhotic | Ubiquitin mediated proteolysis | 72/2530 | 142/8465 | 1.32e-07 | 1.97e-06 | 1.21e-06 | 72 |
| hsa0414122 | Liver | HCC | Protein processing in endoplasmic reticulum | 146/4020 | 174/8465 | 7.34e-24 | 2.46e-21 | 1.37e-21 | 146 |
| hsa0501222 | Liver | HCC | Parkinson disease | 198/4020 | 266/8465 | 9.40e-20 | 1.58e-17 | 8.76e-18 | 198 |
| hsa0412041 | Liver | HCC | Ubiquitin mediated proteolysis | 110/4020 | 142/8465 | 1.67e-13 | 3.74e-12 | 2.08e-12 | 110 |
| hsa0502222 | Liver | HCC | Pathways of neurodegeneration - multiple diseases | 298/4020 | 476/8465 | 6.59e-12 | 1.30e-10 | 7.22e-11 | 298 |
| hsa0414132 | Liver | HCC | Protein processing in endoplasmic reticulum | 146/4020 | 174/8465 | 7.34e-24 | 2.46e-21 | 1.37e-21 | 146 |
| hsa0501232 | Liver | HCC | Parkinson disease | 198/4020 | 266/8465 | 9.40e-20 | 1.58e-17 | 8.76e-18 | 198 |
| hsa0412051 | Liver | HCC | Ubiquitin mediated proteolysis | 110/4020 | 142/8465 | 1.67e-13 | 3.74e-12 | 2.08e-12 | 110 |
| hsa0502232 | Liver | HCC | Pathways of neurodegeneration - multiple diseases | 298/4020 | 476/8465 | 6.59e-12 | 1.30e-10 | 7.22e-11 | 298 |
| hsa0414130 | Oral cavity | OSCC | Protein processing in endoplasmic reticulum | 143/3704 | 174/8465 | 6.82e-26 | 2.28e-23 | 1.16e-23 | 143 |
| hsa0501230 | Oral cavity | OSCC | Parkinson disease | 188/3704 | 266/8465 | 1.82e-19 | 1.52e-17 | 7.75e-18 | 188 |
| Page: 1 2 3 |
Top |
Cell-cell communication analysis |
| Identification of potential cell-cell interactions between two cell types and their ligand-receptor pairs for different disease states |
| Ligand | Receptor | LRpair | Pathway | Tissue | Disease Stage |
| Page: 1 |
Top |
Single-cell gene regulatory network inference analysis |
| Find out the significant the regulons (TFs) and the target genes of each regulon across cell types for different disease states |
| TF | Cell Type | Tissue | Disease Stage | Target Gene | RSS | Regulon Activity |
| ∗The dot plots of a searched regulon are shown for all cell subpopulations in each disease state of each tissue based on the regulon specific score inferred using pySCENIC and by calculating the average expression. |
| Page: 1 |
Top |
Somatic mutation of malignant transformation related genes |
| Annotation of somatic variants for genes involved in malignant transformation |
| Hugo Symbol | Variant Class | Variant Classification | dbSNP RS | HGVSc | HGVSp | HGVSp Short | SWISSPROT | BIOTYPE | SIFT | PolyPhen | Tumor Sample Barcode | Tissue | Histology | Sex | Age | Stage | Therapy Types | Drugs | Outcome |
| UBE2G2 | SNV | Missense_Mutation | novel | c.235N>T | p.His79Tyr | p.H79Y | P60604 | protein_coding | deleterious(0) | probably_damaging(1) | TCGA-D8-A73U-01 | Breast | breast invasive carcinoma | Female | >=65 | I/II | Hormone Therapy | tamoxiphen | SD |
| UBE2G2 | SNV | Missense_Mutation | rs782636745 | c.434N>A | p.Arg145His | p.R145H | P60604 | protein_coding | deleterious(0) | probably_damaging(0.98) | TCGA-EA-A410-01 | Cervix | cervical & endocervical cancer | Female | <65 | I/II | Unknown | Unknown | SD |
| UBE2G2 | SNV | Missense_Mutation | rs782079899 | c.62N>T | p.Pro21Leu | p.P21L | P60604 | protein_coding | tolerated(0.3) | possibly_damaging(0.742) | TCGA-D5-6530-01 | Colorectum | colon adenocarcinoma | Male | <65 | I/II | Unknown | Unknown | SD |
| UBE2G2 | SNV | Missense_Mutation | c.236N>G | p.His79Arg | p.H79R | P60604 | protein_coding | deleterious(0) | probably_damaging(1) | TCGA-G4-6322-01 | Colorectum | colon adenocarcinoma | Male | >=65 | III/IV | Chemotherapy | oxaliplatin | PD | |
| UBE2G2 | SNV | Missense_Mutation | novel | c.412G>A | p.Val138Met | p.V138M | P60604 | protein_coding | deleterious(0) | probably_damaging(0.945) | TCGA-AP-A1DK-01 | Endometrium | uterine corpus endometrioid carcinoma | Female | <65 | I/II | Unknown | Unknown | SD |
| UBE2G2 | SNV | Missense_Mutation | novel | c.260N>T | p.Arg87Ile | p.R87I | P60604 | protein_coding | deleterious(0.04) | benign(0.136) | TCGA-AX-A05Z-01 | Endometrium | uterine corpus endometrioid carcinoma | Female | <65 | III/IV | Chemotherapy | adriamycin | SD |
| UBE2G2 | SNV | Missense_Mutation | novel | c.436N>A | p.Asp146Asn | p.D146N | P60604 | protein_coding | tolerated(0.13) | benign(0.003) | TCGA-B5-A1MR-01 | Endometrium | uterine corpus endometrioid carcinoma | Female | >=65 | III/IV | Unknown | Unknown | SD |
| UBE2G2 | SNV | Missense_Mutation | novel | c.128N>A | p.Gly43Asp | p.G43D | P60604 | protein_coding | deleterious(0) | probably_damaging(1) | TCGA-B5-A1MX-01 | Endometrium | uterine corpus endometrioid carcinoma | Female | <65 | I/II | Hormone Therapy | megace | SD |
| UBE2G2 | SNV | Missense_Mutation | novel | c.365N>G | p.Ser122Trp | p.S122W | P60604 | protein_coding | deleterious(0) | probably_damaging(1) | TCGA-BG-A3EW-01 | Endometrium | uterine corpus endometrioid carcinoma | Female | <65 | III/IV | Unknown | Unknown | SD |
| UBE2G2 | SNV | Missense_Mutation | novel | c.494N>C | p.Leu165Pro | p.L165P | P60604 | protein_coding | deleterious(0) | probably_damaging(0.939) | TCGA-D1-A175-01 | Endometrium | uterine corpus endometrioid carcinoma | Female | <65 | I/II | Chemotherapy | paclitaxel | SD |
| Page: 1 2 |
Top |
Related drugs of malignant transformation related genes |
| Identification of chemicals and drugs interact with genes involved in malignant transfromation |
| (DGIdb 4.0) |
| Entrez ID | Symbol | Category | Interaction Types | Drug Claim Name | Drug Name | PMIDs |
| Page: 1 |

Copyright 2023-Present -The University of Texas Health Science Center at Houston |