
|
|||||
|
 | |
| |
| |
| |
| |
| |
|
Gene: UBAC2 |
Gene summary for UBAC2 |
| Gene information | Species | Human | Gene symbol | UBAC2 | Gene ID | 337867 |
| Gene name | UBA domain containing 2 | |
| Gene Alias | PHGDHL1 | |
| Cytomap | 13q32.3 | |
| Gene Type | protein-coding | GO ID | GO:0006508 | UniProtAcc | A0A024RE02 |
Top |
Malignant transformation analysis |
| Identification of the aberrant gene expression in precancerous and cancerous lesions by comparing the gene expression of stem-like cells in diseased tissues with normal stem cells |
| Entrez ID | Symbol | Replicates | Species | Organ | Tissue | Adj P-value | Log2FC | Malignancy |
| 337867 | UBAC2 | CCI_1 | Human | Cervix | CC | 4.37e-03 | 7.45e-01 | 0.528 |
| 337867 | UBAC2 | CCI_2 | Human | Cervix | CC | 1.36e-10 | 1.06e+00 | 0.5249 |
| 337867 | UBAC2 | CCI_3 | Human | Cervix | CC | 7.39e-12 | 9.27e-01 | 0.516 |
| 337867 | UBAC2 | HTA11_3410_2000001011 | Human | Colorectum | AD | 5.14e-25 | -6.82e-01 | 0.0155 |
| 337867 | UBAC2 | HTA11_3361_2000001011 | Human | Colorectum | AD | 2.18e-04 | -5.13e-01 | -0.1207 |
| 337867 | UBAC2 | HTA11_83_2000001011 | Human | Colorectum | SER | 2.53e-04 | -3.61e-01 | -0.1526 |
| 337867 | UBAC2 | HTA11_7862_2000001011 | Human | Colorectum | AD | 1.13e-02 | -4.85e-01 | -0.0179 |
| 337867 | UBAC2 | HTA11_866_3004761011 | Human | Colorectum | AD | 5.12e-05 | -4.29e-01 | 0.096 |
| 337867 | UBAC2 | HTA11_8622_2000001021 | Human | Colorectum | SER | 3.75e-05 | -4.87e-01 | 0.0528 |
| 337867 | UBAC2 | HTA11_10711_2000001011 | Human | Colorectum | AD | 7.10e-03 | -4.08e-01 | 0.0338 |
| 337867 | UBAC2 | HTA11_7696_3000711011 | Human | Colorectum | AD | 5.13e-11 | -4.40e-01 | 0.0674 |
| 337867 | UBAC2 | HTA11_99999970781_79442 | Human | Colorectum | MSS | 1.96e-11 | -4.36e-01 | 0.294 |
| 337867 | UBAC2 | HTA11_99999965104_69814 | Human | Colorectum | MSS | 1.82e-06 | 6.38e-01 | 0.281 |
| 337867 | UBAC2 | HTA11_99999974143_84620 | Human | Colorectum | MSS | 6.65e-09 | -3.88e-01 | 0.3005 |
| 337867 | UBAC2 | F007 | Human | Colorectum | FAP | 1.70e-02 | -3.10e-01 | 0.1176 |
| 337867 | UBAC2 | A001-C-207 | Human | Colorectum | FAP | 9.65e-05 | -3.23e-01 | 0.1278 |
| 337867 | UBAC2 | A015-C-203 | Human | Colorectum | FAP | 1.01e-44 | -7.77e-01 | -0.1294 |
| 337867 | UBAC2 | A015-C-204 | Human | Colorectum | FAP | 1.68e-12 | -5.07e-01 | -0.0228 |
| 337867 | UBAC2 | A014-C-040 | Human | Colorectum | FAP | 2.39e-08 | -6.89e-01 | -0.1184 |
| 337867 | UBAC2 | A002-C-201 | Human | Colorectum | FAP | 1.69e-21 | -5.67e-01 | 0.0324 |
| Page: 1 2 3 4 5 6 7 8 9 |
| Tissue | Expression Dynamics | Abbreviation |
| Cervix | 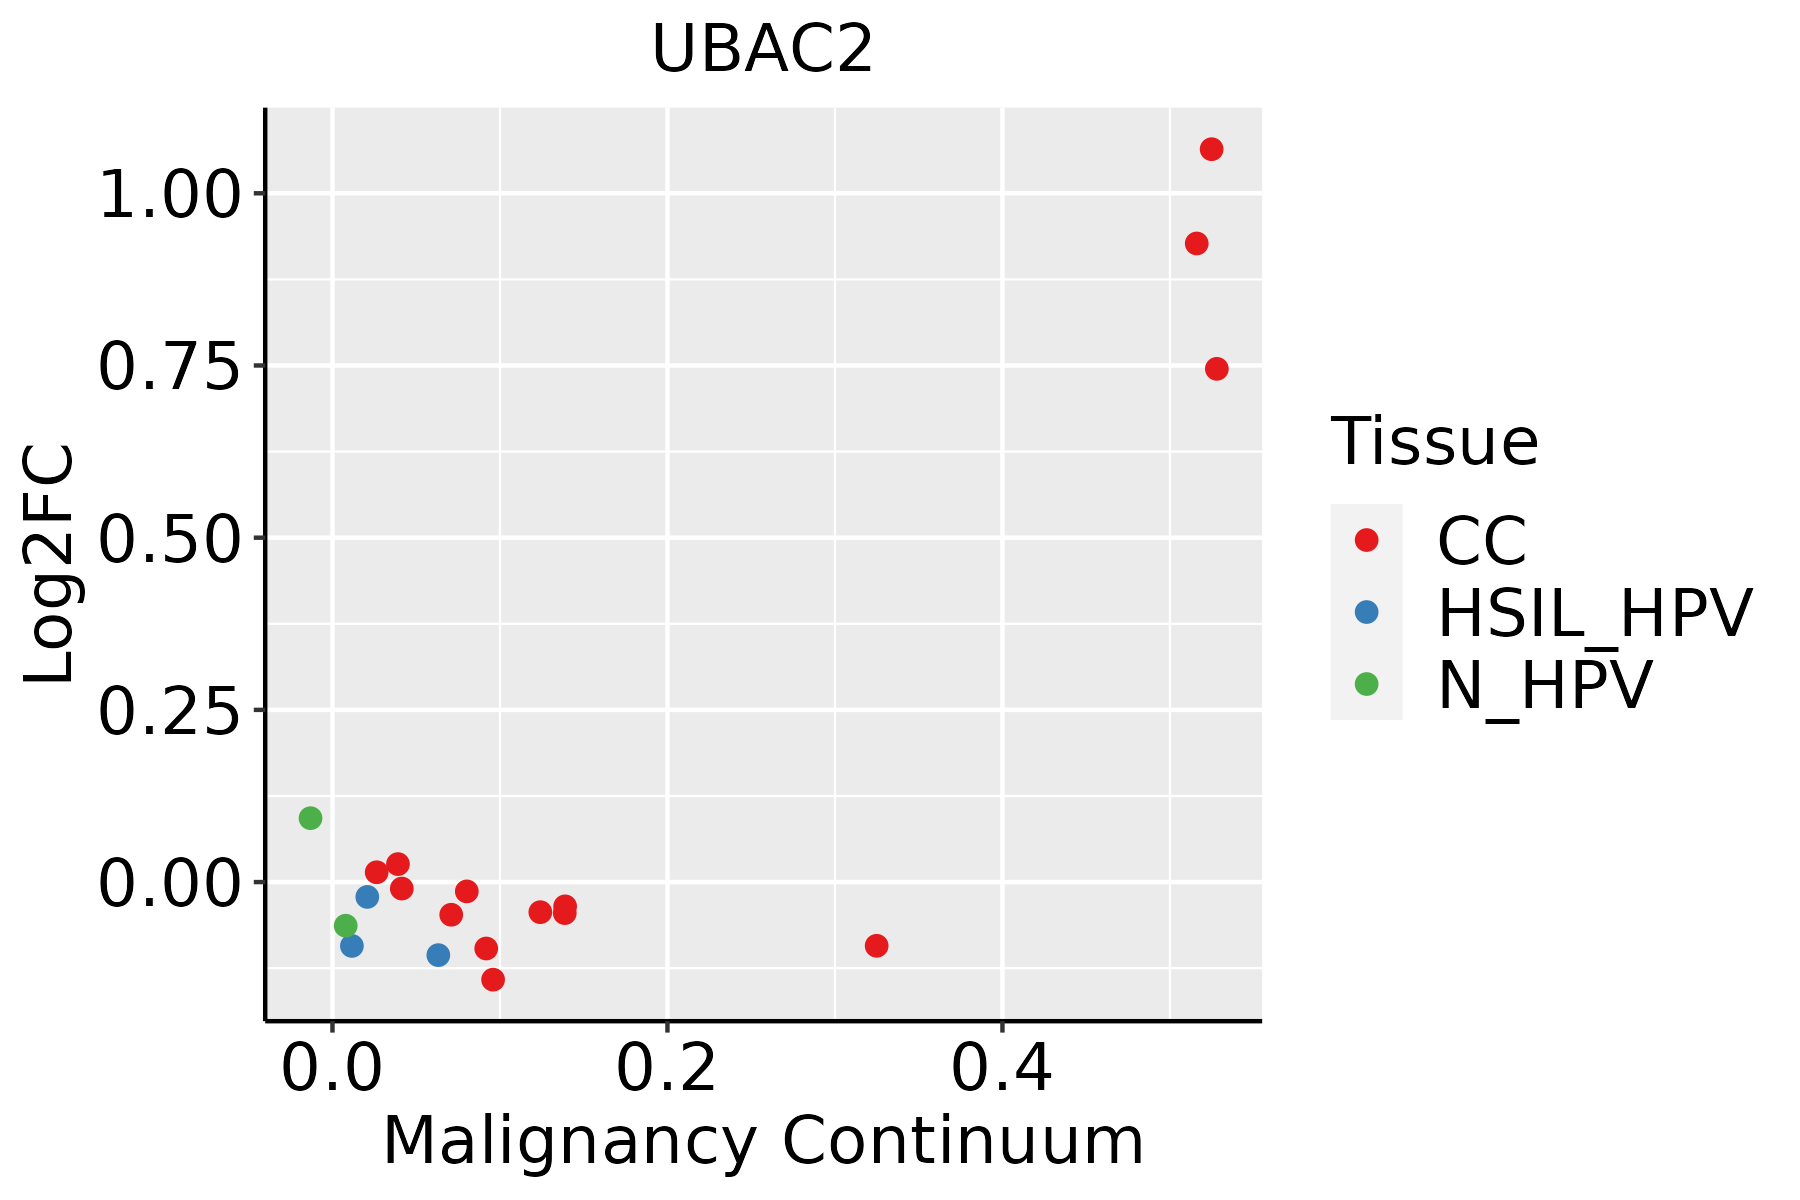 | CC: Cervix cancer |
| HSIL_HPV: HPV-infected high-grade squamous intraepithelial lesions | ||
| N_HPV: HPV-infected normal cervix | ||
| Colorectum (GSE201348) | 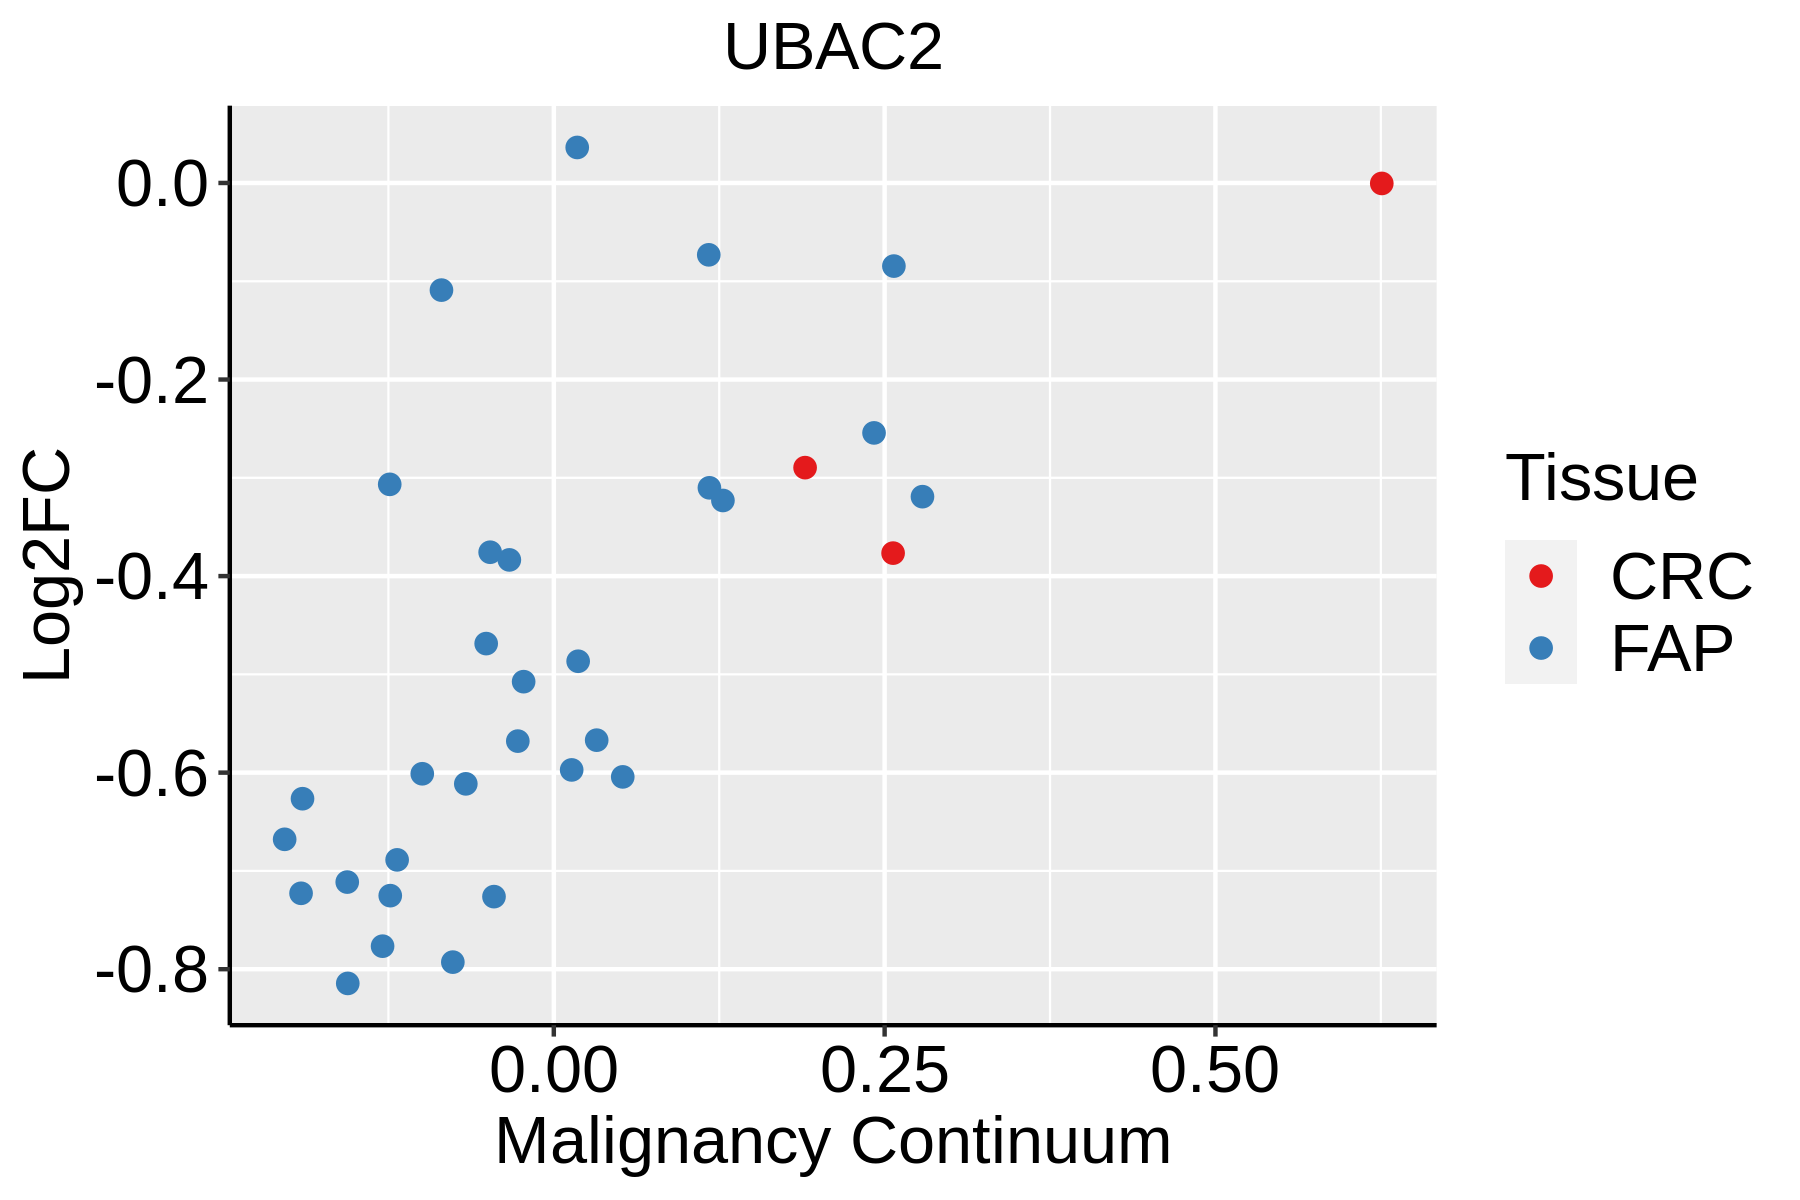 | FAP: Familial adenomatous polyposis |
| CRC: Colorectal cancer | ||
| Colorectum (HTA11) |  | AD: Adenomas |
| SER: Sessile serrated lesions | ||
| MSI-H: Microsatellite-high colorectal cancer | ||
| MSS: Microsatellite stable colorectal cancer | ||
| Esophagus | 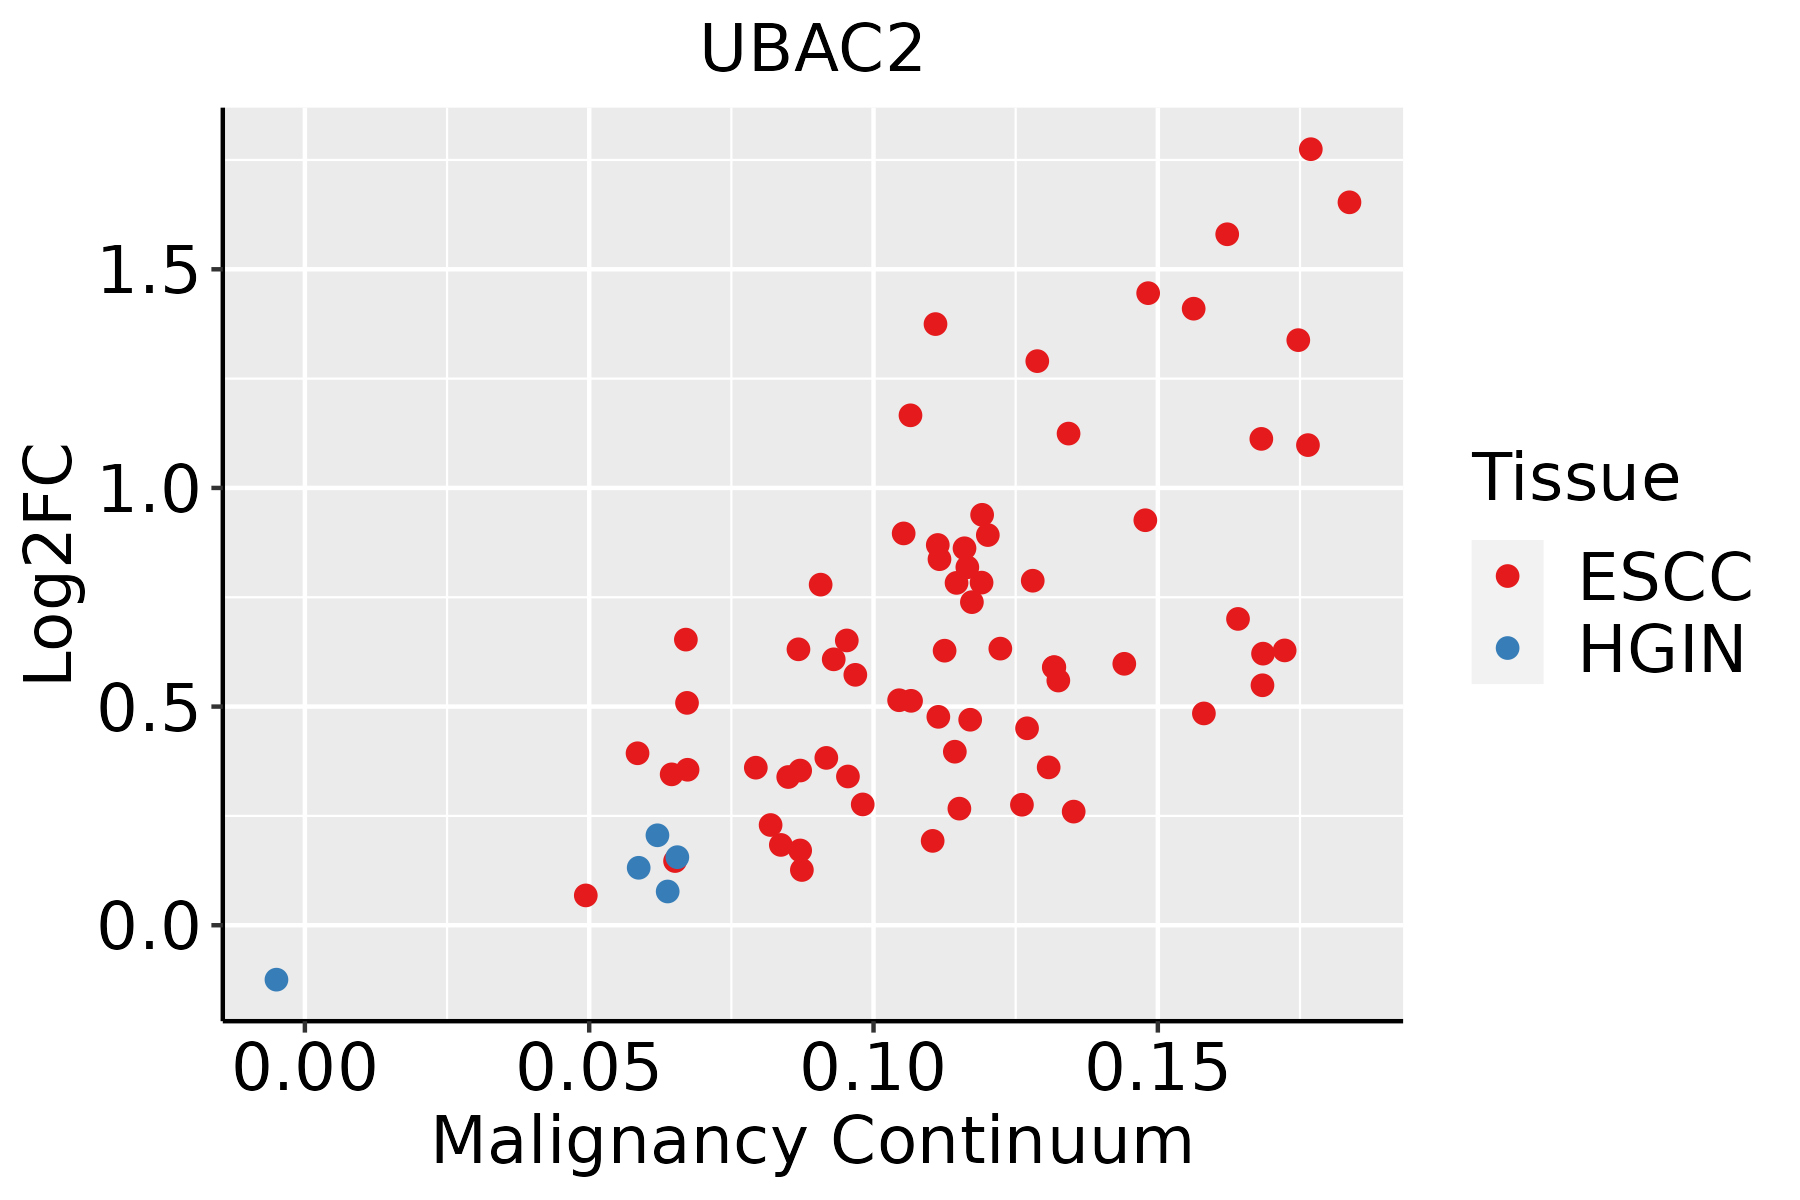 | ESCC: Esophageal squamous cell carcinoma |
| HGIN: High-grade intraepithelial neoplasias | ||
| LGIN: Low-grade intraepithelial neoplasias | ||
| Liver | 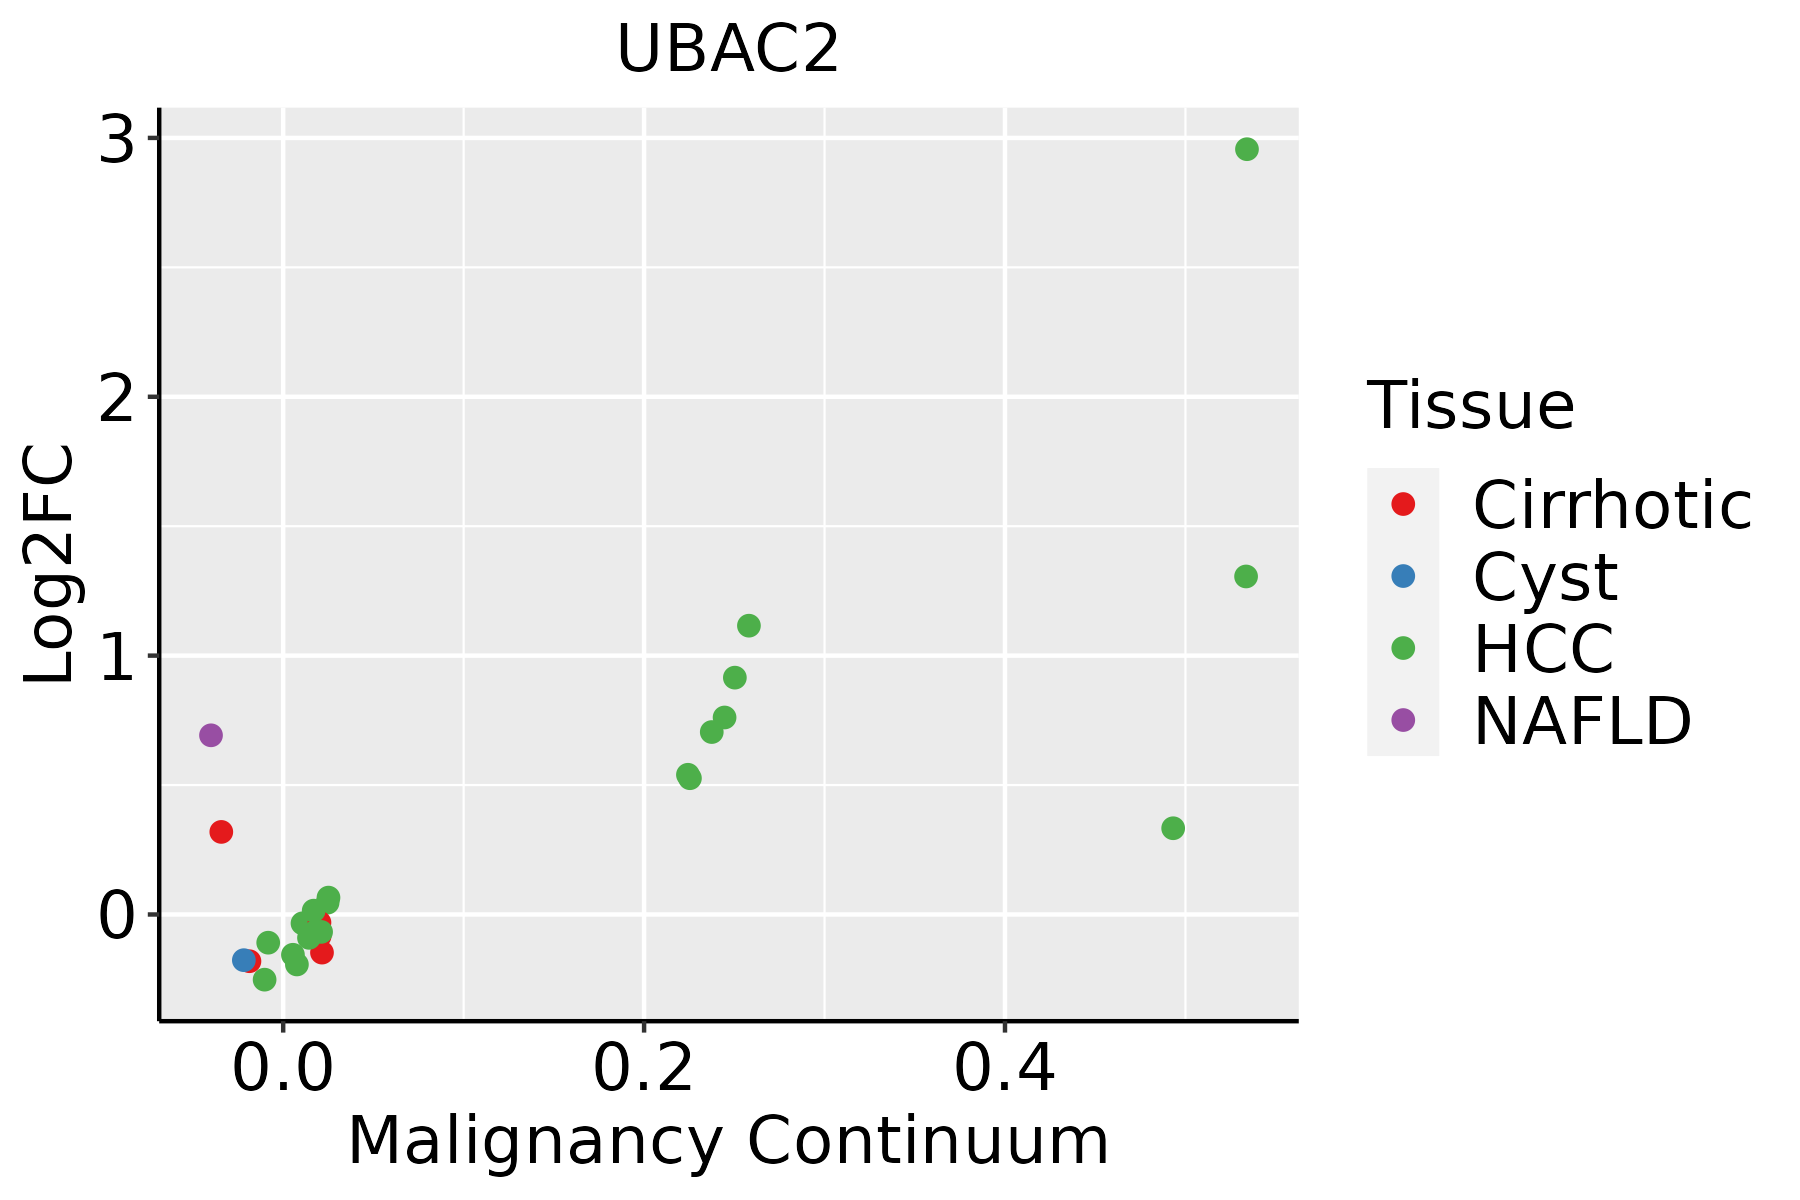 | HCC: Hepatocellular carcinoma |
| NAFLD: Non-alcoholic fatty liver disease | ||
| Lung | 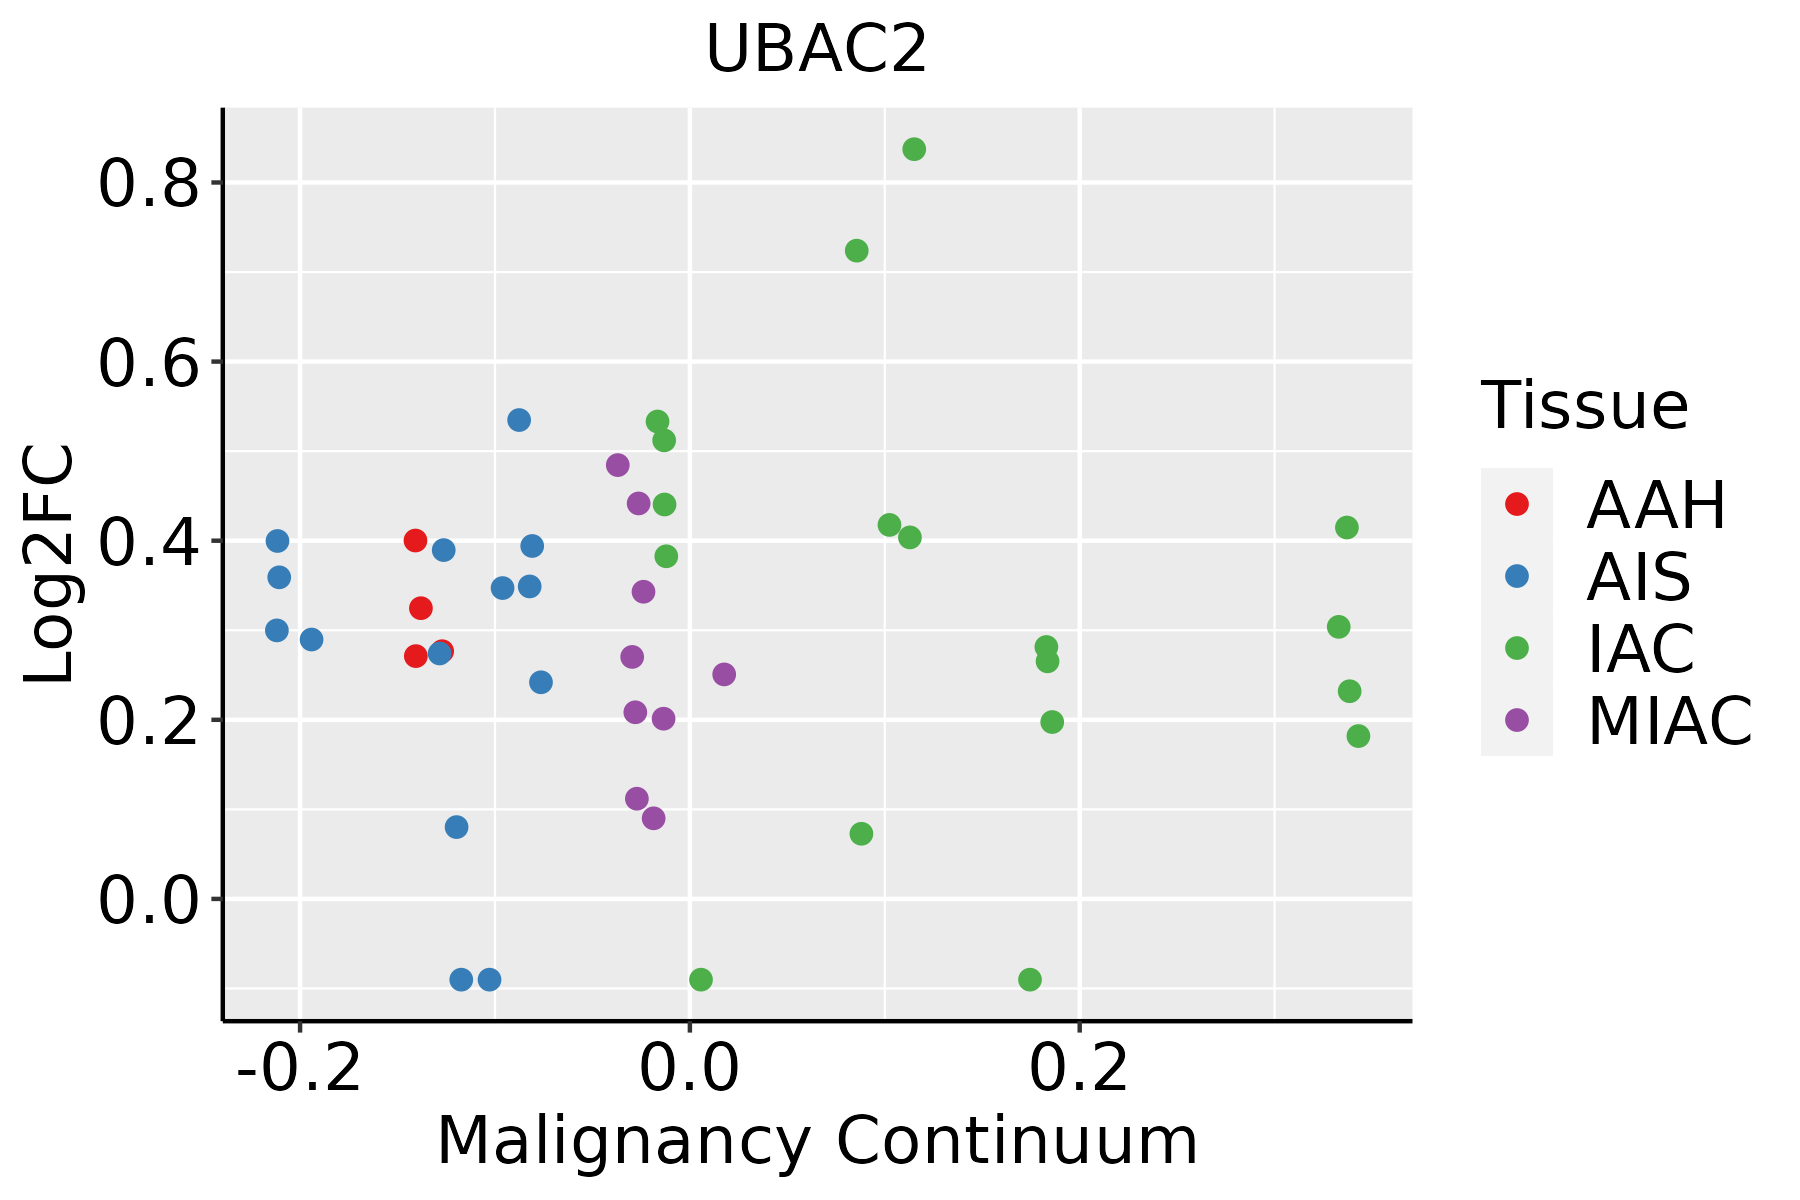 | AAH: Atypical adenomatous hyperplasia |
| AIS: Adenocarcinoma in situ | ||
| IAC: Invasive lung adenocarcinoma | ||
| MIA: Minimally invasive adenocarcinoma | ||
| Oral Cavity | 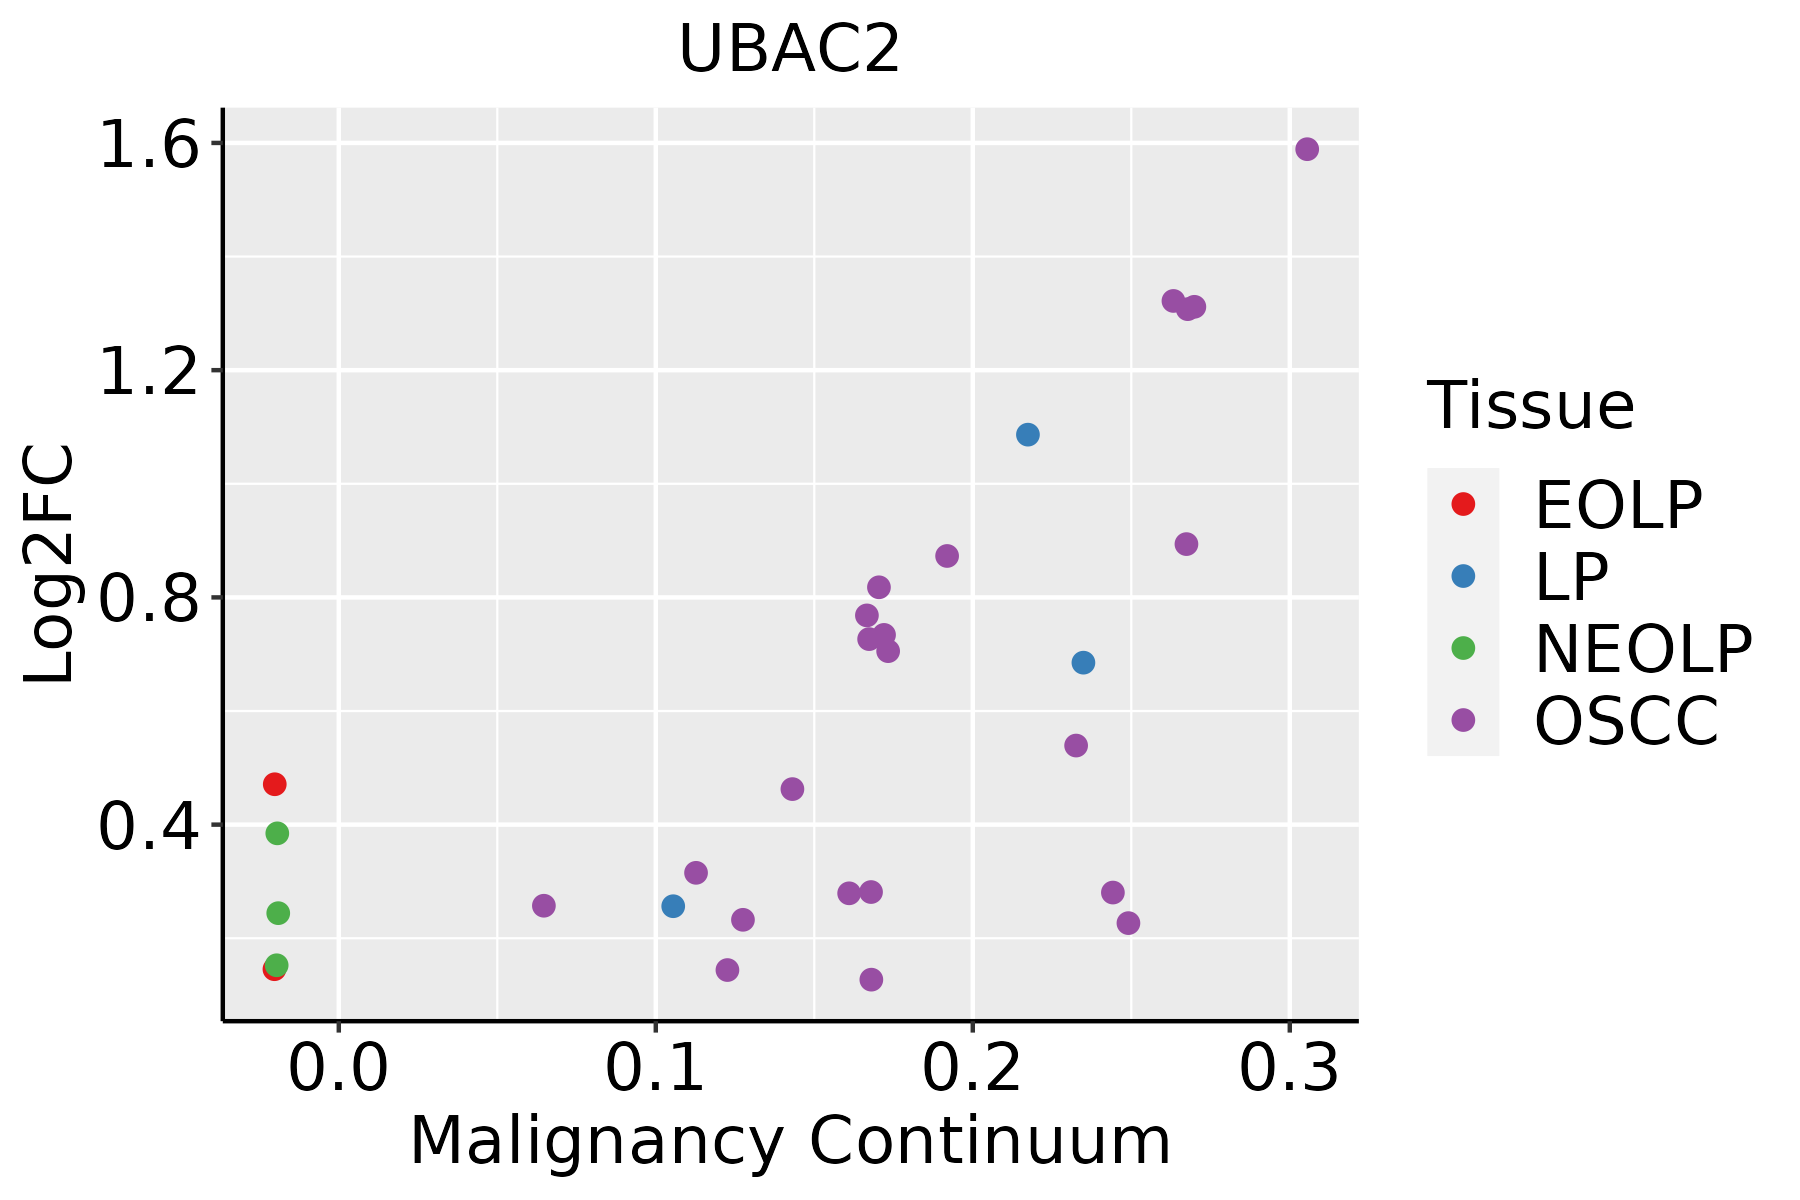 | EOLP: Erosive Oral lichen planus |
| LP: leukoplakia | ||
| NEOLP: Non-erosive oral lichen planus | ||
| OSCC: Oral squamous cell carcinoma | ||
| Skin | 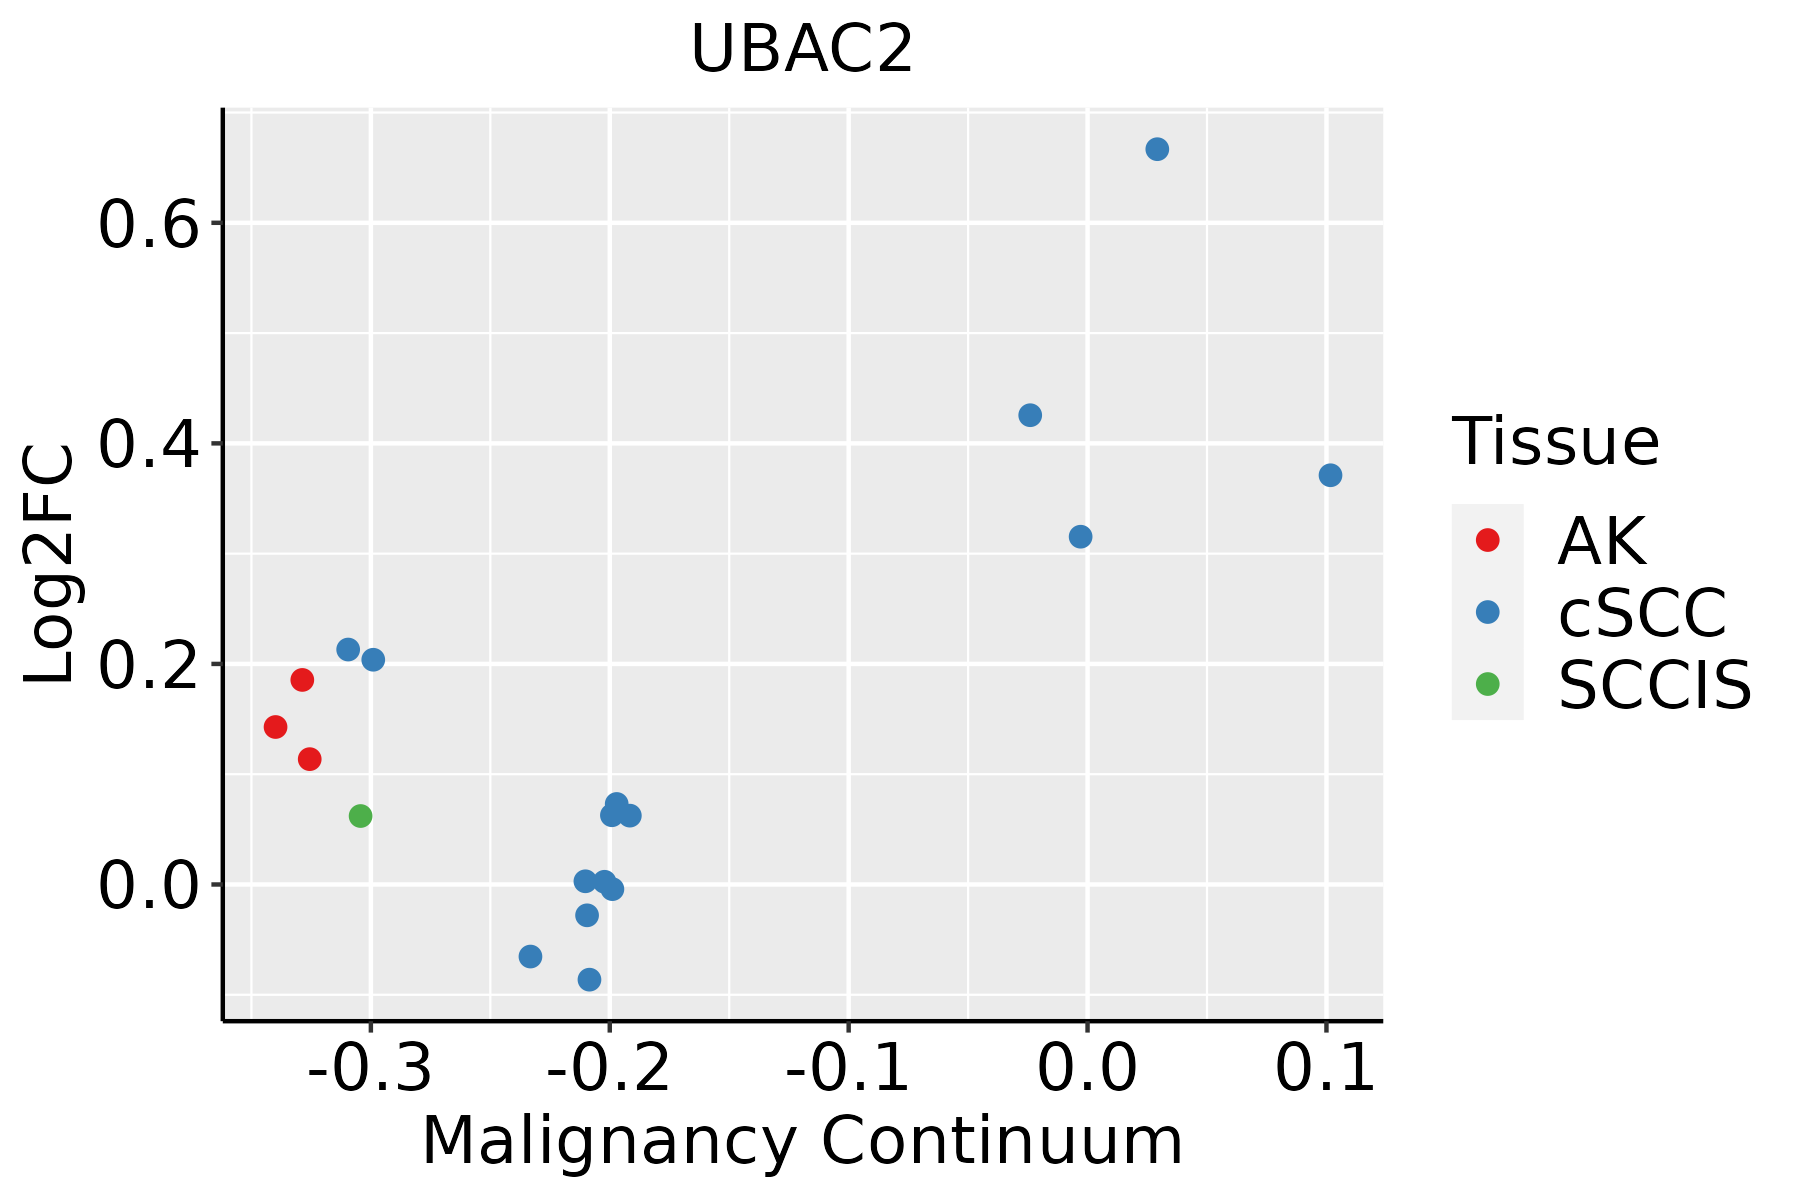 | AK: Actinic keratosis |
| cSCC: Cutaneous squamous cell carcinoma | ||
| SCCIS:squamous cell carcinoma in situ | ||
| Thyroid | 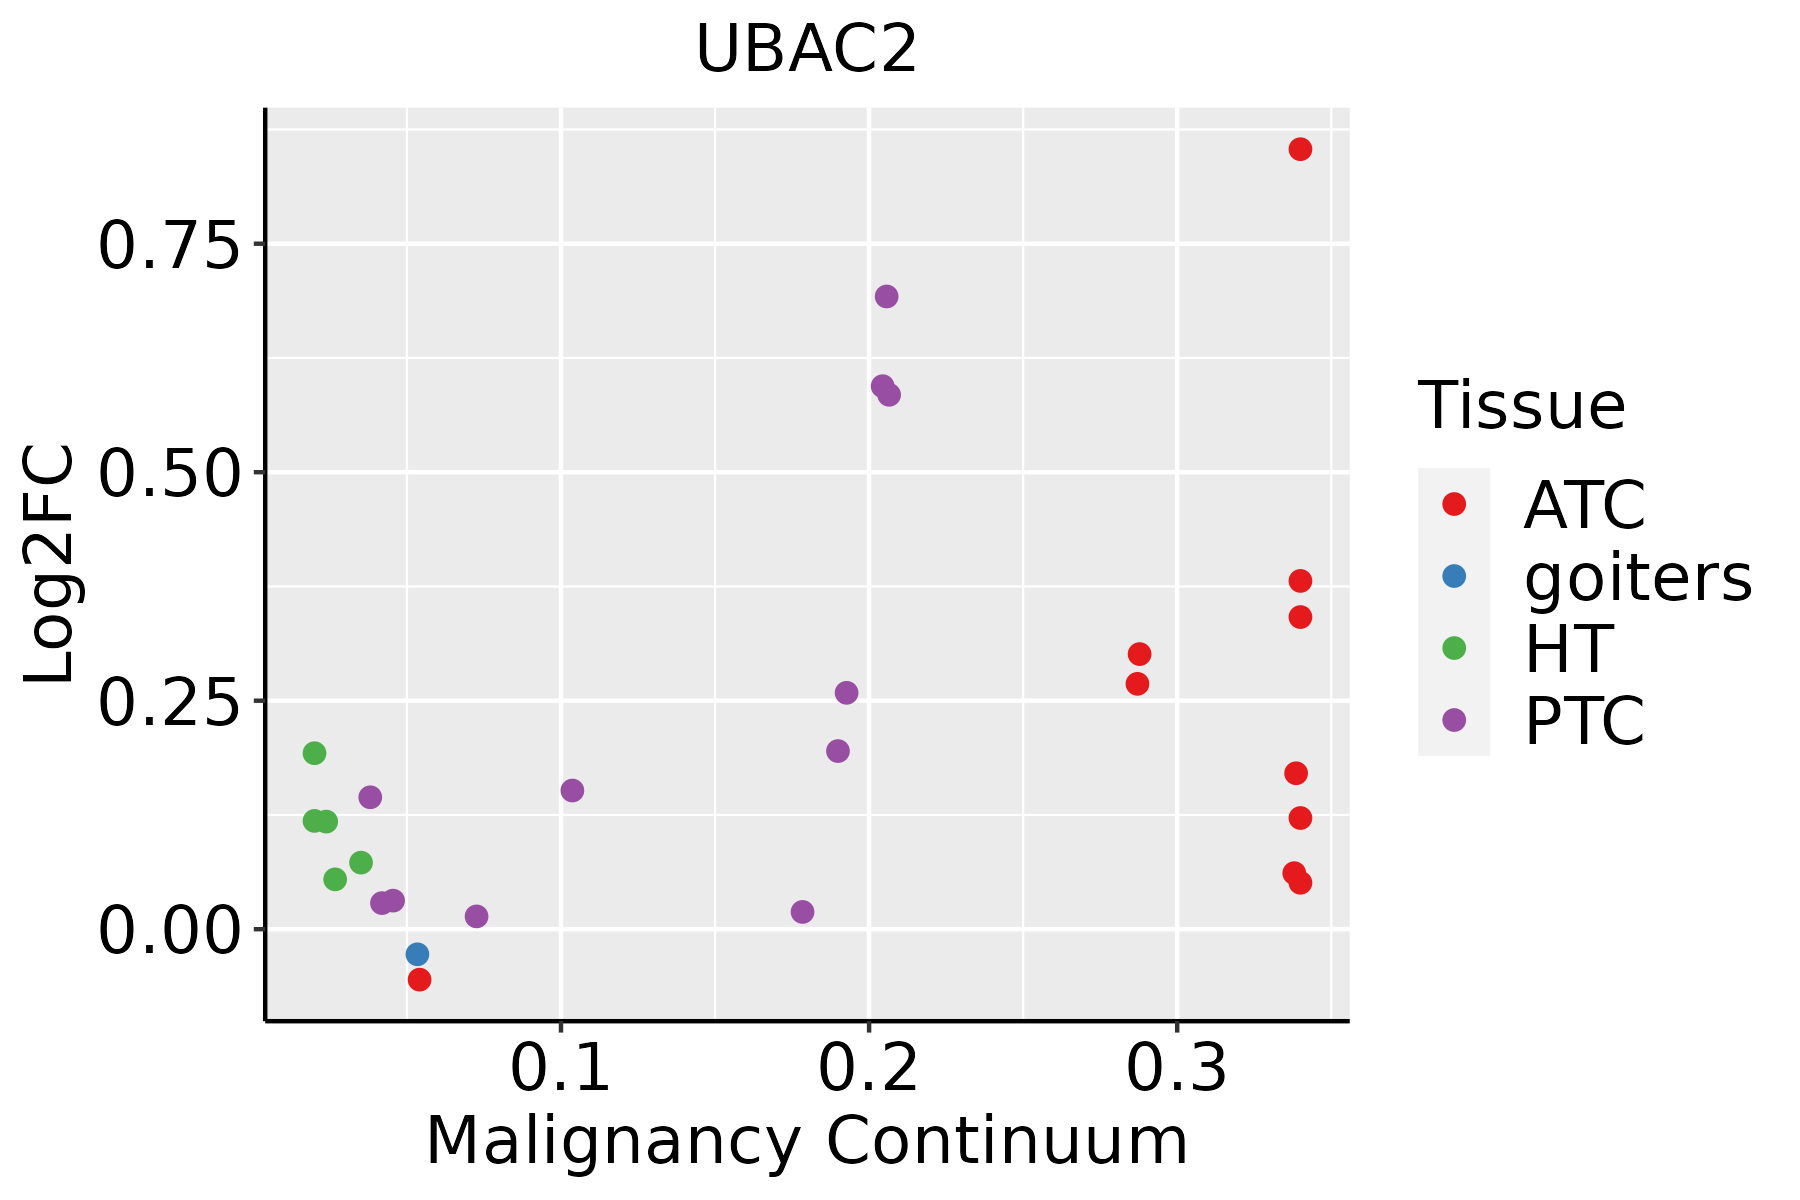 | ATC: Anaplastic thyroid cancer |
| HT: Hashimoto's thyroiditis | ||
| PTC: Papillary thyroid cancer |
| ∗log2FC in expression of this searched gene in stem-like cells from each diseased tissue sample relative to stem-like cells in normal samples in each tissue plotted against the malignancy continuum. Samples are colored based on if they are from different disease stage. |
Top |
Malignant transformation related pathway analysis |
| Find out the enriched GO biological processes and KEGG pathways involved in transition from healthy to precancer to cancer |
| Tissue | Disease Stage | Enriched GO biological Processes |
| Colorectum | AD |  |
| Colorectum | SER |  |
| Colorectum | MSS |  |
| Colorectum | MSI-H |  |
| Colorectum | FAP |  |
| ∗Top 15 enriched GO BP terms are showed in the bar plot of each disease state in each tissue. Each row represents a significant GO biological process which is colored according to the -log10(p.adjust). |
| Page: 1 2 3 4 5 6 7 8 9 |
| GO ID | Tissue | Disease Stage | Description | Gene Ratio | Bg Ratio | pvalue | p.adjust | Count |
| GO:0060070 | Colorectum | AD | canonical Wnt signaling pathway | 90/3918 | 303/18723 | 1.76e-04 | 2.38e-03 | 90 |
| GO:0060828 | Colorectum | AD | regulation of canonical Wnt signaling pathway | 77/3918 | 253/18723 | 2.19e-04 | 2.87e-03 | 77 |
| GO:1903828 | Colorectum | AD | negative regulation of cellular protein localization | 39/3918 | 117/18723 | 1.18e-03 | 1.06e-02 | 39 |
| GO:0070972 | Colorectum | AD | protein localization to endoplasmic reticulum | 26/3918 | 74/18723 | 3.28e-03 | 2.40e-02 | 26 |
| GO:0036503 | Colorectum | AD | ERAD pathway | 34/3918 | 107/18723 | 5.57e-03 | 3.63e-02 | 34 |
| GO:00104981 | Colorectum | SER | proteasomal protein catabolic process | 132/2897 | 490/18723 | 3.08e-11 | 5.55e-09 | 132 |
| GO:00349761 | Colorectum | SER | response to endoplasmic reticulum stress | 74/2897 | 256/18723 | 3.01e-08 | 2.05e-06 | 74 |
| GO:00331571 | Colorectum | SER | regulation of intracellular protein transport | 68/2897 | 229/18723 | 3.41e-08 | 2.30e-06 | 68 |
| GO:00323861 | Colorectum | SER | regulation of intracellular transport | 89/2897 | 337/18723 | 1.34e-07 | 7.96e-06 | 89 |
| GO:00160551 | Colorectum | SER | Wnt signaling pathway | 97/2897 | 444/18723 | 2.02e-04 | 3.68e-03 | 97 |
| GO:01987381 | Colorectum | SER | cell-cell signaling by wnt | 97/2897 | 446/18723 | 2.39e-04 | 4.11e-03 | 97 |
| GO:00301111 | Colorectum | SER | regulation of Wnt signaling pathway | 75/2897 | 328/18723 | 2.47e-04 | 4.20e-03 | 75 |
| GO:0030970 | Colorectum | SER | retrograde protein transport, ER to cytosol | 12/2897 | 29/18723 | 7.22e-04 | 9.44e-03 | 12 |
| GO:1903513 | Colorectum | SER | endoplasmic reticulum to cytosol transport | 12/2897 | 29/18723 | 7.22e-04 | 9.44e-03 | 12 |
| GO:0051051 | Colorectum | SER | negative regulation of transport | 98/2897 | 470/18723 | 1.01e-03 | 1.19e-02 | 98 |
| GO:00600701 | Colorectum | SER | canonical Wnt signaling pathway | 66/2897 | 303/18723 | 2.10e-03 | 2.06e-02 | 66 |
| GO:00365031 | Colorectum | SER | ERAD pathway | 28/2897 | 107/18723 | 2.92e-03 | 2.59e-02 | 28 |
| GO:19038281 | Colorectum | SER | negative regulation of cellular protein localization | 30/2897 | 117/18723 | 2.96e-03 | 2.62e-02 | 30 |
| GO:00608281 | Colorectum | SER | regulation of canonical Wnt signaling pathway | 56/2897 | 253/18723 | 3.03e-03 | 2.67e-02 | 56 |
| GO:0032527 | Colorectum | SER | protein exit from endoplasmic reticulum | 15/2897 | 48/18723 | 4.60e-03 | 3.64e-02 | 15 |
| Page: 1 2 3 4 5 6 7 8 9 10 11 12 13 14 15 16 17 |
| Pathway ID | Tissue | Disease Stage | Description | Gene Ratio | Bg Ratio | pvalue | p.adjust | qvalue | Count |
| Page: 1 |
Top |
Cell-cell communication analysis |
| Identification of potential cell-cell interactions between two cell types and their ligand-receptor pairs for different disease states |
| Ligand | Receptor | LRpair | Pathway | Tissue | Disease Stage |
| Page: 1 |
Top |
Single-cell gene regulatory network inference analysis |
| Find out the significant the regulons (TFs) and the target genes of each regulon across cell types for different disease states |
| TF | Cell Type | Tissue | Disease Stage | Target Gene | RSS | Regulon Activity |
| ∗The dot plots of a searched regulon are shown for all cell subpopulations in each disease state of each tissue based on the regulon specific score inferred using pySCENIC and by calculating the average expression. |
| Page: 1 |
Top |
Somatic mutation of malignant transformation related genes |
| Annotation of somatic variants for genes involved in malignant transformation |
| Hugo Symbol | Variant Class | Variant Classification | dbSNP RS | HGVSc | HGVSp | HGVSp Short | SWISSPROT | BIOTYPE | SIFT | PolyPhen | Tumor Sample Barcode | Tissue | Histology | Sex | Age | Stage | Therapy Types | Drugs | Outcome |
| UBAC2 | SNV | Missense_Mutation | novel | c.378N>C | p.Leu126Phe | p.L126F | Q8NBM4 | protein_coding | tolerated(0.13) | benign(0.158) | TCGA-3C-AALI-01 | Breast | breast invasive carcinoma | Female | <65 | I/II | Unspecific | Poly E | Complete Response |
| UBAC2 | SNV | Missense_Mutation | c.109N>C | p.Cys37Arg | p.C37R | Q8NBM4 | protein_coding | tolerated(0.21) | benign(0.1) | TCGA-B6-A1KN-01 | Breast | breast invasive carcinoma | Female | <65 | III/IV | Unknown | Unknown | SD | |
| UBAC2 | SNV | Missense_Mutation | rs150911743 | c.877N>A | p.Gly293Ser | p.G293S | Q8NBM4 | protein_coding | tolerated(0.67) | benign(0.028) | TCGA-EW-A1J6-01 | Breast | breast invasive carcinoma | Female | >=65 | I/II | Hormone Therapy | femara | SD |
| UBAC2 | insertion | Frame_Shift_Ins | novel | c.151_152insCATATGT | p.Asp51AlafsTer18 | p.D51Afs*18 | Q8NBM4 | protein_coding | TCGA-AQ-A04J-01 | Breast | breast invasive carcinoma | Female | <65 | I/II | Chemotherapy | cytoxan | SD | ||
| UBAC2 | insertion | In_Frame_Ins | novel | c.153_154insTCCCAAAATGTGTTCCCTAATATGTATCAA | p.Asp51_Phe52insSerGlnAsnValPheProAsnMetTyrGln | p.D51_F52insSQNVFPNMYQ | Q8NBM4 | protein_coding | TCGA-AQ-A04J-01 | Breast | breast invasive carcinoma | Female | <65 | I/II | Chemotherapy | cytoxan | SD | ||
| UBAC2 | SNV | Missense_Mutation | rs775996860 | c.854G>A | p.Arg285Gln | p.R285Q | Q8NBM4 | protein_coding | tolerated(0.11) | probably_damaging(0.976) | TCGA-A6-6780-01 | Colorectum | colon adenocarcinoma | Male | >=65 | I/II | Unknown | Unknown | SD |
| UBAC2 | SNV | Missense_Mutation | rs765235078 | c.862N>A | p.Val288Ile | p.V288I | Q8NBM4 | protein_coding | tolerated(0.58) | benign(0) | TCGA-AA-3877-01 | Colorectum | colon adenocarcinoma | Female | >=65 | I/II | Unknown | Unknown | SD |
| UBAC2 | SNV | Missense_Mutation | rs550310299 | c.38N>T | p.Ala13Val | p.A13V | Q8NBM4 | protein_coding | deleterious(0) | probably_damaging(0.994) | TCGA-DM-A0XD-01 | Colorectum | colon adenocarcinoma | Male | >=65 | I/II | Unknown | Unknown | PD |
| UBAC2 | SNV | Missense_Mutation | novel | c.182G>T | p.Arg61Ile | p.R61I | Q8NBM4 | protein_coding | deleterious(0) | possibly_damaging(0.648) | TCGA-F5-6814-01 | Colorectum | rectum adenocarcinoma | Male | <65 | I/II | Unknown | Unknown | SD |
| UBAC2 | SNV | Missense_Mutation | novel | c.505N>A | p.Gly169Arg | p.G169R | Q8NBM4 | protein_coding | deleterious(0) | probably_damaging(0.96) | TCGA-AP-A0LM-01 | Endometrium | uterine corpus endometrioid carcinoma | Female | <65 | III/IV | Chemotherapy | cisplatin | SD |
| Page: 1 2 3 |
Top |
Related drugs of malignant transformation related genes |
| Identification of chemicals and drugs interact with genes involved in malignant transfromation |
| (DGIdb 4.0) |
| Entrez ID | Symbol | Category | Interaction Types | Drug Claim Name | Drug Name | PMIDs |
| Page: 1 |

Copyright 2023-Present -The University of Texas Health Science Center at Houston |