
|
|||||
|
 | |
| |
| |
| |
| |
| |
|
Gene: TSG101 |
Gene summary for TSG101 |
| Gene information | Species | Human | Gene symbol | TSG101 | Gene ID | 7251 |
| Gene name | tumor susceptibility 101 | |
| Gene Alias | TSG10 | |
| Cytomap | 11p15.1 | |
| Gene Type | protein-coding | GO ID | GO:0000122 | UniProtAcc | Q99816 |
Top |
Malignant transformation analysis |
| Identification of the aberrant gene expression in precancerous and cancerous lesions by comparing the gene expression of stem-like cells in diseased tissues with normal stem cells |
| Entrez ID | Symbol | Replicates | Species | Organ | Tissue | Adj P-value | Log2FC | Malignancy |
| 7251 | TSG101 | HTA11_347_2000001011 | Human | Colorectum | AD | 3.31e-07 | 4.41e-01 | -0.1954 |
| 7251 | TSG101 | HTA11_83_2000001011 | Human | Colorectum | SER | 5.42e-03 | 2.53e-01 | -0.1526 |
| 7251 | TSG101 | HTA11_99999970781_79442 | Human | Colorectum | MSS | 2.19e-02 | 3.10e-01 | 0.294 |
| 7251 | TSG101 | A015-C-203 | Human | Colorectum | FAP | 2.35e-12 | -1.99e-01 | -0.1294 |
| 7251 | TSG101 | A002-C-201 | Human | Colorectum | FAP | 4.19e-06 | -2.03e-01 | 0.0324 |
| 7251 | TSG101 | A001-C-108 | Human | Colorectum | FAP | 5.35e-06 | -1.30e-01 | -0.0272 |
| 7251 | TSG101 | A002-C-205 | Human | Colorectum | FAP | 1.43e-09 | -2.47e-01 | -0.1236 |
| 7251 | TSG101 | A015-C-006 | Human | Colorectum | FAP | 2.48e-05 | -2.65e-01 | -0.0994 |
| 7251 | TSG101 | A002-C-114 | Human | Colorectum | FAP | 6.35e-07 | -2.64e-01 | -0.1561 |
| 7251 | TSG101 | A015-C-104 | Human | Colorectum | FAP | 1.35e-13 | -1.29e-01 | -0.1899 |
| 7251 | TSG101 | A001-C-014 | Human | Colorectum | FAP | 3.35e-05 | -1.94e-01 | 0.0135 |
| 7251 | TSG101 | A002-C-016 | Human | Colorectum | FAP | 5.84e-07 | -2.05e-01 | 0.0521 |
| 7251 | TSG101 | A015-C-002 | Human | Colorectum | FAP | 3.51e-04 | -2.47e-01 | -0.0763 |
| 7251 | TSG101 | A002-C-116 | Human | Colorectum | FAP | 8.40e-13 | -2.06e-01 | -0.0452 |
| 7251 | TSG101 | A014-C-008 | Human | Colorectum | FAP | 2.57e-06 | -2.79e-01 | -0.191 |
| 7251 | TSG101 | A018-E-020 | Human | Colorectum | FAP | 6.29e-10 | -2.89e-01 | -0.2034 |
| 7251 | TSG101 | F034 | Human | Colorectum | FAP | 3.28e-08 | -2.52e-01 | -0.0665 |
| 7251 | TSG101 | CRC-1-8810 | Human | Colorectum | CRC | 1.12e-02 | -1.64e-01 | 0.6257 |
| 7251 | TSG101 | LZE2T | Human | Esophagus | ESCC | 4.30e-03 | 3.30e-01 | 0.082 |
| 7251 | TSG101 | LZE4T | Human | Esophagus | ESCC | 2.04e-16 | 4.82e-01 | 0.0811 |
| Page: 1 2 3 4 5 6 7 |
| Tissue | Expression Dynamics | Abbreviation |
| Colorectum (GSE201348) |  | FAP: Familial adenomatous polyposis |
| CRC: Colorectal cancer | ||
| Colorectum (HTA11) |  | AD: Adenomas |
| SER: Sessile serrated lesions | ||
| MSI-H: Microsatellite-high colorectal cancer | ||
| MSS: Microsatellite stable colorectal cancer | ||
| Esophagus | 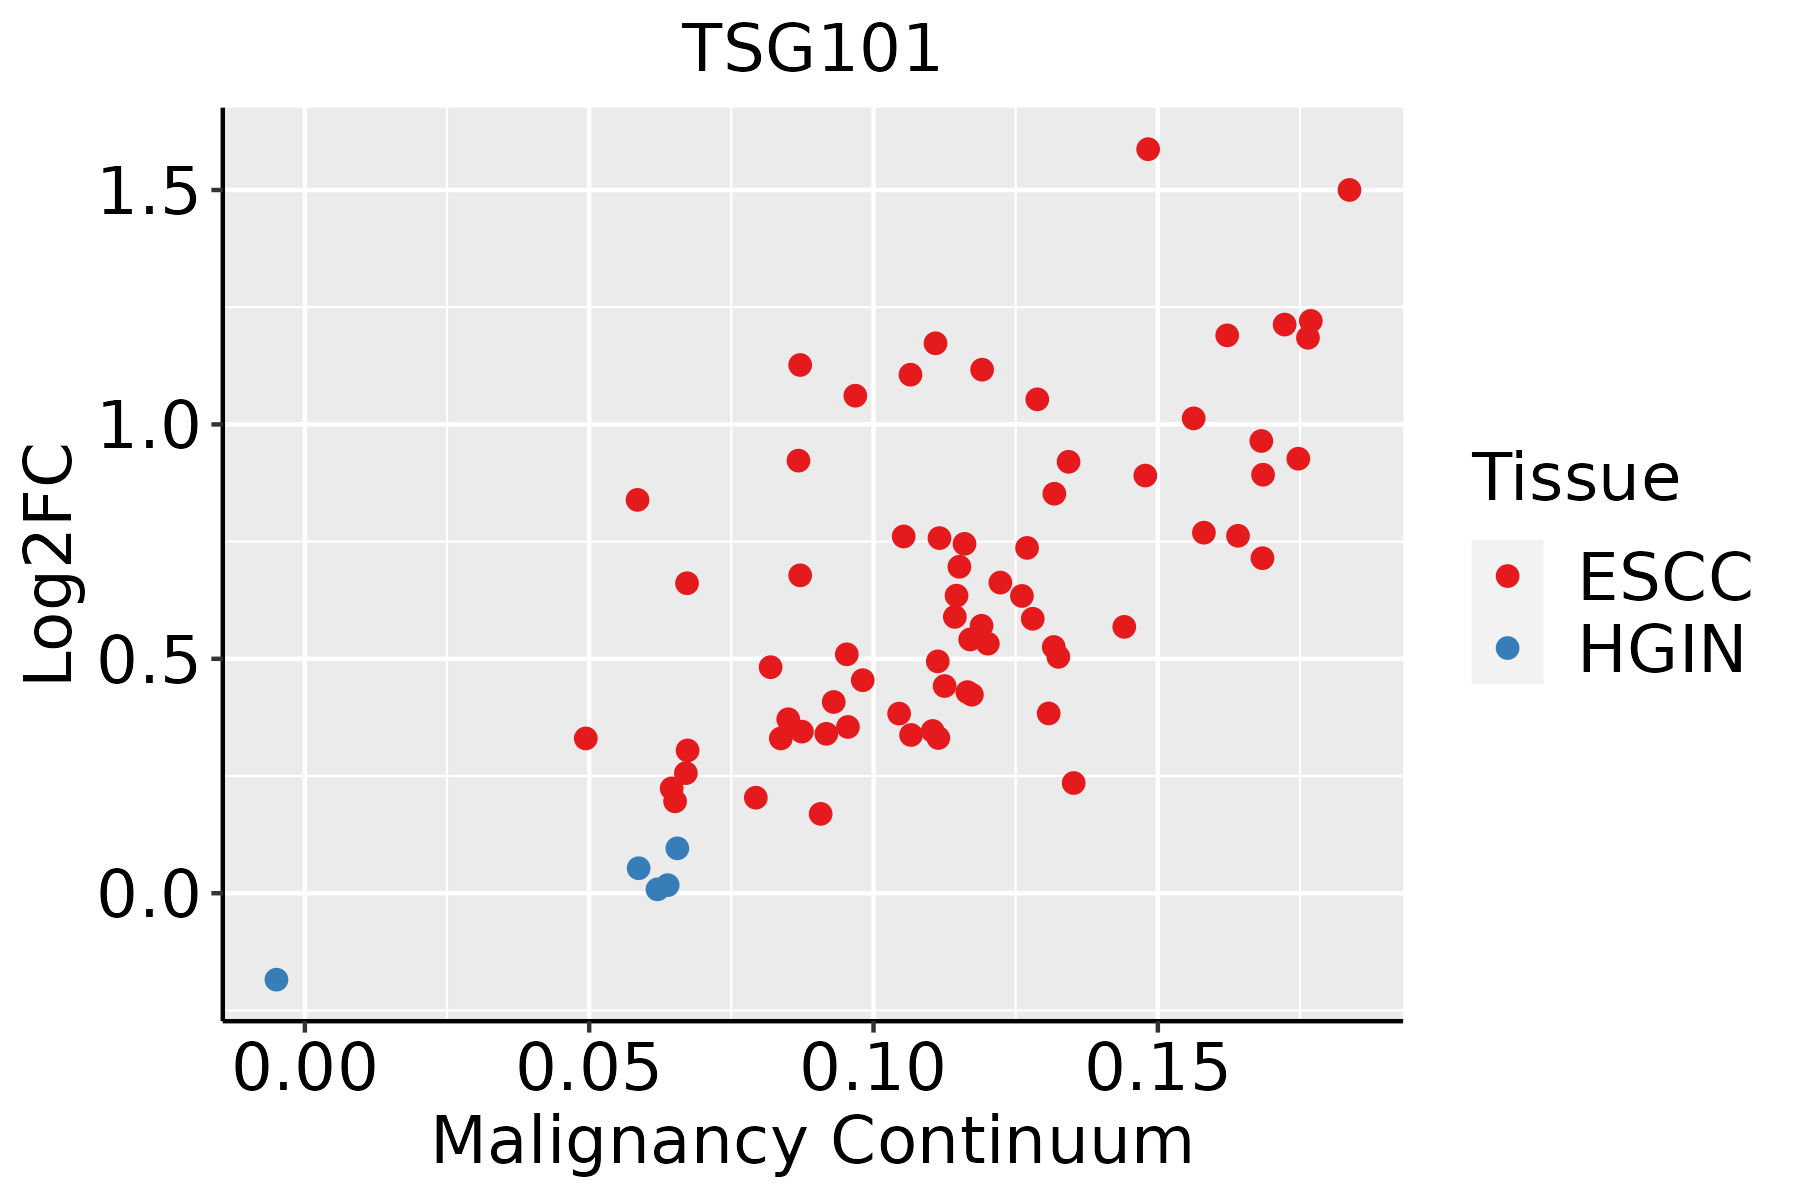 | ESCC: Esophageal squamous cell carcinoma |
| HGIN: High-grade intraepithelial neoplasias | ||
| LGIN: Low-grade intraepithelial neoplasias | ||
| Liver | 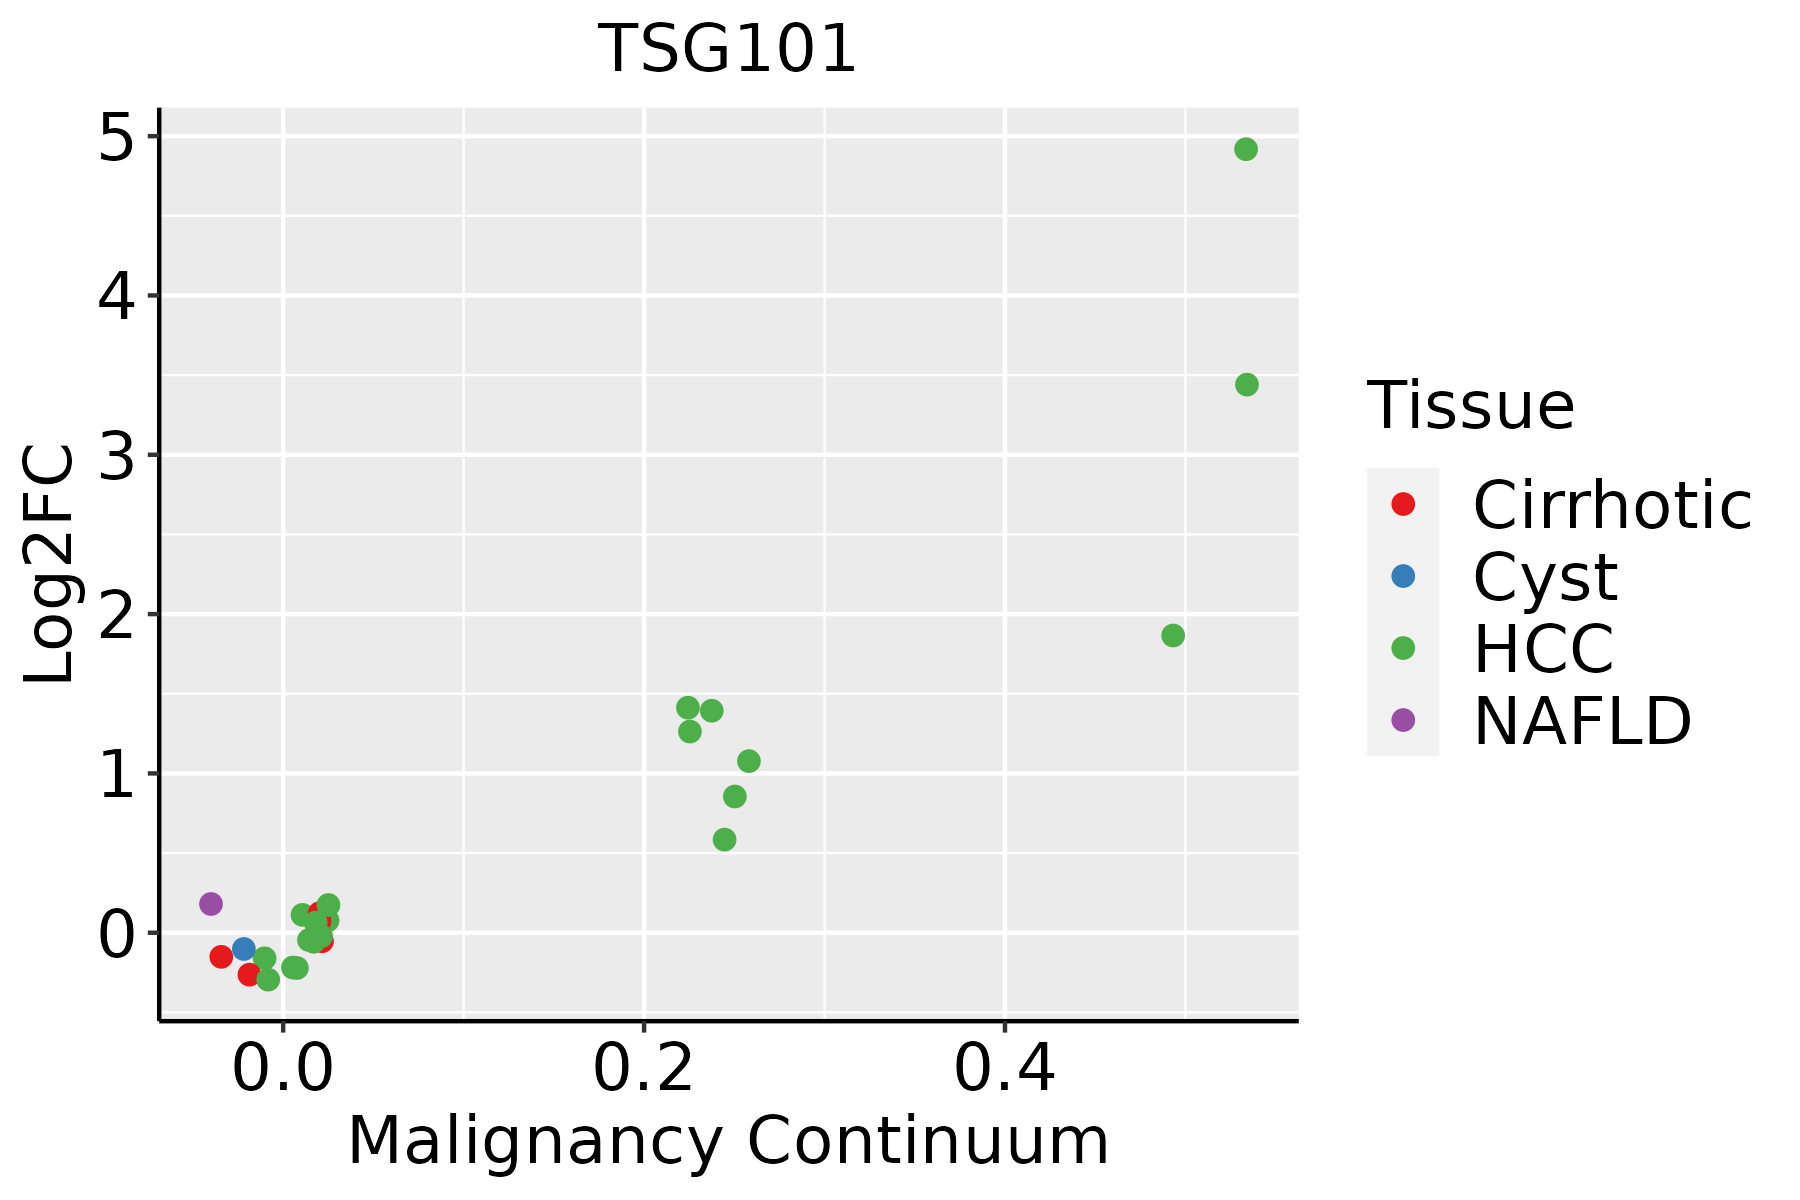 | HCC: Hepatocellular carcinoma |
| NAFLD: Non-alcoholic fatty liver disease | ||
| Oral Cavity | 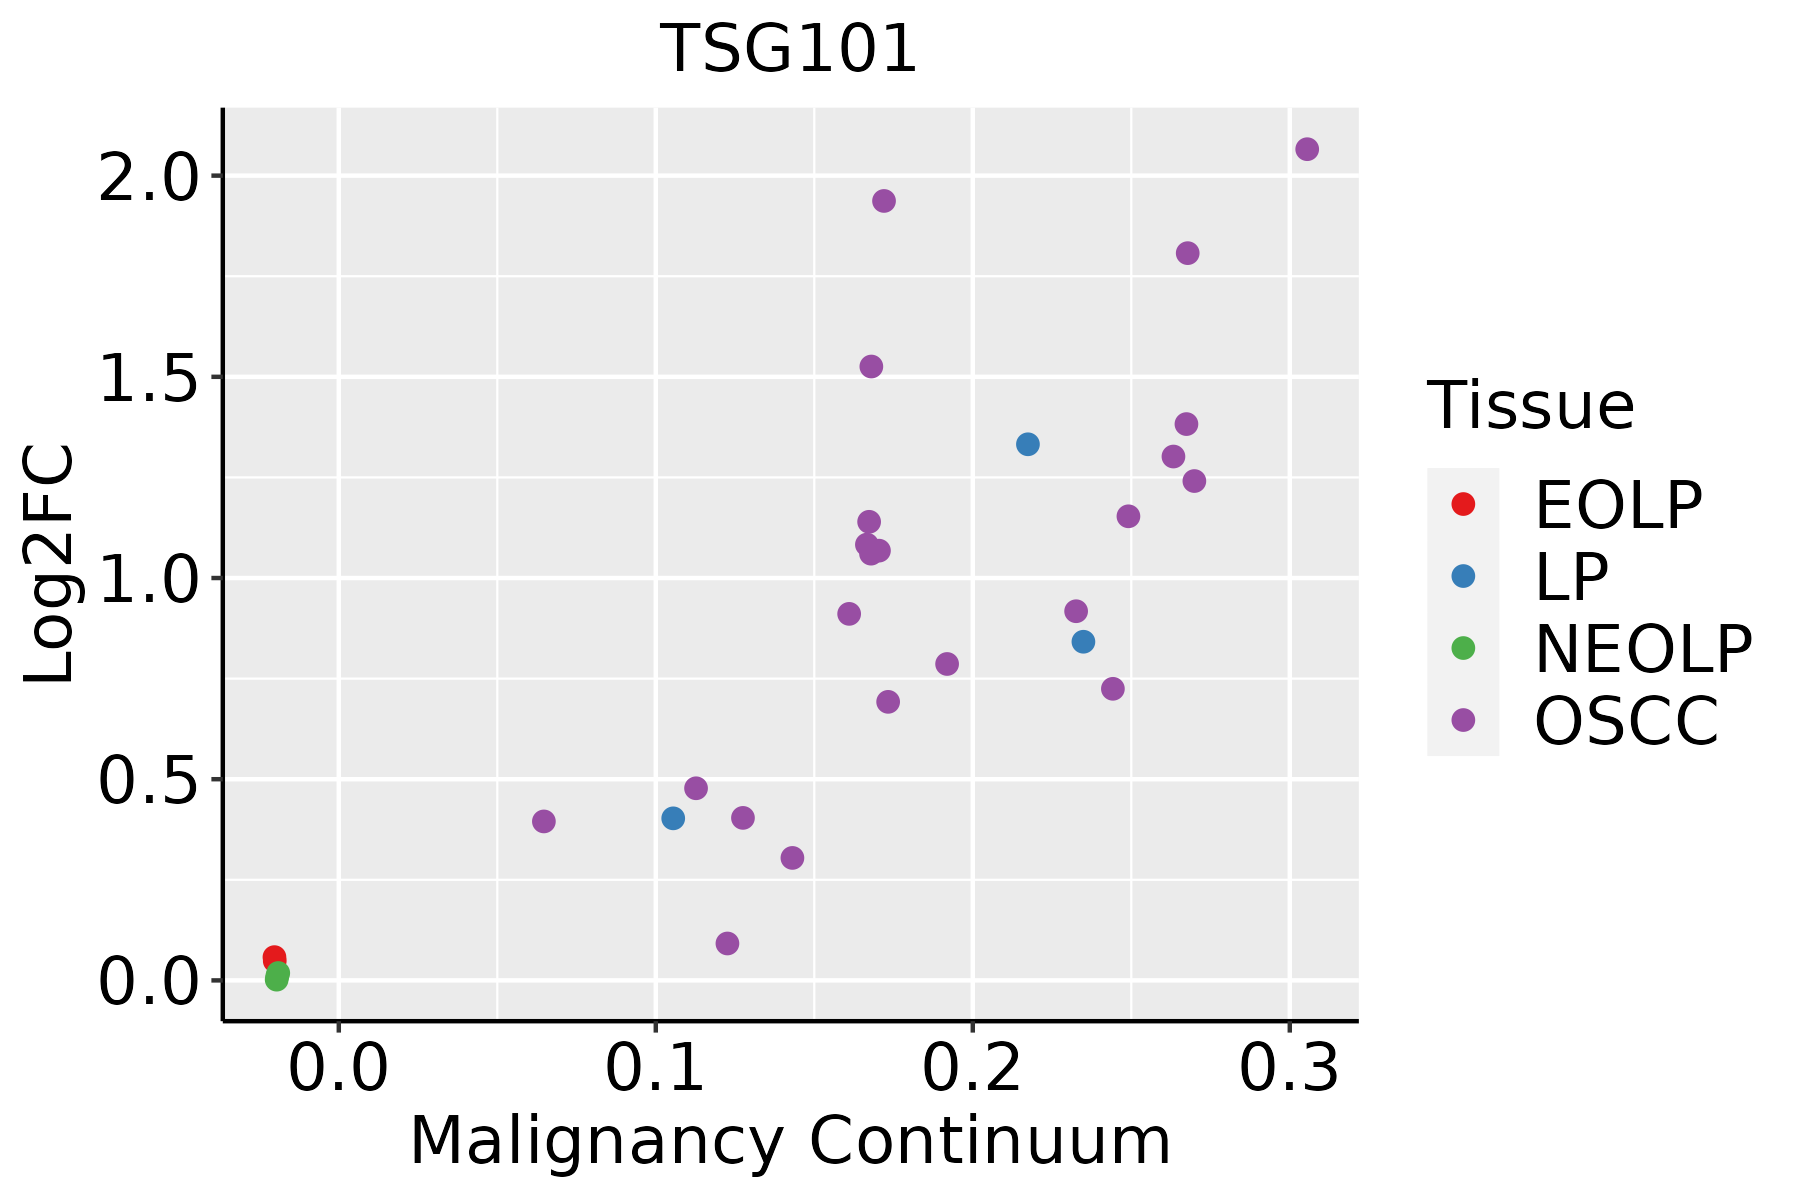 | EOLP: Erosive Oral lichen planus |
| LP: leukoplakia | ||
| NEOLP: Non-erosive oral lichen planus | ||
| OSCC: Oral squamous cell carcinoma | ||
| Skin | 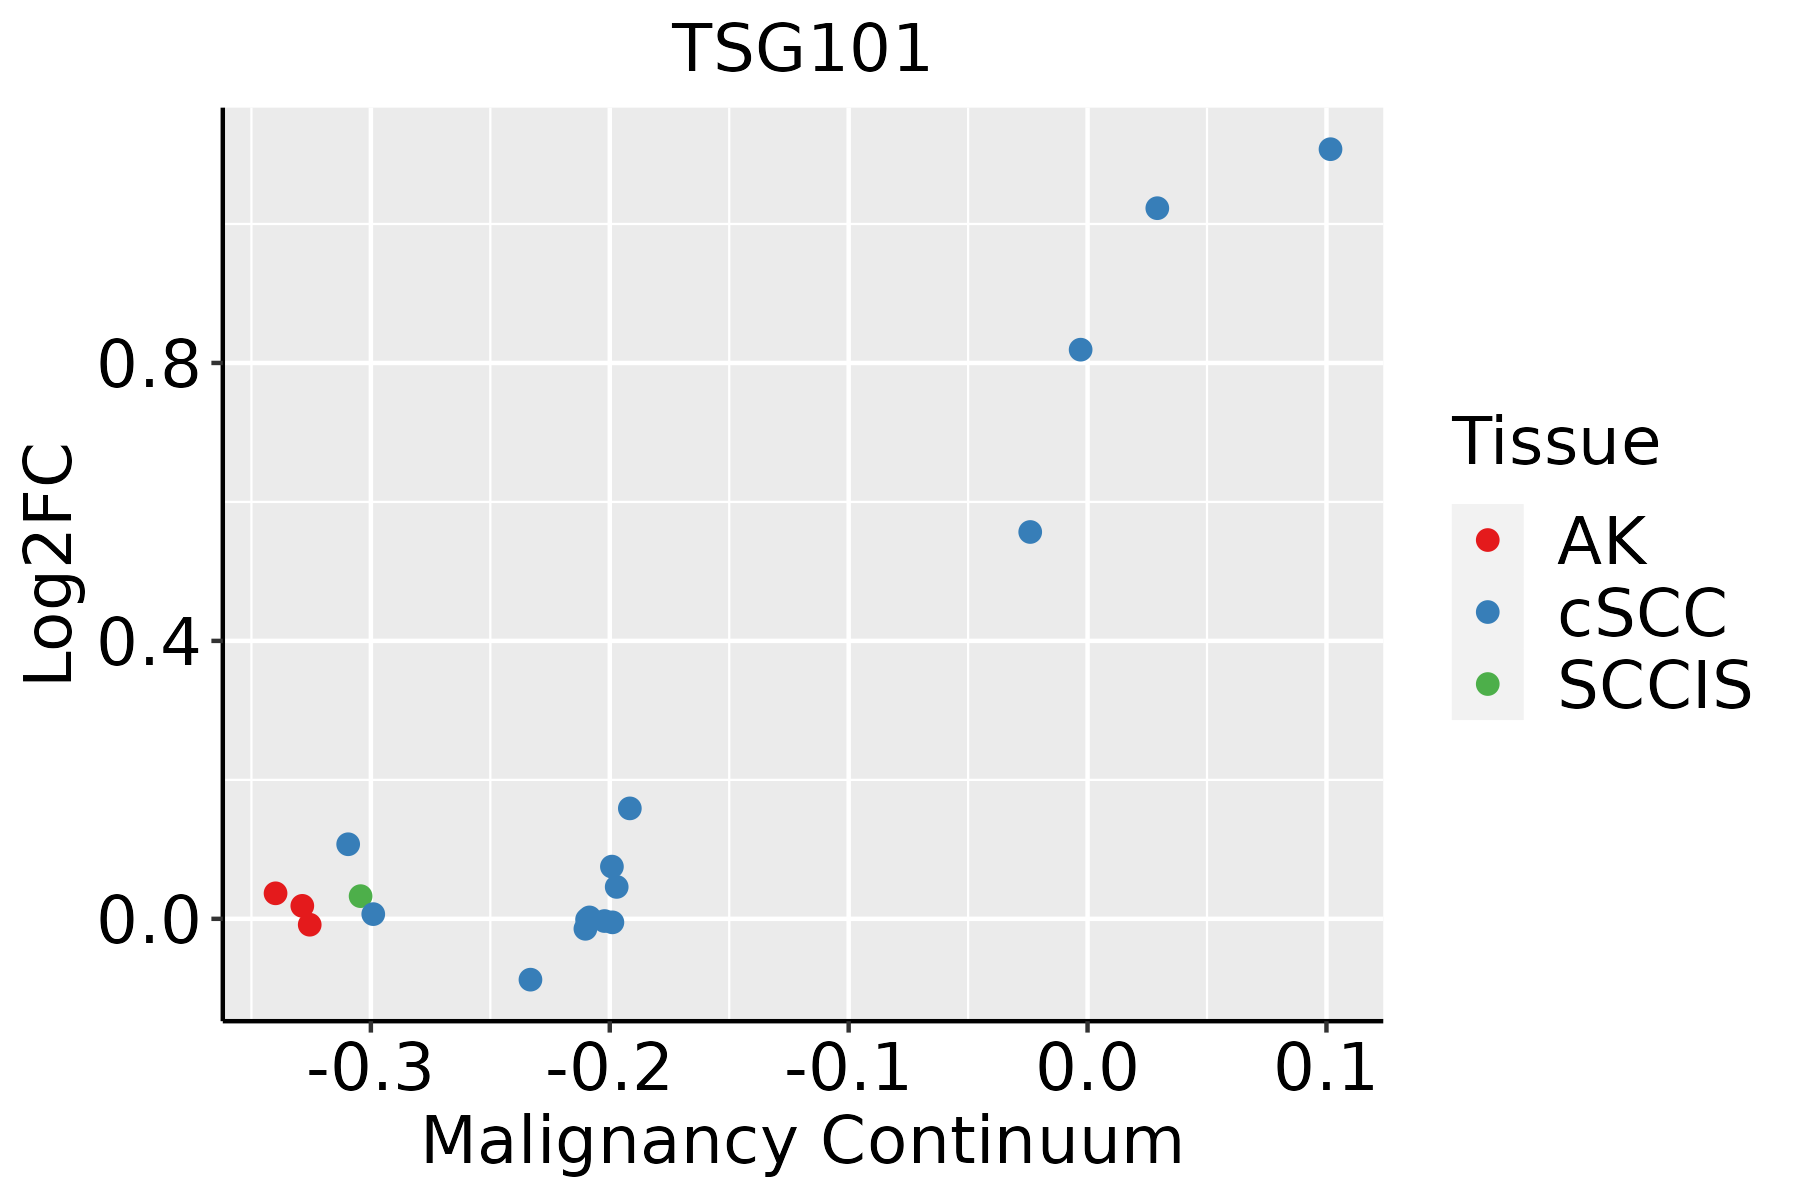 | AK: Actinic keratosis |
| cSCC: Cutaneous squamous cell carcinoma | ||
| SCCIS:squamous cell carcinoma in situ | ||
| Thyroid | 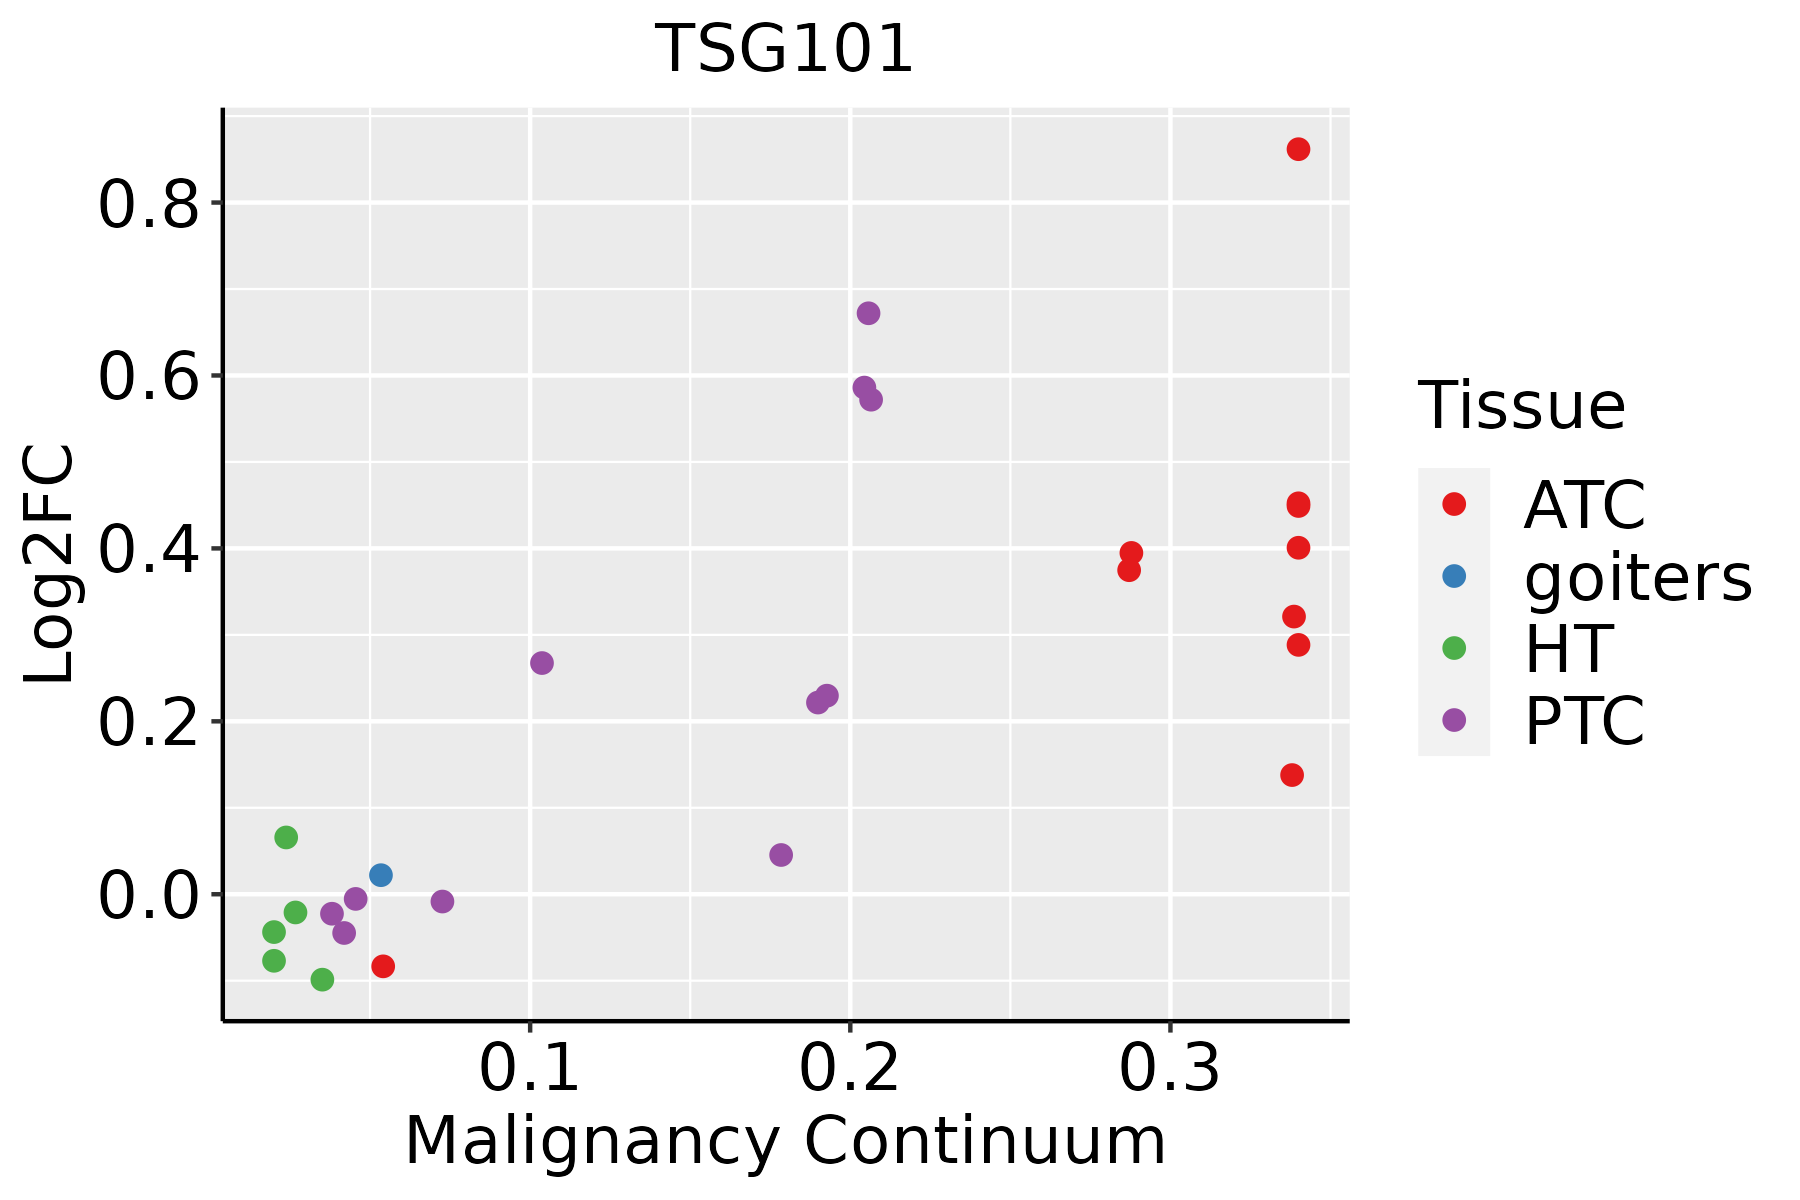 | ATC: Anaplastic thyroid cancer |
| HT: Hashimoto's thyroiditis | ||
| PTC: Papillary thyroid cancer |
| ∗log2FC in expression of this searched gene in stem-like cells from each diseased tissue sample relative to stem-like cells in normal samples in each tissue plotted against the malignancy continuum. Samples are colored based on if they are from different disease stage. |
Top |
Malignant transformation related pathway analysis |
| Find out the enriched GO biological processes and KEGG pathways involved in transition from healthy to precancer to cancer |
| Tissue | Disease Stage | Enriched GO biological Processes |
| Colorectum | AD |  |
| Colorectum | SER |  |
| Colorectum | MSS |  |
| Colorectum | MSI-H |  |
| Colorectum | FAP |  |
| ∗Top 15 enriched GO BP terms are showed in the bar plot of each disease state in each tissue. Each row represents a significant GO biological process which is colored according to the -log10(p.adjust). |
| Page: 1 2 3 4 5 6 7 8 9 |
| GO ID | Tissue | Disease Stage | Description | Gene Ratio | Bg Ratio | pvalue | p.adjust | Count |
| GO:1901185 | Colorectum | AD | negative regulation of ERBB signaling pathway | 19/3918 | 32/18723 | 2.39e-06 | 6.98e-05 | 19 |
| GO:0016049 | Colorectum | AD | cell growth | 143/3918 | 482/18723 | 2.83e-06 | 8.09e-05 | 143 |
| GO:0052126 | Colorectum | AD | movement in host environment | 63/3918 | 175/18723 | 2.85e-06 | 8.11e-05 | 63 |
| GO:0050792 | Colorectum | AD | regulation of viral process | 59/3918 | 164/18723 | 5.95e-06 | 1.52e-04 | 59 |
| GO:1901184 | Colorectum | AD | regulation of ERBB signaling pathway | 34/3918 | 79/18723 | 7.46e-06 | 1.82e-04 | 34 |
| GO:0001558 | Colorectum | AD | regulation of cell growth | 124/3918 | 414/18723 | 7.67e-06 | 1.86e-04 | 124 |
| GO:0010563 | Colorectum | AD | negative regulation of phosphorus metabolic process | 130/3918 | 442/18723 | 1.26e-05 | 2.76e-04 | 130 |
| GO:0045936 | Colorectum | AD | negative regulation of phosphate metabolic process | 129/3918 | 441/18723 | 1.81e-05 | 3.76e-04 | 129 |
| GO:1903543 | Colorectum | AD | positive regulation of exosomal secretion | 11/3918 | 15/18723 | 1.95e-05 | 4.01e-04 | 11 |
| GO:0051348 | Colorectum | AD | negative regulation of transferase activity | 85/3918 | 268/18723 | 2.07e-05 | 4.19e-04 | 85 |
| GO:0042058 | Colorectum | AD | regulation of epidermal growth factor receptor signaling pathway | 31/3918 | 73/18723 | 2.56e-05 | 4.89e-04 | 31 |
| GO:0042059 | Colorectum | AD | negative regulation of epidermal growth factor receptor signaling pathway | 16/3918 | 28/18723 | 2.96e-05 | 5.46e-04 | 16 |
| GO:0036257 | Colorectum | AD | multivesicular body organization | 17/3918 | 31/18723 | 3.45e-05 | 6.29e-04 | 17 |
| GO:0007032 | Colorectum | AD | endosome organization | 33/3918 | 82/18723 | 5.30e-05 | 9.01e-04 | 33 |
| GO:0007041 | Colorectum | AD | lysosomal transport | 42/3918 | 114/18723 | 6.61e-05 | 1.07e-03 | 42 |
| GO:0042326 | Colorectum | AD | negative regulation of phosphorylation | 112/3918 | 385/18723 | 8.02e-05 | 1.27e-03 | 112 |
| GO:1903900 | Colorectum | AD | regulation of viral life cycle | 51/3918 | 148/18723 | 9.01e-05 | 1.38e-03 | 51 |
| GO:0036258 | Colorectum | AD | multivesicular body assembly | 16/3918 | 30/18723 | 9.18e-05 | 1.40e-03 | 16 |
| GO:0001933 | Colorectum | AD | negative regulation of protein phosphorylation | 101/3918 | 342/18723 | 9.39e-05 | 1.42e-03 | 101 |
| GO:0030100 | Colorectum | AD | regulation of endocytosis | 67/3918 | 211/18723 | 1.42e-04 | 2.01e-03 | 67 |
| Page: 1 2 3 4 5 6 7 8 9 10 11 12 13 14 15 16 17 18 19 20 21 22 23 24 25 26 27 28 29 30 31 32 33 34 35 36 37 38 39 40 |
| Pathway ID | Tissue | Disease Stage | Description | Gene Ratio | Bg Ratio | pvalue | p.adjust | qvalue | Count |
| hsa04144 | Colorectum | AD | Endocytosis | 111/2092 | 251/8465 | 5.95e-12 | 1.42e-10 | 9.08e-11 | 111 |
| hsa041441 | Colorectum | AD | Endocytosis | 111/2092 | 251/8465 | 5.95e-12 | 1.42e-10 | 9.08e-11 | 111 |
| hsa041442 | Colorectum | SER | Endocytosis | 81/1580 | 251/8465 | 1.14e-07 | 2.36e-06 | 1.71e-06 | 81 |
| hsa041443 | Colorectum | SER | Endocytosis | 81/1580 | 251/8465 | 1.14e-07 | 2.36e-06 | 1.71e-06 | 81 |
| hsa041444 | Colorectum | MSS | Endocytosis | 102/1875 | 251/8465 | 1.85e-11 | 4.43e-10 | 2.71e-10 | 102 |
| hsa03250 | Colorectum | MSS | Viral life cycle - HIV-1 | 23/1875 | 63/8465 | 6.55e-03 | 2.64e-02 | 1.62e-02 | 23 |
| hsa041445 | Colorectum | MSS | Endocytosis | 102/1875 | 251/8465 | 1.85e-11 | 4.43e-10 | 2.71e-10 | 102 |
| hsa032501 | Colorectum | MSS | Viral life cycle - HIV-1 | 23/1875 | 63/8465 | 6.55e-03 | 2.64e-02 | 1.62e-02 | 23 |
| hsa041446 | Colorectum | FAP | Endocytosis | 78/1404 | 251/8465 | 6.20e-09 | 2.96e-07 | 1.80e-07 | 78 |
| hsa041447 | Colorectum | FAP | Endocytosis | 78/1404 | 251/8465 | 6.20e-09 | 2.96e-07 | 1.80e-07 | 78 |
| hsa041448 | Colorectum | CRC | Endocytosis | 65/1091 | 251/8465 | 1.27e-08 | 1.06e-06 | 7.19e-07 | 65 |
| hsa041449 | Colorectum | CRC | Endocytosis | 65/1091 | 251/8465 | 1.27e-08 | 1.06e-06 | 7.19e-07 | 65 |
| hsa04144210 | Esophagus | ESCC | Endocytosis | 186/4205 | 251/8465 | 9.74e-16 | 4.66e-14 | 2.39e-14 | 186 |
| hsa032509 | Esophagus | ESCC | Viral life cycle - HIV-1 | 54/4205 | 63/8465 | 2.01e-09 | 2.17e-08 | 1.11e-08 | 54 |
| hsa0414437 | Esophagus | ESCC | Endocytosis | 186/4205 | 251/8465 | 9.74e-16 | 4.66e-14 | 2.39e-14 | 186 |
| hsa0325014 | Esophagus | ESCC | Viral life cycle - HIV-1 | 54/4205 | 63/8465 | 2.01e-09 | 2.17e-08 | 1.11e-08 | 54 |
| hsa0414412 | Liver | Cirrhotic | Endocytosis | 119/2530 | 251/8465 | 2.33e-09 | 4.56e-08 | 2.81e-08 | 119 |
| hsa0414413 | Liver | Cirrhotic | Endocytosis | 119/2530 | 251/8465 | 2.33e-09 | 4.56e-08 | 2.81e-08 | 119 |
| hsa0414422 | Liver | HCC | Endocytosis | 178/4020 | 251/8465 | 2.03e-14 | 5.22e-13 | 2.91e-13 | 178 |
| hsa032502 | Liver | HCC | Viral life cycle - HIV-1 | 46/4020 | 63/8465 | 3.25e-05 | 1.88e-04 | 1.04e-04 | 46 |
| Page: 1 2 |
Top |
Cell-cell communication analysis |
| Identification of potential cell-cell interactions between two cell types and their ligand-receptor pairs for different disease states |
| Ligand | Receptor | LRpair | Pathway | Tissue | Disease Stage |
| Page: 1 |
Top |
Single-cell gene regulatory network inference analysis |
| Find out the significant the regulons (TFs) and the target genes of each regulon across cell types for different disease states |
| TF | Cell Type | Tissue | Disease Stage | Target Gene | RSS | Regulon Activity |
| ∗The dot plots of a searched regulon are shown for all cell subpopulations in each disease state of each tissue based on the regulon specific score inferred using pySCENIC and by calculating the average expression. |
| Page: 1 |
Top |
Somatic mutation of malignant transformation related genes |
| Annotation of somatic variants for genes involved in malignant transformation |
| Hugo Symbol | Variant Class | Variant Classification | dbSNP RS | HGVSc | HGVSp | HGVSp Short | SWISSPROT | BIOTYPE | SIFT | PolyPhen | Tumor Sample Barcode | Tissue | Histology | Sex | Age | Stage | Therapy Types | Drugs | Outcome |
| TSG101 | SNV | Missense_Mutation | c.340N>G | p.Leu114Val | p.L114V | Q99816 | protein_coding | deleterious(0) | possibly_damaging(0.755) | TCGA-A2-A0YK-01 | Breast | breast invasive carcinoma | Female | <65 | I/II | Chemotherapy | cytoxan | SD | |
| TSG101 | SNV | Missense_Mutation | c.391N>G | p.Met131Val | p.M131V | Q99816 | protein_coding | deleterious(0) | benign(0.225) | TCGA-A8-A06R-01 | Breast | breast invasive carcinoma | Female | >=65 | I/II | Chemotherapy | 5-fluorouracil | CR | |
| TSG101 | SNV | Missense_Mutation | c.1069N>A | p.Asp357Asn | p.D357N | Q99816 | protein_coding | tolerated(0.06) | probably_damaging(0.943) | TCGA-A8-A07W-01 | Breast | breast invasive carcinoma | Female | >=65 | III/IV | Hormone Therapy | exemestane | SD | |
| TSG101 | deletion | Frame_Shift_Del | novel | c.41delN | p.Lys14SerfsTer7 | p.K14Sfs*7 | Q99816 | protein_coding | TCGA-D8-A27V-01 | Breast | breast invasive carcinoma | Female | <65 | I/II | Hormone Therapy | tamoxiphen | SD | ||
| TSG101 | SNV | Missense_Mutation | novel | c.784N>A | p.Asp262Asn | p.D262N | Q99816 | protein_coding | deleterious(0) | possibly_damaging(0.632) | TCGA-VS-A8EL-01 | Cervix | cervical & endocervical cancer | Female | <65 | I/II | Chemotherapy | cisplatin | CR |
| TSG101 | SNV | Missense_Mutation | c.492G>A | p.Met164Ile | p.M164I | Q99816 | protein_coding | tolerated(0.09) | benign(0.001) | TCGA-A6-5661-01 | Colorectum | colon adenocarcinoma | Female | >=65 | I/II | Unknown | Unknown | SD | |
| TSG101 | insertion | Frame_Shift_Ins | novel | c.913dupA | p.Met305AsnfsTer6 | p.M305Nfs*6 | Q99816 | protein_coding | TCGA-AA-3811-01 | Colorectum | colon adenocarcinoma | Female | >=65 | III/IV | Unknown | Unknown | PD | ||
| TSG101 | insertion | Frame_Shift_Ins | novel | c.860_861insA | p.Asn287LysfsTer10 | p.N287Kfs*10 | Q99816 | protein_coding | TCGA-AA-3972-01 | Colorectum | colon adenocarcinoma | Male | >=65 | III/IV | Chemotherapy | capecitabine | PD | ||
| TSG101 | SNV | Missense_Mutation | novel | c.62N>A | p.Thr21Asn | p.T21N | Q99816 | protein_coding | deleterious(0) | possibly_damaging(0.676) | TCGA-A5-A0G2-01 | Endometrium | uterine corpus endometrioid carcinoma | Female | <65 | III/IV | Unknown | Unknown | SD |
| TSG101 | SNV | Missense_Mutation | novel | c.1151N>A | p.Ala384Asp | p.A384D | Q99816 | protein_coding | deleterious(0) | probably_damaging(0.995) | TCGA-A5-A1OF-01 | Endometrium | uterine corpus endometrioid carcinoma | Female | <65 | I/II | Unknown | Unknown | SD |
| Page: 1 2 3 4 |
Top |
Related drugs of malignant transformation related genes |
| Identification of chemicals and drugs interact with genes involved in malignant transfromation |
| (DGIdb 4.0) |
| Entrez ID | Symbol | Category | Interaction Types | Drug Claim Name | Drug Name | PMIDs |
| 7251 | TSG101 | TUMOR SUPPRESSOR, DRUGGABLE GENOME, ENZYME | FLUORANTHEN-3-YLAMINE | CHEMBL103583 | ||
| 7251 | TSG101 | TUMOR SUPPRESSOR, DRUGGABLE GENOME, ENZYME | NSC-66209 | CHEMBL175266 | ||
| 7251 | TSG101 | TUMOR SUPPRESSOR, DRUGGABLE GENOME, ENZYME | NSC-228155 | CHEMBL505670 | ||
| 7251 | TSG101 | TUMOR SUPPRESSOR, DRUGGABLE GENOME, ENZYME | TOPOTECAN HYDROCHLORIDE | TOPOTECAN HYDROCHLORIDE | ||
| 7251 | TSG101 | TUMOR SUPPRESSOR, DRUGGABLE GENOME, ENZYME | GNF-PF-4227 | CHEMBL585654 | ||
| 7251 | TSG101 | TUMOR SUPPRESSOR, DRUGGABLE GENOME, ENZYME | DIPYRIDAMOLE | DIPYRIDAMOLE | ||
| 7251 | TSG101 | TUMOR SUPPRESSOR, DRUGGABLE GENOME, ENZYME | 2,4-DIHYDROXYBENZOPHENONE | 2,4-DIHYDROXYBENZOPHENONE | ||
| 7251 | TSG101 | TUMOR SUPPRESSOR, DRUGGABLE GENOME, ENZYME | DAUNORUBICIN HYDROCHLORIDE | DAUNORUBICIN HYDROCHLORIDE | ||
| 7251 | TSG101 | TUMOR SUPPRESSOR, DRUGGABLE GENOME, ENZYME | PYRONIN Y | PYRONIN Y | ||
| 7251 | TSG101 | TUMOR SUPPRESSOR, DRUGGABLE GENOME, ENZYME | FGI-101-1A6 | FGI-101-1A6 |
| Page: 1 2 |

Copyright 2023-Present -The University of Texas Health Science Center at Houston |