
|
|||||
|
 | |
| |
| |
| |
| |
| |
|
Gene: TRIM41 |
Gene summary for TRIM41 |
| Gene information | Species | Human | Gene symbol | TRIM41 | Gene ID | 90933 |
| Gene name | tripartite motif containing 41 | |
| Gene Alias | RINCK | |
| Cytomap | 5q35.3 | |
| Gene Type | protein-coding | GO ID | GO:0002237 | UniProtAcc | Q8WV44 |
Top |
Malignant transformation analysis |
| Identification of the aberrant gene expression in precancerous and cancerous lesions by comparing the gene expression of stem-like cells in diseased tissues with normal stem cells |
| Entrez ID | Symbol | Replicates | Species | Organ | Tissue | Adj P-value | Log2FC | Malignancy |
| 90933 | TRIM41 | LZE8T | Human | Esophagus | ESCC | 1.38e-02 | 1.78e-01 | 0.067 |
| 90933 | TRIM41 | LZE24T | Human | Esophagus | ESCC | 2.03e-05 | 2.03e-01 | 0.0596 |
| 90933 | TRIM41 | P1T-E | Human | Esophagus | ESCC | 3.48e-03 | 2.00e-01 | 0.0875 |
| 90933 | TRIM41 | P2T-E | Human | Esophagus | ESCC | 2.89e-12 | 1.29e-01 | 0.1177 |
| 90933 | TRIM41 | P4T-E | Human | Esophagus | ESCC | 3.29e-04 | 1.34e-01 | 0.1323 |
| 90933 | TRIM41 | P5T-E | Human | Esophagus | ESCC | 2.73e-09 | 1.43e-01 | 0.1327 |
| 90933 | TRIM41 | P10T-E | Human | Esophagus | ESCC | 4.30e-05 | 9.23e-02 | 0.116 |
| 90933 | TRIM41 | P11T-E | Human | Esophagus | ESCC | 4.57e-03 | 1.70e-01 | 0.1426 |
| 90933 | TRIM41 | P12T-E | Human | Esophagus | ESCC | 1.16e-14 | 1.33e-01 | 0.1122 |
| 90933 | TRIM41 | P15T-E | Human | Esophagus | ESCC | 1.29e-08 | 2.08e-01 | 0.1149 |
| 90933 | TRIM41 | P16T-E | Human | Esophagus | ESCC | 9.49e-05 | 9.85e-02 | 0.1153 |
| 90933 | TRIM41 | P17T-E | Human | Esophagus | ESCC | 1.27e-05 | 2.31e-01 | 0.1278 |
| 90933 | TRIM41 | P20T-E | Human | Esophagus | ESCC | 2.96e-05 | 1.30e-01 | 0.1124 |
| 90933 | TRIM41 | P21T-E | Human | Esophagus | ESCC | 4.61e-09 | 1.43e-01 | 0.1617 |
| 90933 | TRIM41 | P22T-E | Human | Esophagus | ESCC | 2.21e-16 | 2.87e-01 | 0.1236 |
| 90933 | TRIM41 | P23T-E | Human | Esophagus | ESCC | 1.11e-02 | 1.03e-01 | 0.108 |
| 90933 | TRIM41 | P26T-E | Human | Esophagus | ESCC | 8.79e-04 | 9.67e-02 | 0.1276 |
| 90933 | TRIM41 | P27T-E | Human | Esophagus | ESCC | 1.12e-10 | 2.27e-01 | 0.1055 |
| 90933 | TRIM41 | P28T-E | Human | Esophagus | ESCC | 7.00e-20 | 3.85e-01 | 0.1149 |
| 90933 | TRIM41 | P30T-E | Human | Esophagus | ESCC | 2.56e-09 | 3.08e-01 | 0.137 |
| Page: 1 2 3 4 |
| Tissue | Expression Dynamics | Abbreviation |
| Esophagus | 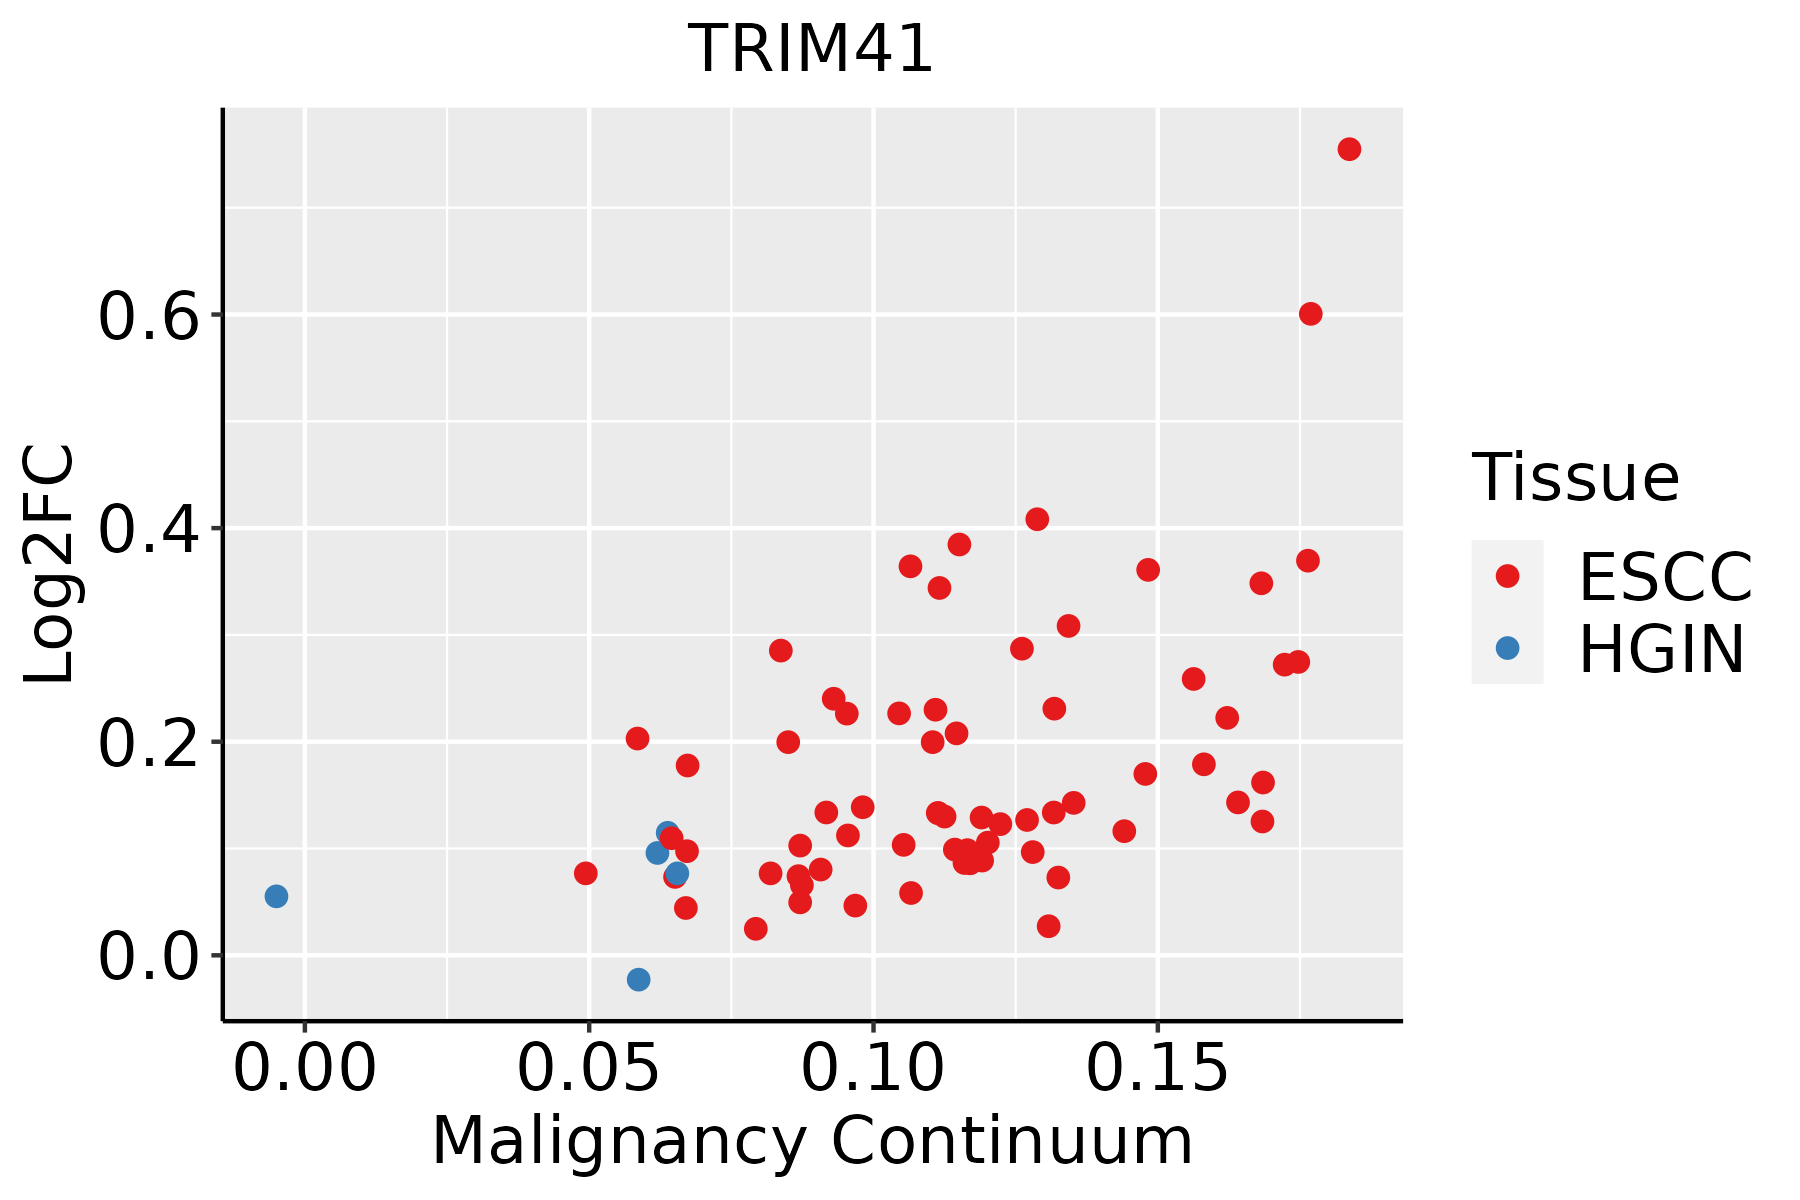 | ESCC: Esophageal squamous cell carcinoma |
| HGIN: High-grade intraepithelial neoplasias | ||
| LGIN: Low-grade intraepithelial neoplasias | ||
| Liver | 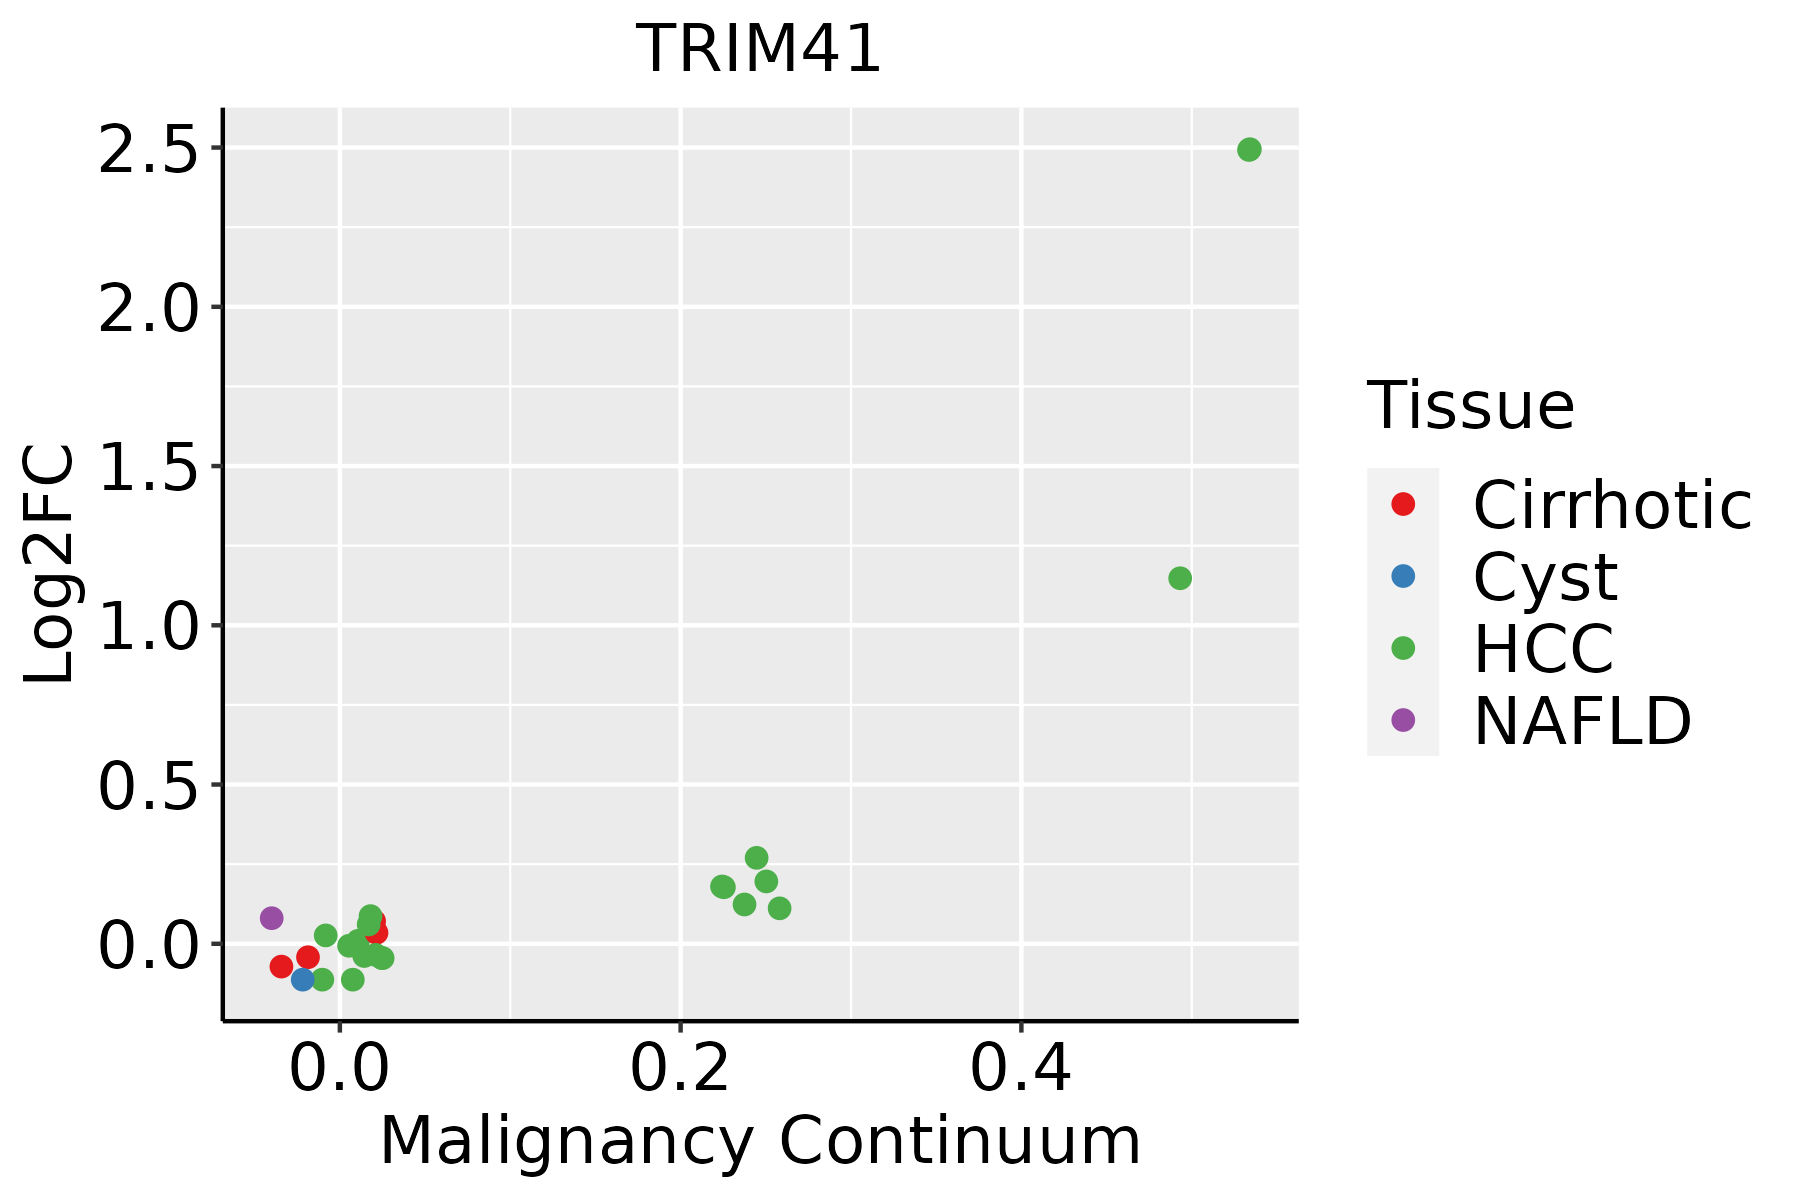 | HCC: Hepatocellular carcinoma |
| NAFLD: Non-alcoholic fatty liver disease | ||
| Oral Cavity | 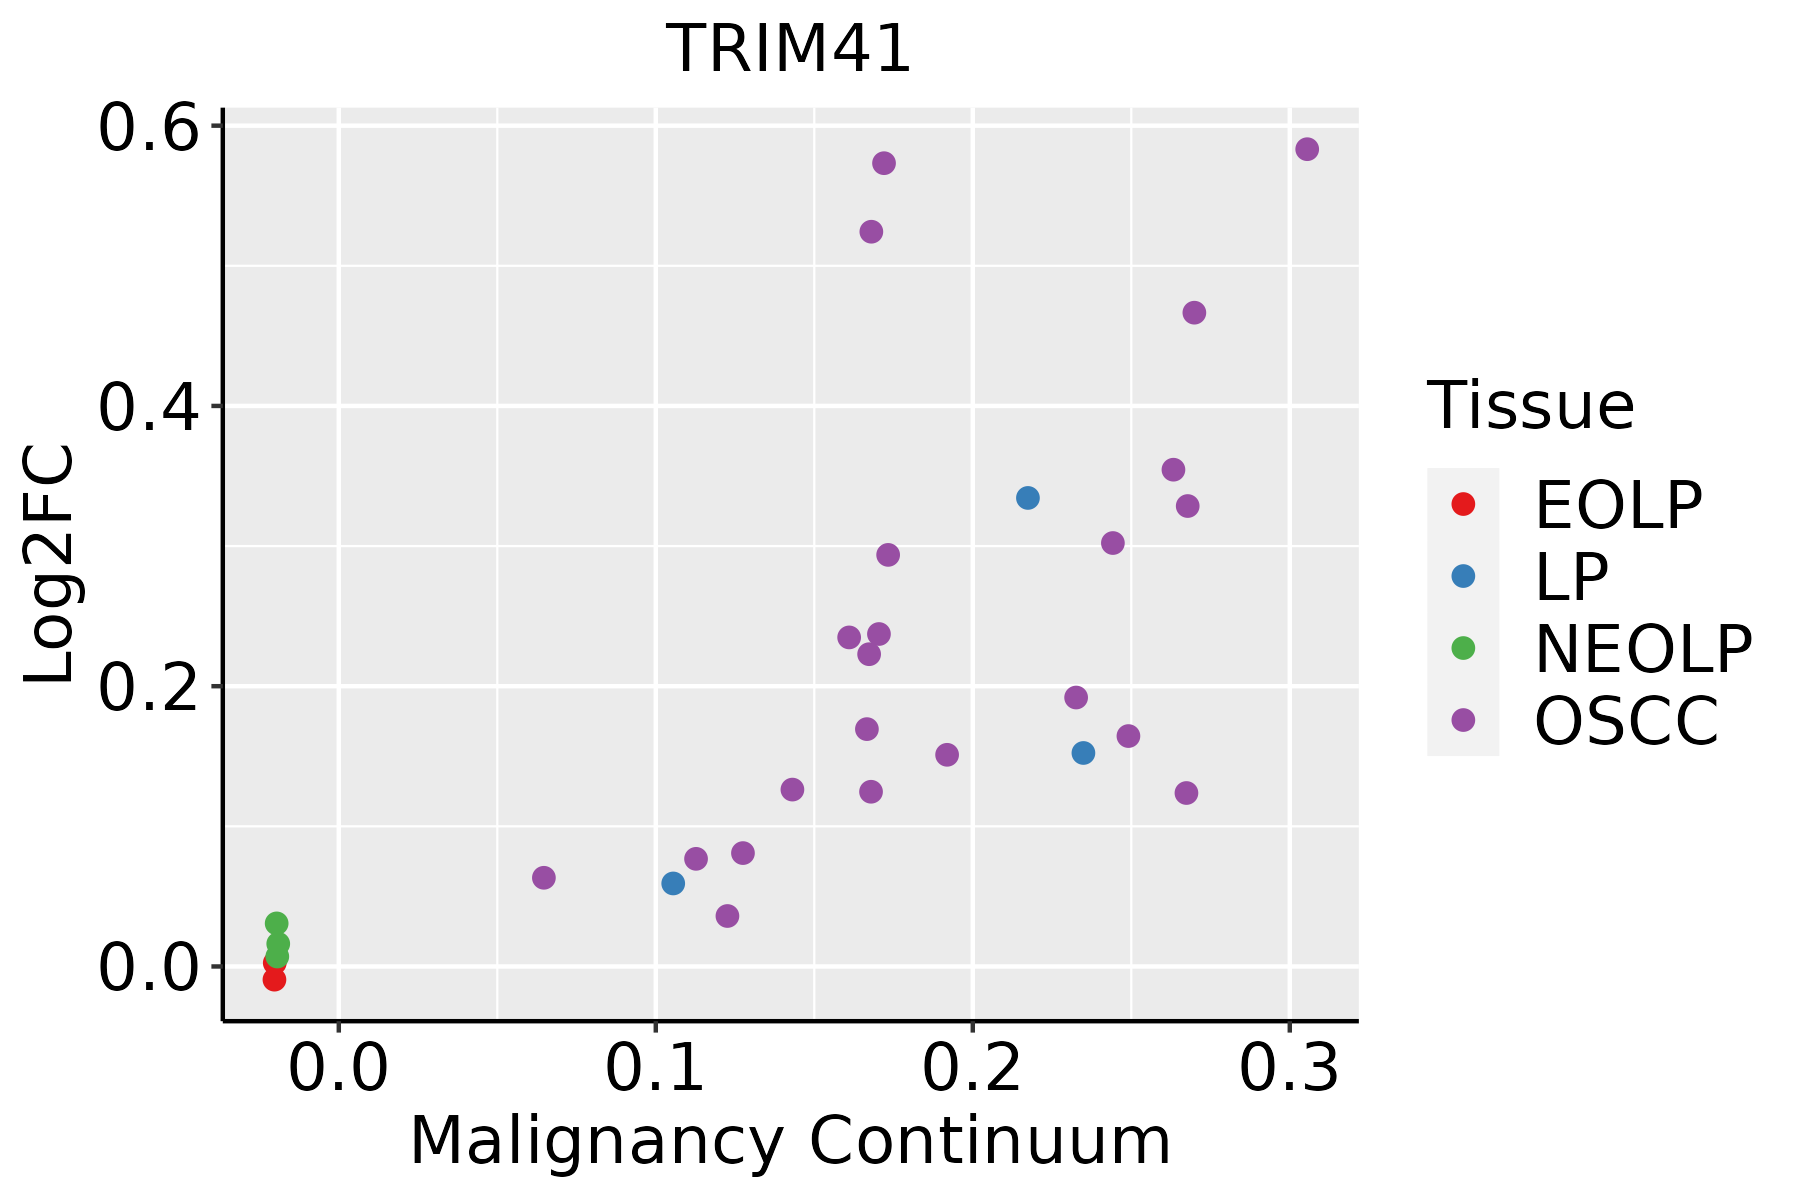 | EOLP: Erosive Oral lichen planus |
| LP: leukoplakia | ||
| NEOLP: Non-erosive oral lichen planus | ||
| OSCC: Oral squamous cell carcinoma |
| ∗log2FC in expression of this searched gene in stem-like cells from each diseased tissue sample relative to stem-like cells in normal samples in each tissue plotted against the malignancy continuum. Samples are colored based on if they are from different disease stage. |
Top |
Malignant transformation related pathway analysis |
| Find out the enriched GO biological processes and KEGG pathways involved in transition from healthy to precancer to cancer |
| Tissue | Disease Stage | Enriched GO biological Processes |
| Colorectum | AD |  |
| Colorectum | SER |  |
| Colorectum | MSS |  |
| Colorectum | MSI-H |  |
| Colorectum | FAP |  |
| ∗Top 15 enriched GO BP terms are showed in the bar plot of each disease state in each tissue. Each row represents a significant GO biological process which is colored according to the -log10(p.adjust). |
| Page: 1 2 3 4 5 6 7 8 9 |
| GO ID | Tissue | Disease Stage | Description | Gene Ratio | Bg Ratio | pvalue | p.adjust | Count |
| GO:00510917 | Oral cavity | OSCC | positive regulation of DNA-binding transcription factor activity | 134/7305 | 260/18723 | 2.52e-05 | 2.35e-04 | 134 |
| GO:007122210 | Oral cavity | OSCC | cellular response to lipopolysaccharide | 110/7305 | 209/18723 | 4.15e-05 | 3.60e-04 | 110 |
| GO:007121910 | Oral cavity | OSCC | cellular response to molecule of bacterial origin | 112/7305 | 221/18723 | 2.64e-04 | 1.69e-03 | 112 |
| GO:005109015 | Oral cavity | LP | regulation of DNA-binding transcription factor activity | 147/4623 | 440/18723 | 2.00e-05 | 3.35e-04 | 147 |
| GO:190165317 | Oral cavity | LP | cellular response to peptide | 122/4623 | 359/18723 | 4.22e-05 | 6.10e-04 | 122 |
| GO:003249618 | Oral cavity | LP | response to lipopolysaccharide | 112/4623 | 343/18723 | 4.90e-04 | 4.60e-03 | 112 |
| GO:007121616 | Oral cavity | LP | cellular response to biotic stimulus | 84/4623 | 246/18723 | 5.17e-04 | 4.82e-03 | 84 |
| GO:005109114 | Oral cavity | LP | positive regulation of DNA-binding transcription factor activity | 86/4623 | 260/18723 | 1.35e-03 | 1.08e-02 | 86 |
| GO:000223718 | Oral cavity | LP | response to molecule of bacterial origin | 115/4623 | 363/18723 | 1.42e-03 | 1.13e-02 | 115 |
| GO:007122214 | Oral cavity | LP | cellular response to lipopolysaccharide | 69/4623 | 209/18723 | 3.99e-03 | 2.59e-02 | 69 |
| Page: 1 2 |
| Pathway ID | Tissue | Disease Stage | Description | Gene Ratio | Bg Ratio | pvalue | p.adjust | qvalue | Count |
| Page: 1 |
Top |
Cell-cell communication analysis |
| Identification of potential cell-cell interactions between two cell types and their ligand-receptor pairs for different disease states |
| Ligand | Receptor | LRpair | Pathway | Tissue | Disease Stage |
| Page: 1 |
Top |
Single-cell gene regulatory network inference analysis |
| Find out the significant the regulons (TFs) and the target genes of each regulon across cell types for different disease states |
| TF | Cell Type | Tissue | Disease Stage | Target Gene | RSS | Regulon Activity |
| ∗The dot plots of a searched regulon are shown for all cell subpopulations in each disease state of each tissue based on the regulon specific score inferred using pySCENIC and by calculating the average expression. |
| Page: 1 |
Top |
Somatic mutation of malignant transformation related genes |
| Annotation of somatic variants for genes involved in malignant transformation |
| Hugo Symbol | Variant Class | Variant Classification | dbSNP RS | HGVSc | HGVSp | HGVSp Short | SWISSPROT | BIOTYPE | SIFT | PolyPhen | Tumor Sample Barcode | Tissue | Histology | Sex | Age | Stage | Therapy Types | Drugs | Outcome |
| TRIM41 | SNV | Missense_Mutation | c.358N>G | p.Met120Val | p.M120V | Q8WV44 | protein_coding | tolerated(0.58) | benign(0.176) | TCGA-A1-A0SI-01 | Breast | breast invasive carcinoma | Female | <65 | I/II | Unknown | Unknown | SD | |
| TRIM41 | SNV | Missense_Mutation | c.85N>T | p.Asp29Tyr | p.D29Y | Q8WV44 | protein_coding | deleterious(0) | probably_damaging(0.992) | TCGA-AN-A0FZ-01 | Breast | breast invasive carcinoma | Female | <65 | III/IV | Unknown | Unknown | SD | |
| TRIM41 | SNV | Missense_Mutation | novel | c.353N>G | p.Asp118Gly | p.D118G | Q8WV44 | protein_coding | deleterious(0.03) | benign(0) | TCGA-BH-A0W7-01 | Breast | breast invasive carcinoma | Female | <65 | I/II | Chemotherapy | taxotere | CR |
| TRIM41 | SNV | Missense_Mutation | novel | c.878N>G | p.Ala293Gly | p.A293G | Q8WV44 | protein_coding | deleterious(0.01) | benign(0.444) | TCGA-GI-A2C9-01 | Breast | breast invasive carcinoma | Female | <65 | I/II | Unspecific | SD | |
| TRIM41 | SNV | Missense_Mutation | novel | c.749N>C | p.Arg250Pro | p.R250P | Q8WV44 | protein_coding | deleterious(0.04) | probably_damaging(0.994) | TCGA-LL-A73Y-01 | Breast | breast invasive carcinoma | Female | >=65 | I/II | Chemotherapy | taxotere | SD |
| TRIM41 | insertion | Frame_Shift_Ins | novel | c.169_170insGCACTTCAGCCTGGAAACAGAGCAAGACTCC | p.Asp57GlyfsTer12 | p.D57Gfs*12 | Q8WV44 | protein_coding | TCGA-A2-A04V-01 | Breast | breast invasive carcinoma | Female | <65 | I/II | Chemotherapy | cytoxan | PD | ||
| TRIM41 | deletion | Frame_Shift_Del | rs754807680 | c.1357delG | p.Val453SerfsTer38 | p.V453Sfs*38 | Q8WV44 | protein_coding | TCGA-AN-A0AK-01 | Breast | breast invasive carcinoma | Female | >=65 | I/II | Unknown | Unknown | SD | ||
| TRIM41 | SNV | Missense_Mutation | novel | c.328A>G | p.Ser110Gly | p.S110G | Q8WV44 | protein_coding | tolerated(0.5) | benign(0) | TCGA-2W-A8YY-01 | Cervix | cervical & endocervical cancer | Female | <65 | I/II | Chemotherapy | cisplatin | CR |
| TRIM41 | SNV | Missense_Mutation | c.888G>C | p.Glu296Asp | p.E296D | Q8WV44 | protein_coding | tolerated(0.13) | possibly_damaging(0.628) | TCGA-EK-A2RJ-01 | Cervix | cervical & endocervical cancer | Female | <65 | I/II | Unknown | Unknown | SD | |
| TRIM41 | SNV | Missense_Mutation | c.1171N>A | p.Glu391Lys | p.E391K | Q8WV44 | protein_coding | tolerated(0.62) | benign(0) | TCGA-FU-A3HZ-01 | Cervix | cervical & endocervical cancer | Female | <65 | I/II | Chemotherapy | cisplatin | CR |
| Page: 1 2 3 4 5 6 7 |
Top |
Related drugs of malignant transformation related genes |
| Identification of chemicals and drugs interact with genes involved in malignant transfromation |
| (DGIdb 4.0) |
| Entrez ID | Symbol | Category | Interaction Types | Drug Claim Name | Drug Name | PMIDs |
| Page: 1 |

Copyright 2023-Present -The University of Texas Health Science Center at Houston |