
|
|||||
|
 | |
| |
| |
| |
| |
| |
|
Gene: TRIM31 |
Gene summary for TRIM31 |
| Gene information | Species | Human | Gene symbol | TRIM31 | Gene ID | 11074 |
| Gene name | tripartite motif containing 31 | |
| Gene Alias | C6orf13 | |
| Cytomap | 6p22.1 | |
| Gene Type | protein-coding | GO ID | GO:0002376 | UniProtAcc | Q2L6J1 |
Top |
Malignant transformation analysis |
| Identification of the aberrant gene expression in precancerous and cancerous lesions by comparing the gene expression of stem-like cells in diseased tissues with normal stem cells |
| Entrez ID | Symbol | Replicates | Species | Organ | Tissue | Adj P-value | Log2FC | Malignancy |
| 11074 | TRIM31 | HTA11_2487_2000001011 | Human | Colorectum | SER | 2.67e-08 | 4.70e-01 | -0.1808 |
| 11074 | TRIM31 | HTA11_1938_2000001011 | Human | Colorectum | AD | 2.25e-21 | 6.77e-01 | -0.0811 |
| 11074 | TRIM31 | HTA11_78_2000001011 | Human | Colorectum | AD | 2.22e-06 | 2.84e-01 | -0.1088 |
| 11074 | TRIM31 | HTA11_347_2000001011 | Human | Colorectum | AD | 3.11e-02 | 2.17e-01 | -0.1954 |
| 11074 | TRIM31 | HTA11_411_2000001011 | Human | Colorectum | SER | 1.07e-03 | 8.64e-01 | -0.2602 |
| 11074 | TRIM31 | HTA11_2112_2000001011 | Human | Colorectum | SER | 4.98e-04 | 9.86e-01 | -0.2196 |
| 11074 | TRIM31 | HTA11_3361_2000001011 | Human | Colorectum | AD | 1.63e-03 | 3.25e-01 | -0.1207 |
| 11074 | TRIM31 | HTA11_696_2000001011 | Human | Colorectum | AD | 8.62e-04 | 1.36e-01 | -0.1464 |
| 11074 | TRIM31 | HTA11_866_2000001011 | Human | Colorectum | AD | 4.07e-04 | 1.70e-01 | -0.1001 |
| 11074 | TRIM31 | HTA11_1391_2000001011 | Human | Colorectum | AD | 1.14e-12 | 3.95e-01 | -0.059 |
| 11074 | TRIM31 | HTA11_5212_2000001011 | Human | Colorectum | AD | 2.69e-02 | 3.28e-01 | -0.2061 |
| 11074 | TRIM31 | HTA11_6818_2000001011 | Human | Colorectum | AD | 7.26e-05 | 3.12e-01 | 0.0112 |
| 11074 | TRIM31 | HTA11_6818_2000001021 | Human | Colorectum | AD | 1.71e-03 | 1.80e-01 | 0.0588 |
| 11074 | TRIM31 | HTA11_99999965104_69814 | Human | Colorectum | MSS | 1.02e-07 | 2.95e-01 | 0.281 |
| 11074 | TRIM31 | HTA11_99999971662_82457 | Human | Colorectum | MSS | 4.07e-04 | 1.01e-01 | 0.3859 |
| 11074 | TRIM31 | HTA11_99999973899_84307 | Human | Colorectum | MSS | 3.00e-08 | 3.72e-01 | 0.2585 |
| 11074 | TRIM31 | A002-C-203 | Human | Colorectum | FAP | 9.55e-09 | 2.83e-01 | 0.2786 |
| 11074 | TRIM31 | A001-C-108 | Human | Colorectum | FAP | 8.13e-03 | 2.04e-01 | -0.0272 |
| 11074 | TRIM31 | A002-C-021 | Human | Colorectum | FAP | 9.04e-05 | 1.58e-01 | 0.1171 |
| 11074 | TRIM31 | A002-C-205 | Human | Colorectum | FAP | 6.47e-03 | 3.44e-01 | -0.1236 |
| Page: 1 2 3 4 |
| Tissue | Expression Dynamics | Abbreviation |
| Colorectum (GSE201348) |  | FAP: Familial adenomatous polyposis |
| CRC: Colorectal cancer | ||
| Colorectum (HTA11) |  | AD: Adenomas |
| SER: Sessile serrated lesions | ||
| MSI-H: Microsatellite-high colorectal cancer | ||
| MSS: Microsatellite stable colorectal cancer | ||
| Esophagus |  | ESCC: Esophageal squamous cell carcinoma |
| HGIN: High-grade intraepithelial neoplasias | ||
| LGIN: Low-grade intraepithelial neoplasias | ||
| GC | 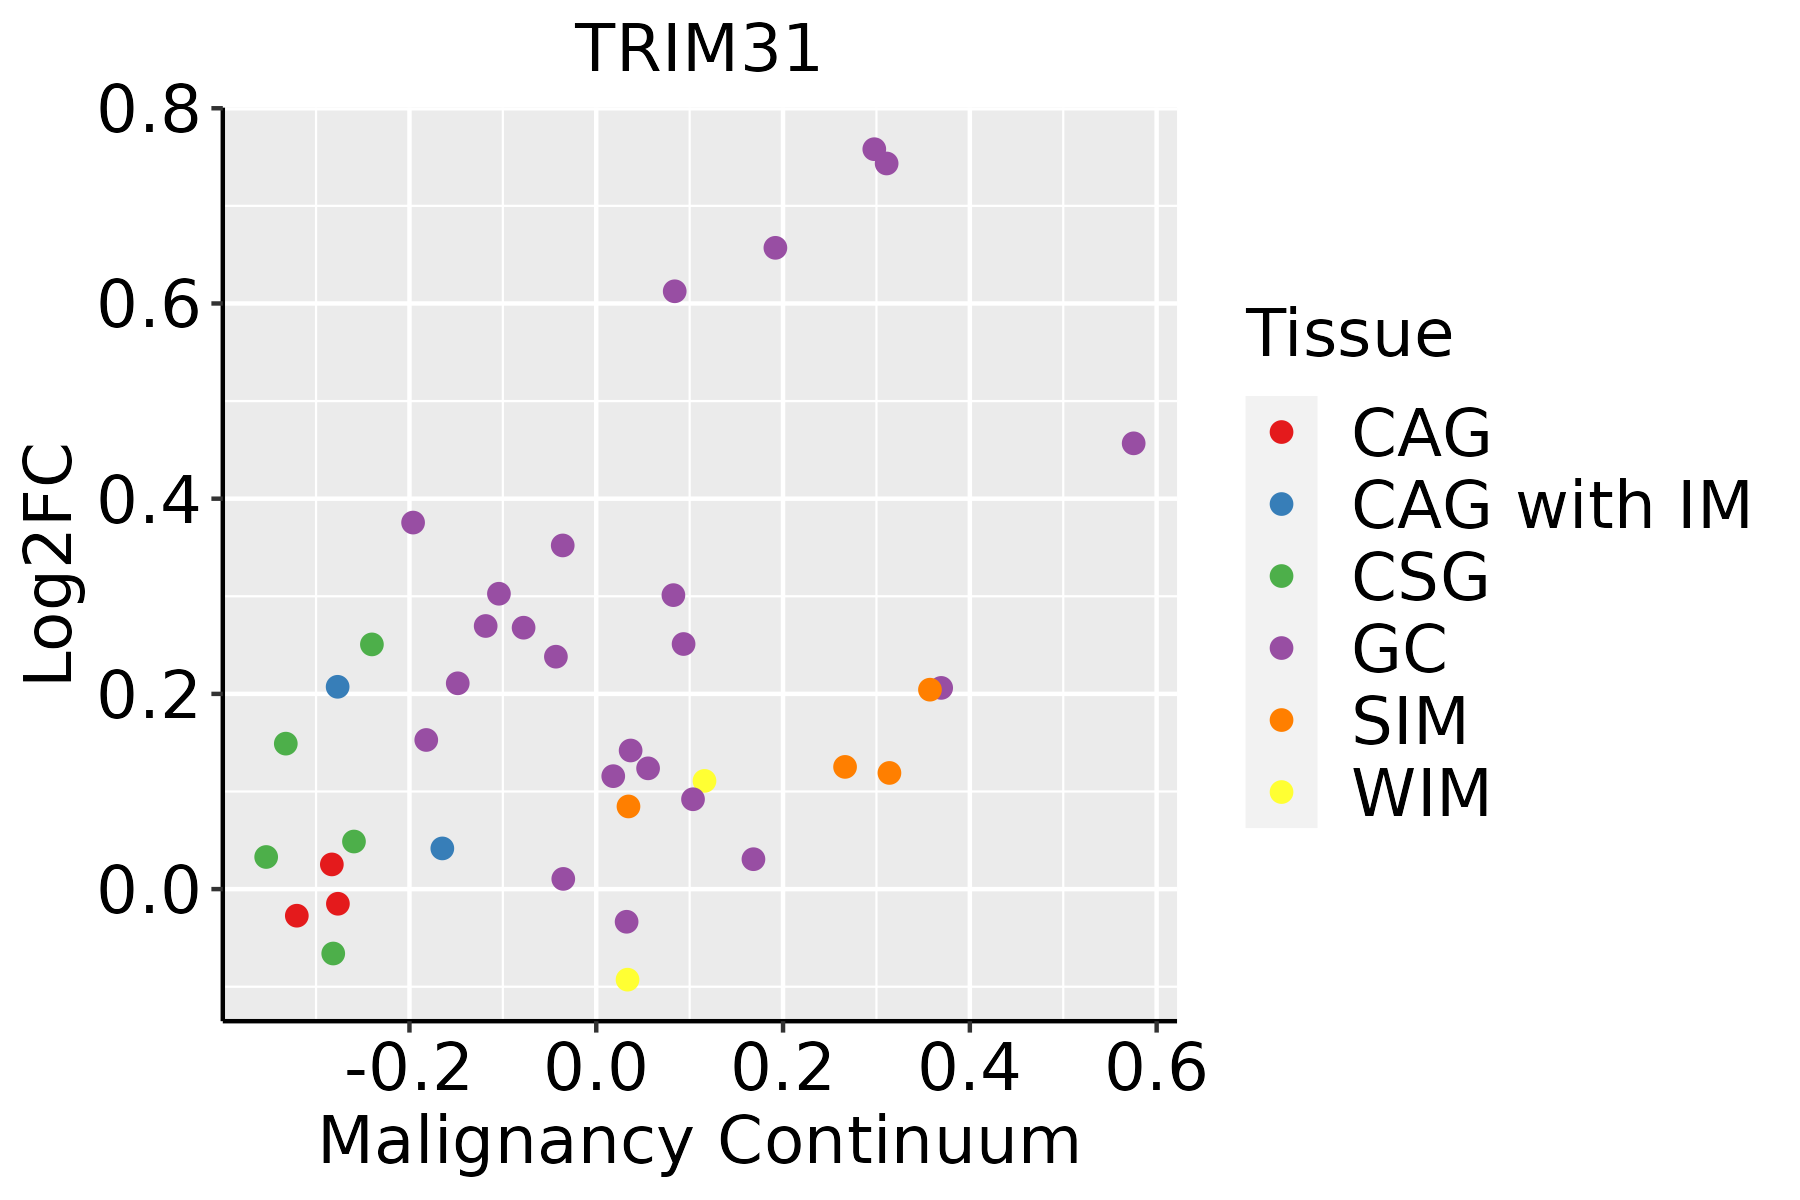 | CAG: Chronic atrophic gastritis |
| CAG with IM: Chronic atrophic gastritis with intestinal metaplasia | ||
| CSG: Chronic superficial gastritis | ||
| GC: Gastric cancer | ||
| SIM: Severe intestinal metaplasia | ||
| WIM: Wild intestinal metaplasia | ||
| Liver | 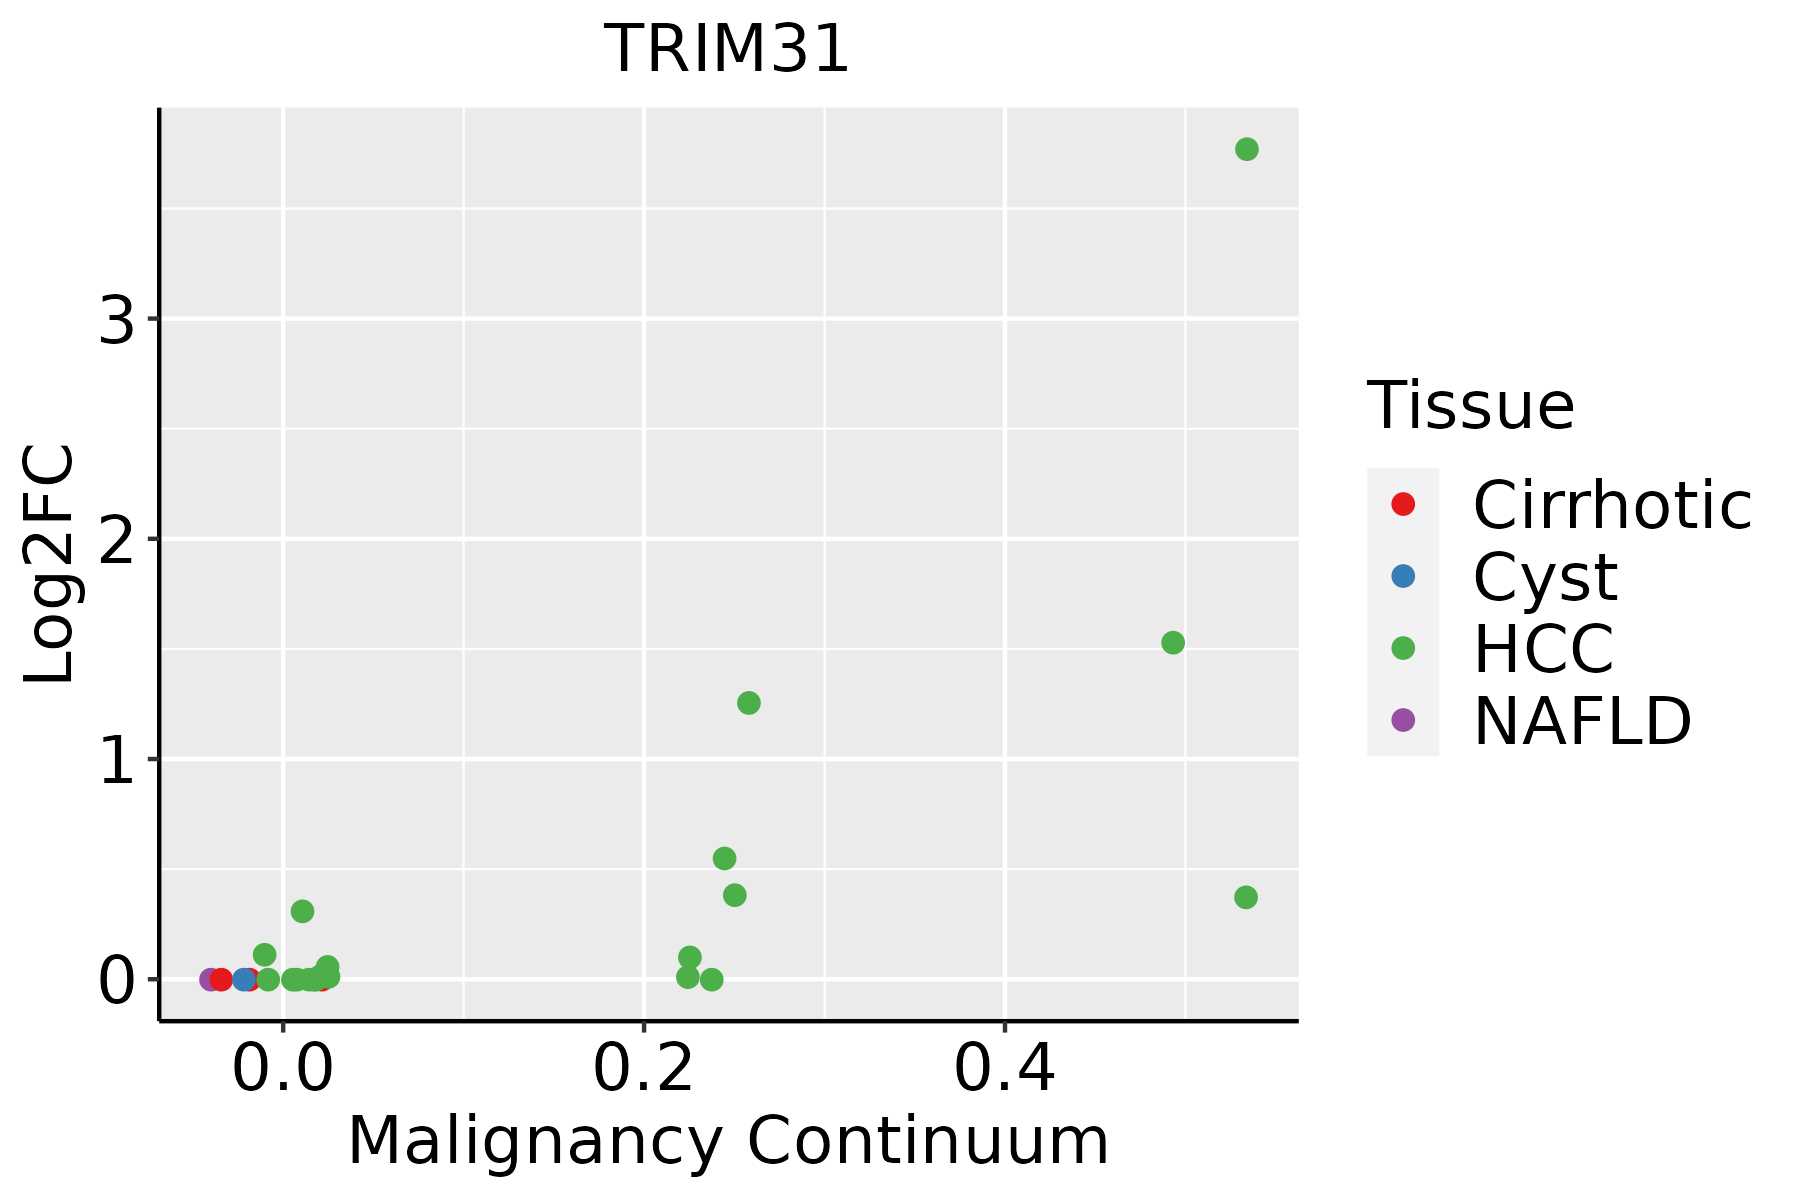 | HCC: Hepatocellular carcinoma |
| NAFLD: Non-alcoholic fatty liver disease |
| ∗log2FC in expression of this searched gene in stem-like cells from each diseased tissue sample relative to stem-like cells in normal samples in each tissue plotted against the malignancy continuum. Samples are colored based on if they are from different disease stage. |
Top |
Malignant transformation related pathway analysis |
| Find out the enriched GO biological processes and KEGG pathways involved in transition from healthy to precancer to cancer |
| Tissue | Disease Stage | Enriched GO biological Processes |
| Colorectum | AD |  |
| Colorectum | SER |  |
| Colorectum | MSS |  |
| Colorectum | MSI-H |  |
| Colorectum | FAP |  |
| ∗Top 15 enriched GO BP terms are showed in the bar plot of each disease state in each tissue. Each row represents a significant GO biological process which is colored according to the -log10(p.adjust). |
| Page: 1 2 3 4 5 6 7 8 9 |
| GO ID | Tissue | Disease Stage | Description | Gene Ratio | Bg Ratio | pvalue | p.adjust | Count |
| GO:00507921 | Colorectum | SER | regulation of viral process | 43/2897 | 164/18723 | 2.57e-04 | 4.31e-03 | 43 |
| GO:00190761 | Colorectum | SER | viral release from host cell | 14/2897 | 34/18723 | 2.81e-04 | 4.63e-03 | 14 |
| GO:00358901 | Colorectum | SER | exit from host | 14/2897 | 34/18723 | 2.81e-04 | 4.63e-03 | 14 |
| GO:00358911 | Colorectum | SER | exit from host cell | 14/2897 | 34/18723 | 2.81e-04 | 4.63e-03 | 14 |
| GO:19039001 | Colorectum | SER | regulation of viral life cycle | 38/2897 | 148/18723 | 8.76e-04 | 1.06e-02 | 38 |
| GO:00467181 | Colorectum | SER | viral entry into host cell | 36/2897 | 144/18723 | 1.95e-03 | 1.96e-02 | 36 |
| GO:1902186 | Colorectum | SER | regulation of viral release from host cell | 10/2897 | 26/18723 | 3.78e-03 | 3.13e-02 | 10 |
| GO:00444091 | Colorectum | SER | entry into host | 36/2897 | 151/18723 | 4.55e-03 | 3.61e-02 | 36 |
| GO:0043903 | Colorectum | SER | regulation of biological process involved in symbiotic interaction | 20/2897 | 72/18723 | 5.36e-03 | 4.03e-02 | 20 |
| GO:00510911 | Colorectum | SER | positive regulation of DNA-binding transcription factor activity | 56/2897 | 260/18723 | 5.55e-03 | 4.09e-02 | 56 |
| GO:00160322 | Colorectum | MSS | viral process | 157/3467 | 415/18723 | 7.94e-21 | 6.19e-18 | 157 |
| GO:00190582 | Colorectum | MSS | viral life cycle | 111/3467 | 317/18723 | 1.65e-12 | 2.95e-10 | 111 |
| GO:00444032 | Colorectum | MSS | biological process involved in symbiotic interaction | 93/3467 | 290/18723 | 1.72e-08 | 9.85e-07 | 93 |
| GO:00190802 | Colorectum | MSS | viral gene expression | 41/3467 | 94/18723 | 1.74e-08 | 9.85e-07 | 41 |
| GO:00517012 | Colorectum | MSS | biological process involved in interaction with host | 67/3467 | 203/18723 | 5.13e-07 | 1.98e-05 | 67 |
| GO:00521262 | Colorectum | MSS | movement in host environment | 58/3467 | 175/18723 | 2.50e-06 | 7.64e-05 | 58 |
| GO:00507922 | Colorectum | MSS | regulation of viral process | 54/3467 | 164/18723 | 6.79e-06 | 1.77e-04 | 54 |
| GO:00467182 | Colorectum | MSS | viral entry into host cell | 47/3467 | 144/18723 | 3.35e-05 | 6.56e-04 | 47 |
| GO:19039002 | Colorectum | MSS | regulation of viral life cycle | 47/3467 | 148/18723 | 7.20e-05 | 1.21e-03 | 47 |
| GO:00444092 | Colorectum | MSS | entry into host | 47/3467 | 151/18723 | 1.24e-04 | 1.91e-03 | 47 |
| Page: 1 2 3 4 5 6 7 8 |
| Pathway ID | Tissue | Disease Stage | Description | Gene Ratio | Bg Ratio | pvalue | p.adjust | qvalue | Count |
| Page: 1 |
Top |
Cell-cell communication analysis |
| Identification of potential cell-cell interactions between two cell types and their ligand-receptor pairs for different disease states |
| Ligand | Receptor | LRpair | Pathway | Tissue | Disease Stage |
| Page: 1 |
Top |
Single-cell gene regulatory network inference analysis |
| Find out the significant the regulons (TFs) and the target genes of each regulon across cell types for different disease states |
| TF | Cell Type | Tissue | Disease Stage | Target Gene | RSS | Regulon Activity |
| ∗The dot plots of a searched regulon are shown for all cell subpopulations in each disease state of each tissue based on the regulon specific score inferred using pySCENIC and by calculating the average expression. |
| Page: 1 |
Top |
Somatic mutation of malignant transformation related genes |
| Annotation of somatic variants for genes involved in malignant transformation |
| Hugo Symbol | Variant Class | Variant Classification | dbSNP RS | HGVSc | HGVSp | HGVSp Short | SWISSPROT | BIOTYPE | SIFT | PolyPhen | Tumor Sample Barcode | Tissue | Histology | Sex | Age | Stage | Therapy Types | Drugs | Outcome |
| TRIM31 | insertion | Frame_Shift_Ins | novel | c.98_99insAGCTCTACAAGCCTCTGAGGTGCAGTCCAAAAGGAAAGAGGCTACATGCC | p.His33GlnfsTer45 | p.H33Qfs*45 | Q9BZY9 | protein_coding | TCGA-AO-A0JB-01 | Breast | breast invasive carcinoma | Female | <65 | III/IV | Chemotherapy | cyclophosphamide | SD | ||
| TRIM31 | SNV | Missense_Mutation | c.126G>C | p.Gln42His | p.Q42H | Q9BZY9 | protein_coding | deleterious(0.01) | probably_damaging(0.95) | TCGA-Q1-A73O-01 | Cervix | cervical & endocervical cancer | Female | <65 | I/II | Chemotherapy | cisplatin | CR | |
| TRIM31 | SNV | Missense_Mutation | novel | c.824N>G | p.Lys275Arg | p.K275R | Q9BZY9 | protein_coding | deleterious(0.02) | benign(0.122) | TCGA-AA-3811-01 | Colorectum | colon adenocarcinoma | Female | >=65 | III/IV | Unknown | Unknown | PD |
| TRIM31 | SNV | Missense_Mutation | c.254N>C | p.Glu85Ala | p.E85A | Q9BZY9 | protein_coding | deleterious(0.01) | benign(0.024) | TCGA-AA-3952-01 | Colorectum | colon adenocarcinoma | Male | >=65 | III/IV | Unknown | Unknown | PD | |
| TRIM31 | SNV | Missense_Mutation | c.1163C>T | p.Ala388Val | p.A388V | Q9BZY9 | protein_coding | deleterious_low_confidence(0.02) | benign(0.038) | TCGA-AZ-6601-01 | Colorectum | colon adenocarcinoma | Male | >=65 | I/II | Unknown | Unknown | PD | |
| TRIM31 | SNV | Missense_Mutation | c.134N>G | p.Glu45Gly | p.E45G | Q9BZY9 | protein_coding | tolerated(0.08) | benign(0.18) | TCGA-WS-AB45-01 | Colorectum | colon adenocarcinoma | Female | <65 | I/II | Unknown | Unknown | SD | |
| TRIM31 | SNV | Missense_Mutation | novel | c.722N>A | p.Met241Lys | p.M241K | Q9BZY9 | protein_coding | deleterious(0.01) | benign(0.017) | TCGA-AG-A032-01 | Colorectum | rectum adenocarcinoma | Male | >=65 | III/IV | Targeted Molecular therapy | bevacizumab | PD |
| TRIM31 | SNV | Missense_Mutation | rs201488158 | c.61N>A | p.Asp21Asn | p.D21N | Q9BZY9 | protein_coding | deleterious(0) | possibly_damaging(0.574) | TCGA-A5-A0G2-01 | Endometrium | uterine corpus endometrioid carcinoma | Female | <65 | III/IV | Unknown | Unknown | SD |
| TRIM31 | SNV | Missense_Mutation | novel | c.1270T>C | p.Ser424Pro | p.S424P | Q9BZY9 | protein_coding | deleterious_low_confidence(0) | benign(0.003) | TCGA-AJ-A3EK-01 | Endometrium | uterine corpus endometrioid carcinoma | Female | <65 | I/II | Chemotherapy | carboplatin | CR |
| TRIM31 | SNV | Missense_Mutation | c.539N>T | p.Arg180Met | p.R180M | Q9BZY9 | protein_coding | tolerated(0.09) | benign(0.269) | TCGA-AP-A051-01 | Endometrium | uterine corpus endometrioid carcinoma | Female | >=65 | I/II | Unknown | Unknown | SD |
| Page: 1 2 3 4 5 |
Top |
Related drugs of malignant transformation related genes |
| Identification of chemicals and drugs interact with genes involved in malignant transfromation |
| (DGIdb 4.0) |
| Entrez ID | Symbol | Category | Interaction Types | Drug Claim Name | Drug Name | PMIDs |
| Page: 1 |

Copyright 2023-Present -The University of Texas Health Science Center at Houston |