
|
|||||
|
 | |
| |
| |
| |
| |
| |
|
Gene: TRIM16 |
Gene summary for TRIM16 |
| Gene information | Species | Human | Gene symbol | TRIM16 | Gene ID | 10626 |
| Gene name | tripartite motif containing 16 | |
| Gene Alias | EBBP | |
| Cytomap | 17p12 | |
| Gene Type | protein-coding | GO ID | GO:0001816 | UniProtAcc | O95361 |
Top |
Malignant transformation analysis |
| Identification of the aberrant gene expression in precancerous and cancerous lesions by comparing the gene expression of stem-like cells in diseased tissues with normal stem cells |
| Entrez ID | Symbol | Replicates | Species | Organ | Tissue | Adj P-value | Log2FC | Malignancy |
| 10626 | TRIM16 | LZE2T | Human | Esophagus | ESCC | 3.25e-04 | 6.72e-01 | 0.082 |
| 10626 | TRIM16 | LZE4T | Human | Esophagus | ESCC | 1.88e-39 | 1.47e+00 | 0.0811 |
| 10626 | TRIM16 | LZE5T | Human | Esophagus | ESCC | 7.14e-06 | 7.32e-01 | 0.0514 |
| 10626 | TRIM16 | LZE7T | Human | Esophagus | ESCC | 5.67e-16 | 9.03e-01 | 0.0667 |
| 10626 | TRIM16 | LZE8T | Human | Esophagus | ESCC | 1.36e-11 | 3.87e-01 | 0.067 |
| 10626 | TRIM16 | LZE20T | Human | Esophagus | ESCC | 1.22e-04 | 3.25e-01 | 0.0662 |
| 10626 | TRIM16 | LZE21D1 | Human | Esophagus | HGIN | 2.08e-02 | 1.63e-01 | 0.0632 |
| 10626 | TRIM16 | LZE22D1 | Human | Esophagus | HGIN | 1.21e-03 | 2.26e-01 | 0.0595 |
| 10626 | TRIM16 | LZE22T | Human | Esophagus | ESCC | 5.64e-12 | 1.02e+00 | 0.068 |
| 10626 | TRIM16 | LZE24T | Human | Esophagus | ESCC | 4.60e-20 | 7.04e-01 | 0.0596 |
| 10626 | TRIM16 | LZE21T | Human | Esophagus | ESCC | 6.36e-17 | 1.12e+00 | 0.0655 |
| 10626 | TRIM16 | LZE6T | Human | Esophagus | ESCC | 9.98e-03 | 1.39e-01 | 0.0845 |
| 10626 | TRIM16 | P1T-E | Human | Esophagus | ESCC | 9.51e-22 | 8.33e-01 | 0.0875 |
| 10626 | TRIM16 | P2T-E | Human | Esophagus | ESCC | 9.40e-16 | 3.38e-01 | 0.1177 |
| 10626 | TRIM16 | P4T-E | Human | Esophagus | ESCC | 1.36e-67 | 1.72e+00 | 0.1323 |
| 10626 | TRIM16 | P5T-E | Human | Esophagus | ESCC | 3.82e-33 | 7.06e-01 | 0.1327 |
| 10626 | TRIM16 | P8T-E | Human | Esophagus | ESCC | 5.54e-20 | 4.70e-01 | 0.0889 |
| 10626 | TRIM16 | P9T-E | Human | Esophagus | ESCC | 5.71e-41 | 9.04e-01 | 0.1131 |
| 10626 | TRIM16 | P10T-E | Human | Esophagus | ESCC | 9.32e-10 | 2.70e-01 | 0.116 |
| 10626 | TRIM16 | P11T-E | Human | Esophagus | ESCC | 6.55e-12 | 8.91e-01 | 0.1426 |
| Page: 1 2 3 4 5 |
| Tissue | Expression Dynamics | Abbreviation |
| Esophagus | 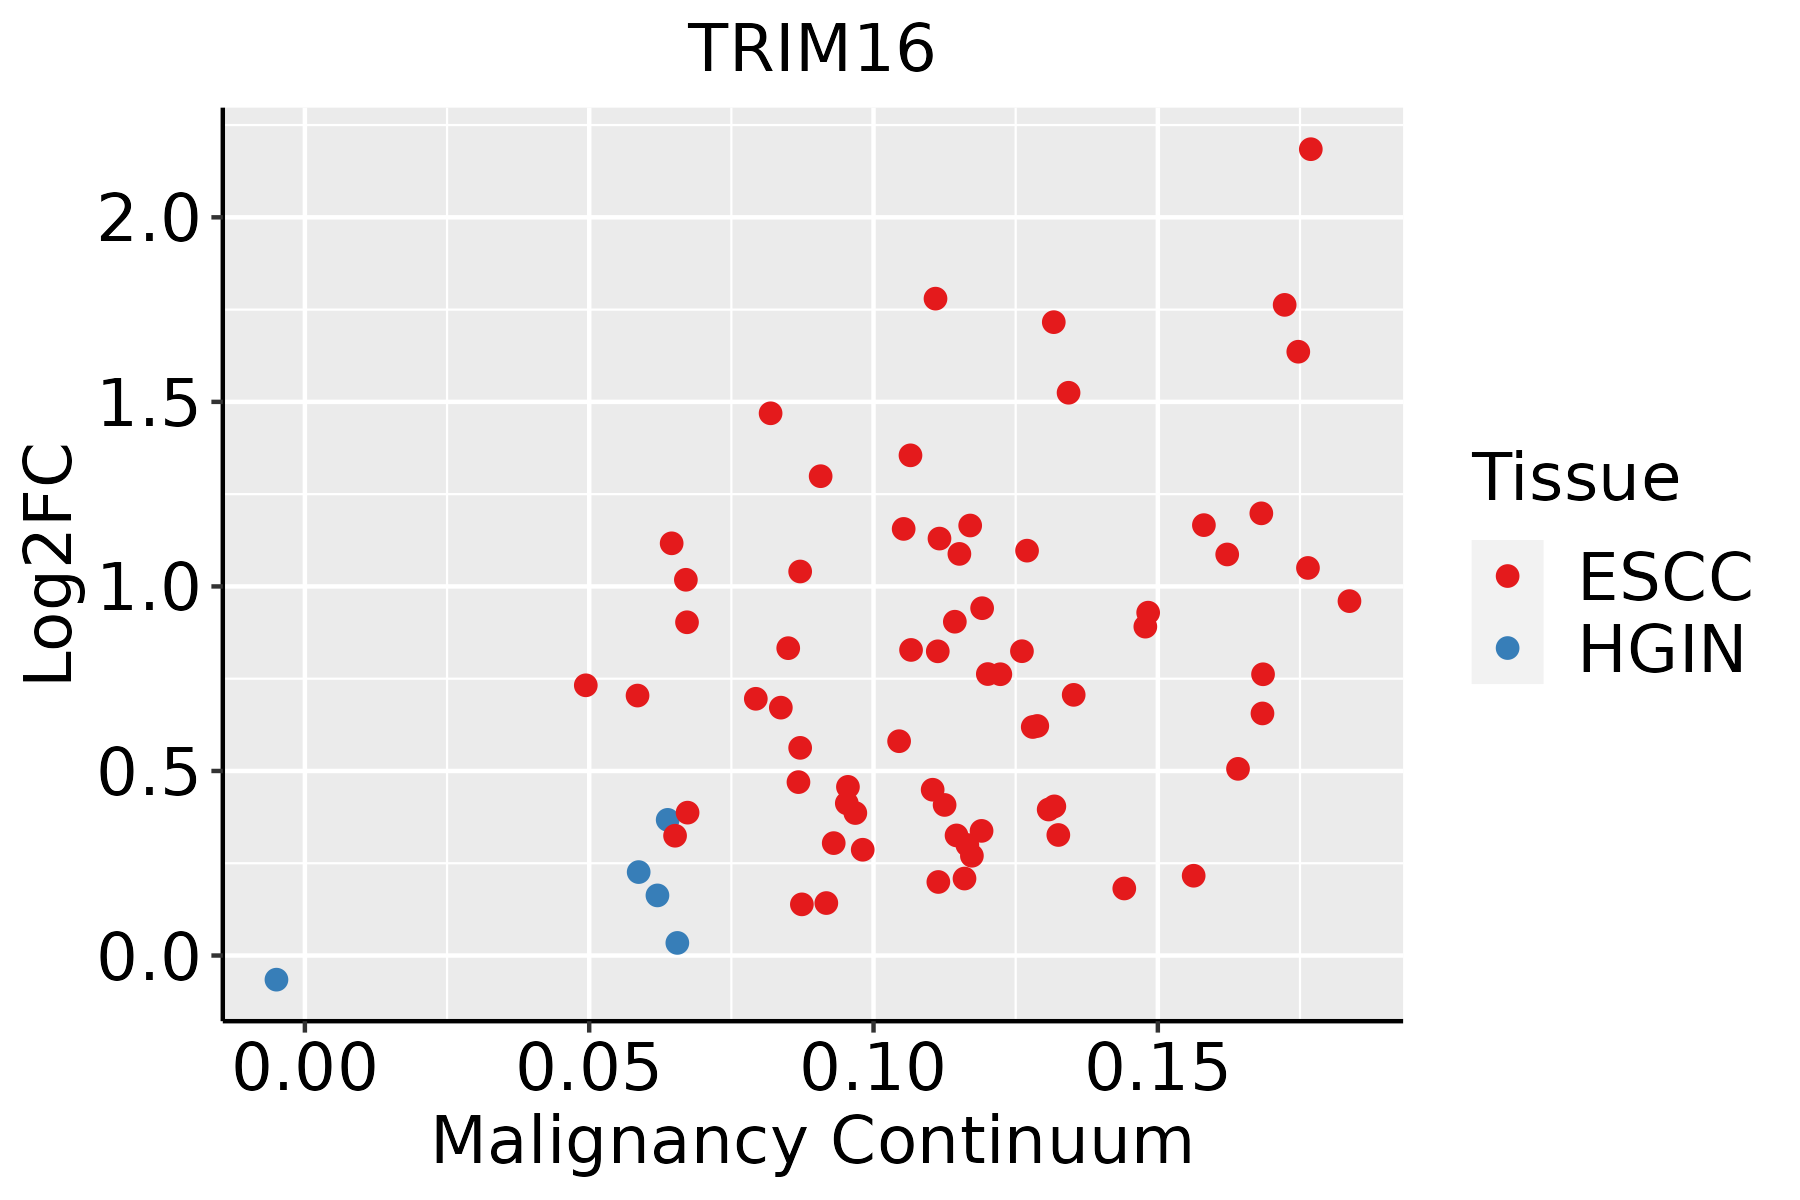 | ESCC: Esophageal squamous cell carcinoma |
| HGIN: High-grade intraepithelial neoplasias | ||
| LGIN: Low-grade intraepithelial neoplasias | ||
| Liver | 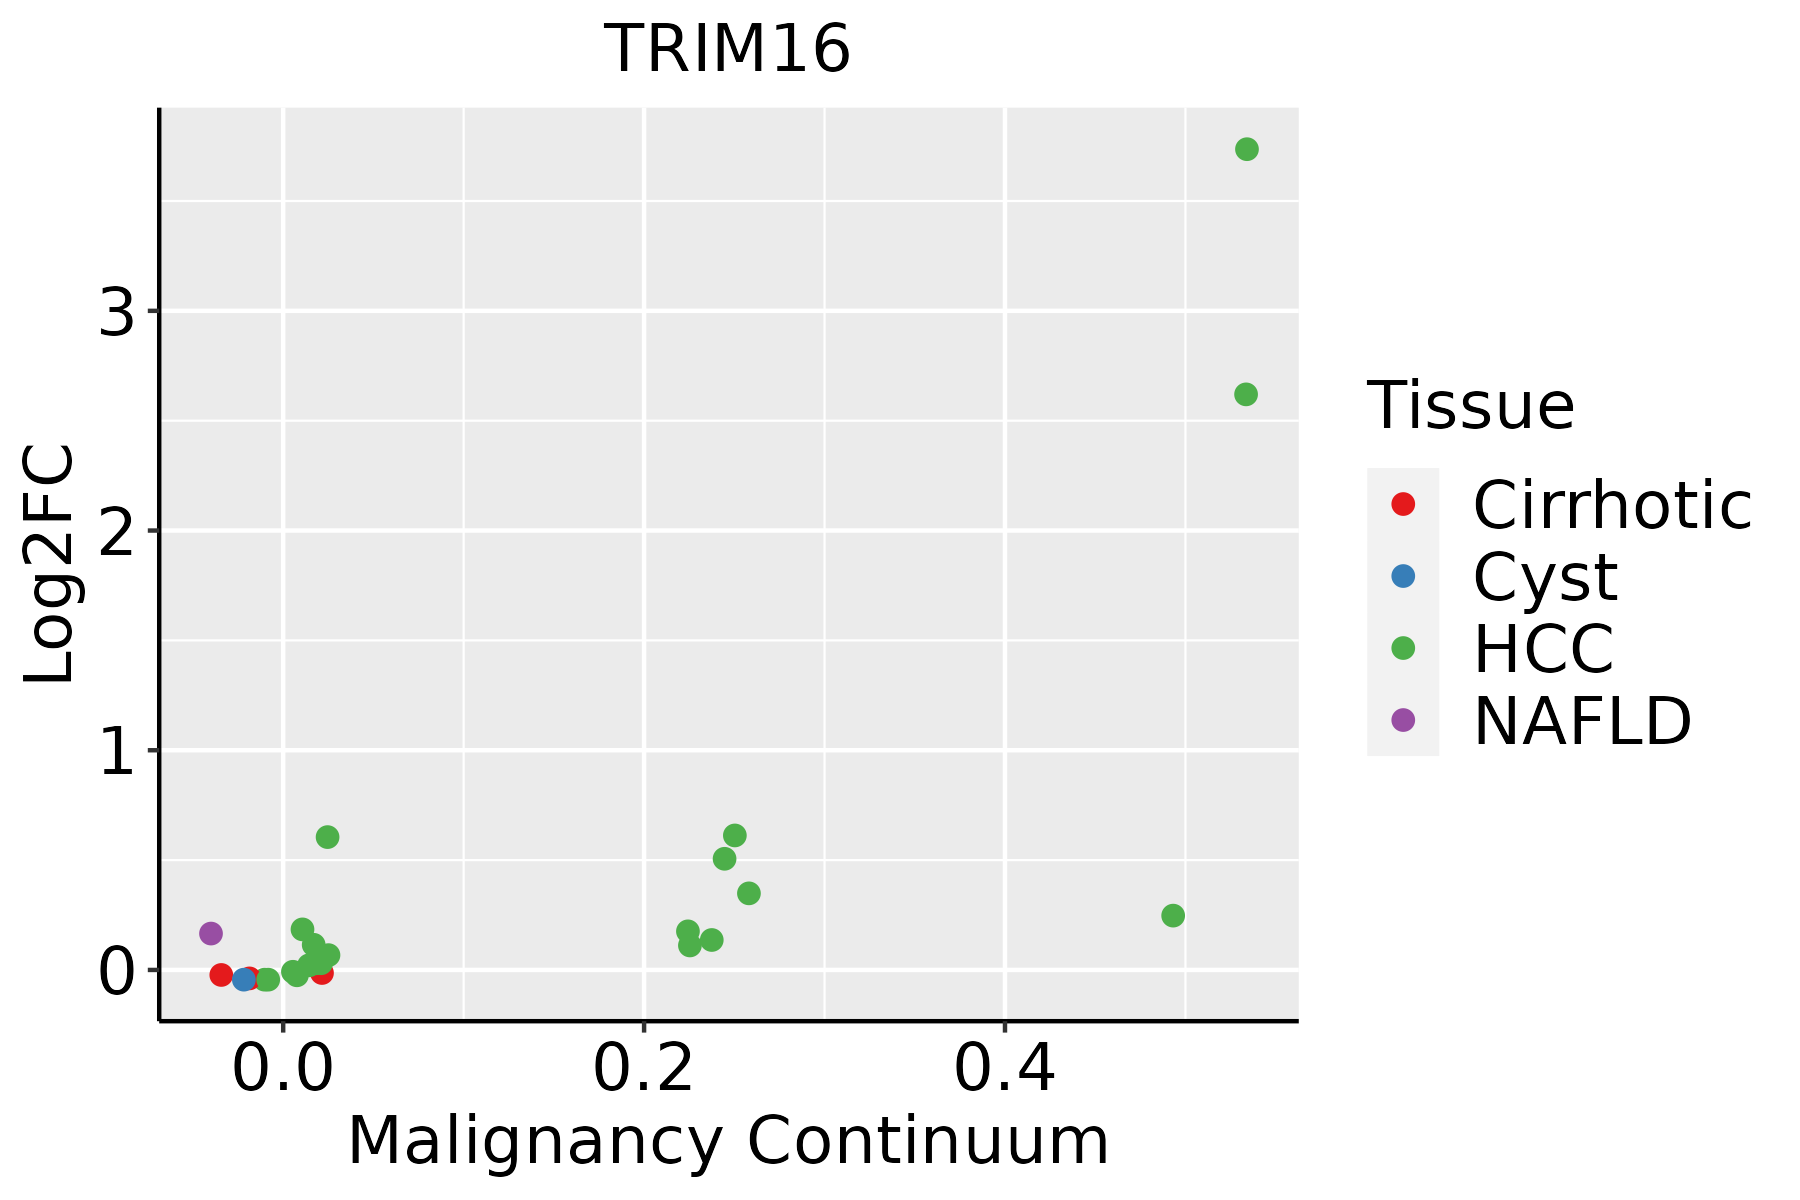 | HCC: Hepatocellular carcinoma |
| NAFLD: Non-alcoholic fatty liver disease | ||
| Oral Cavity | 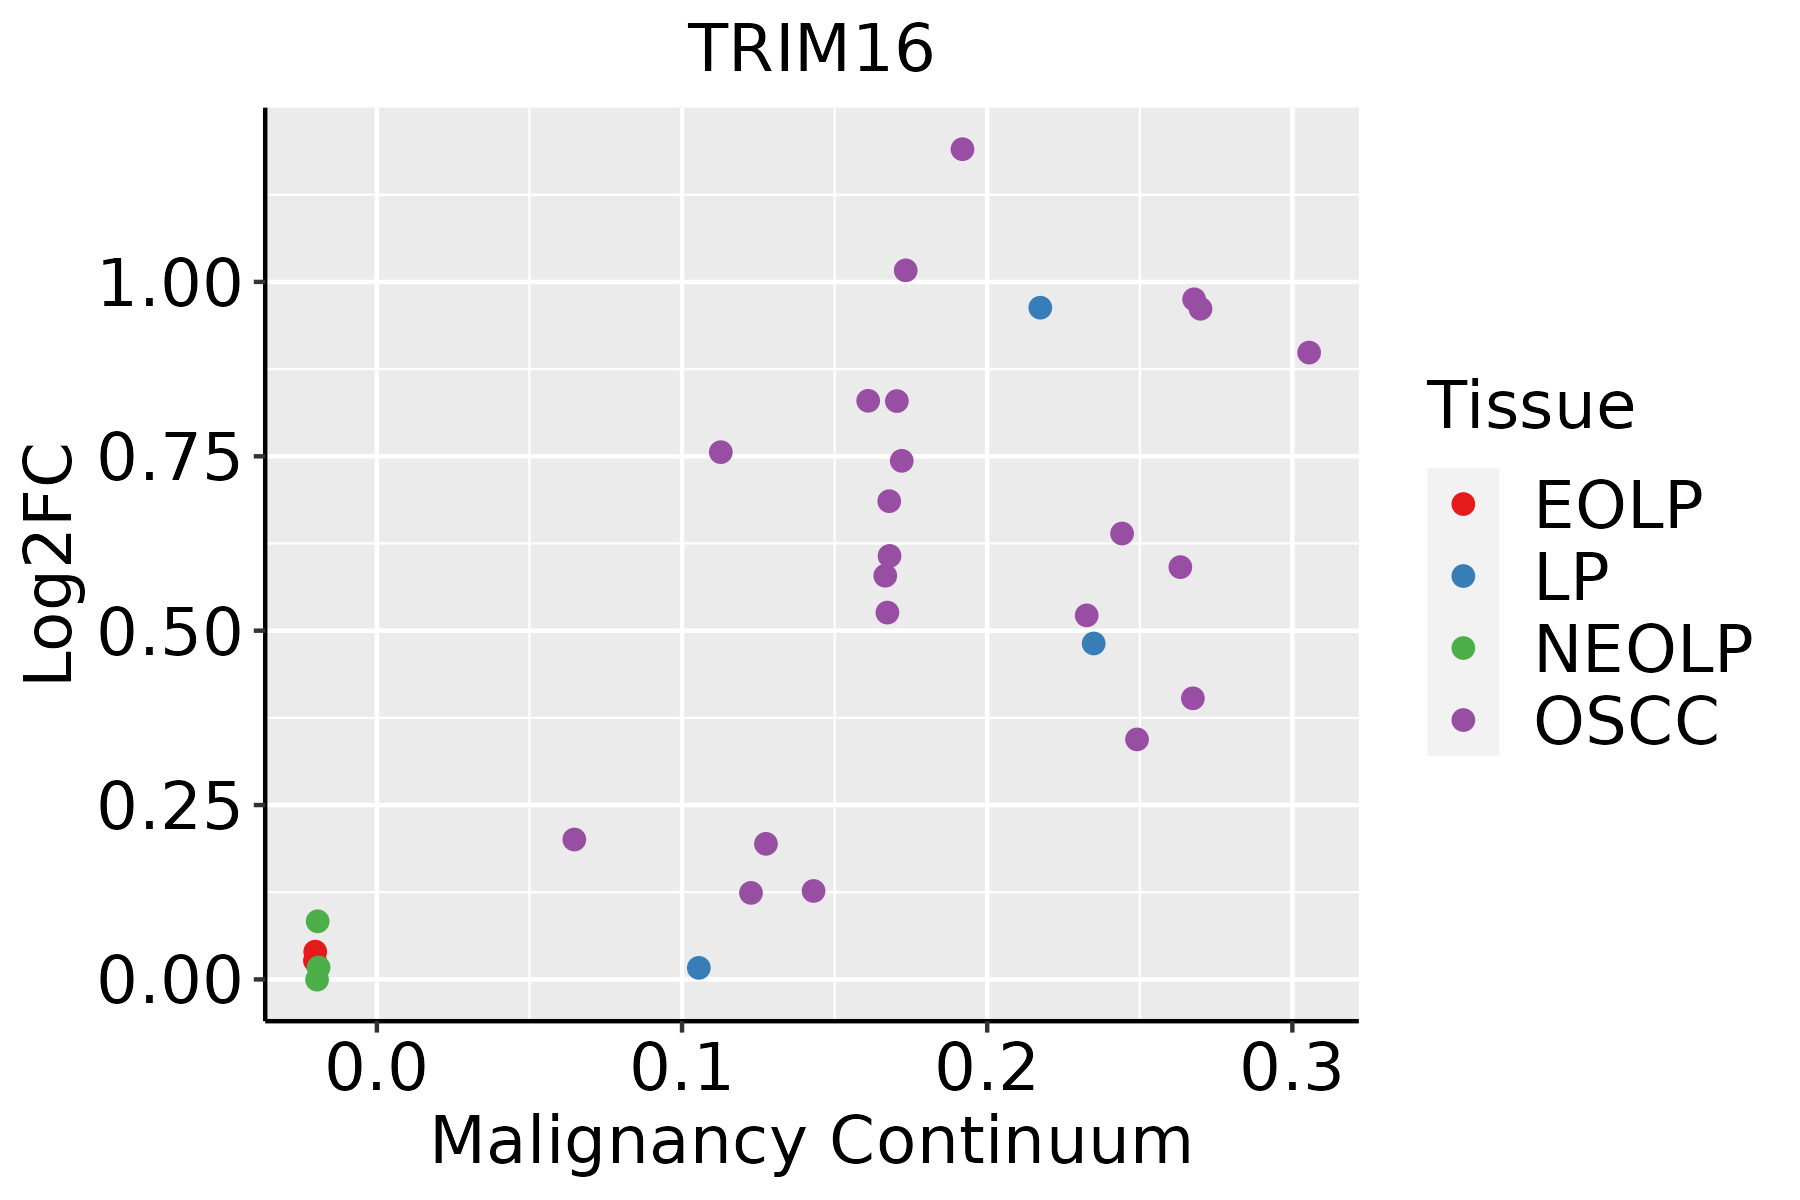 | EOLP: Erosive Oral lichen planus |
| LP: leukoplakia | ||
| NEOLP: Non-erosive oral lichen planus | ||
| OSCC: Oral squamous cell carcinoma | ||
| Skin | 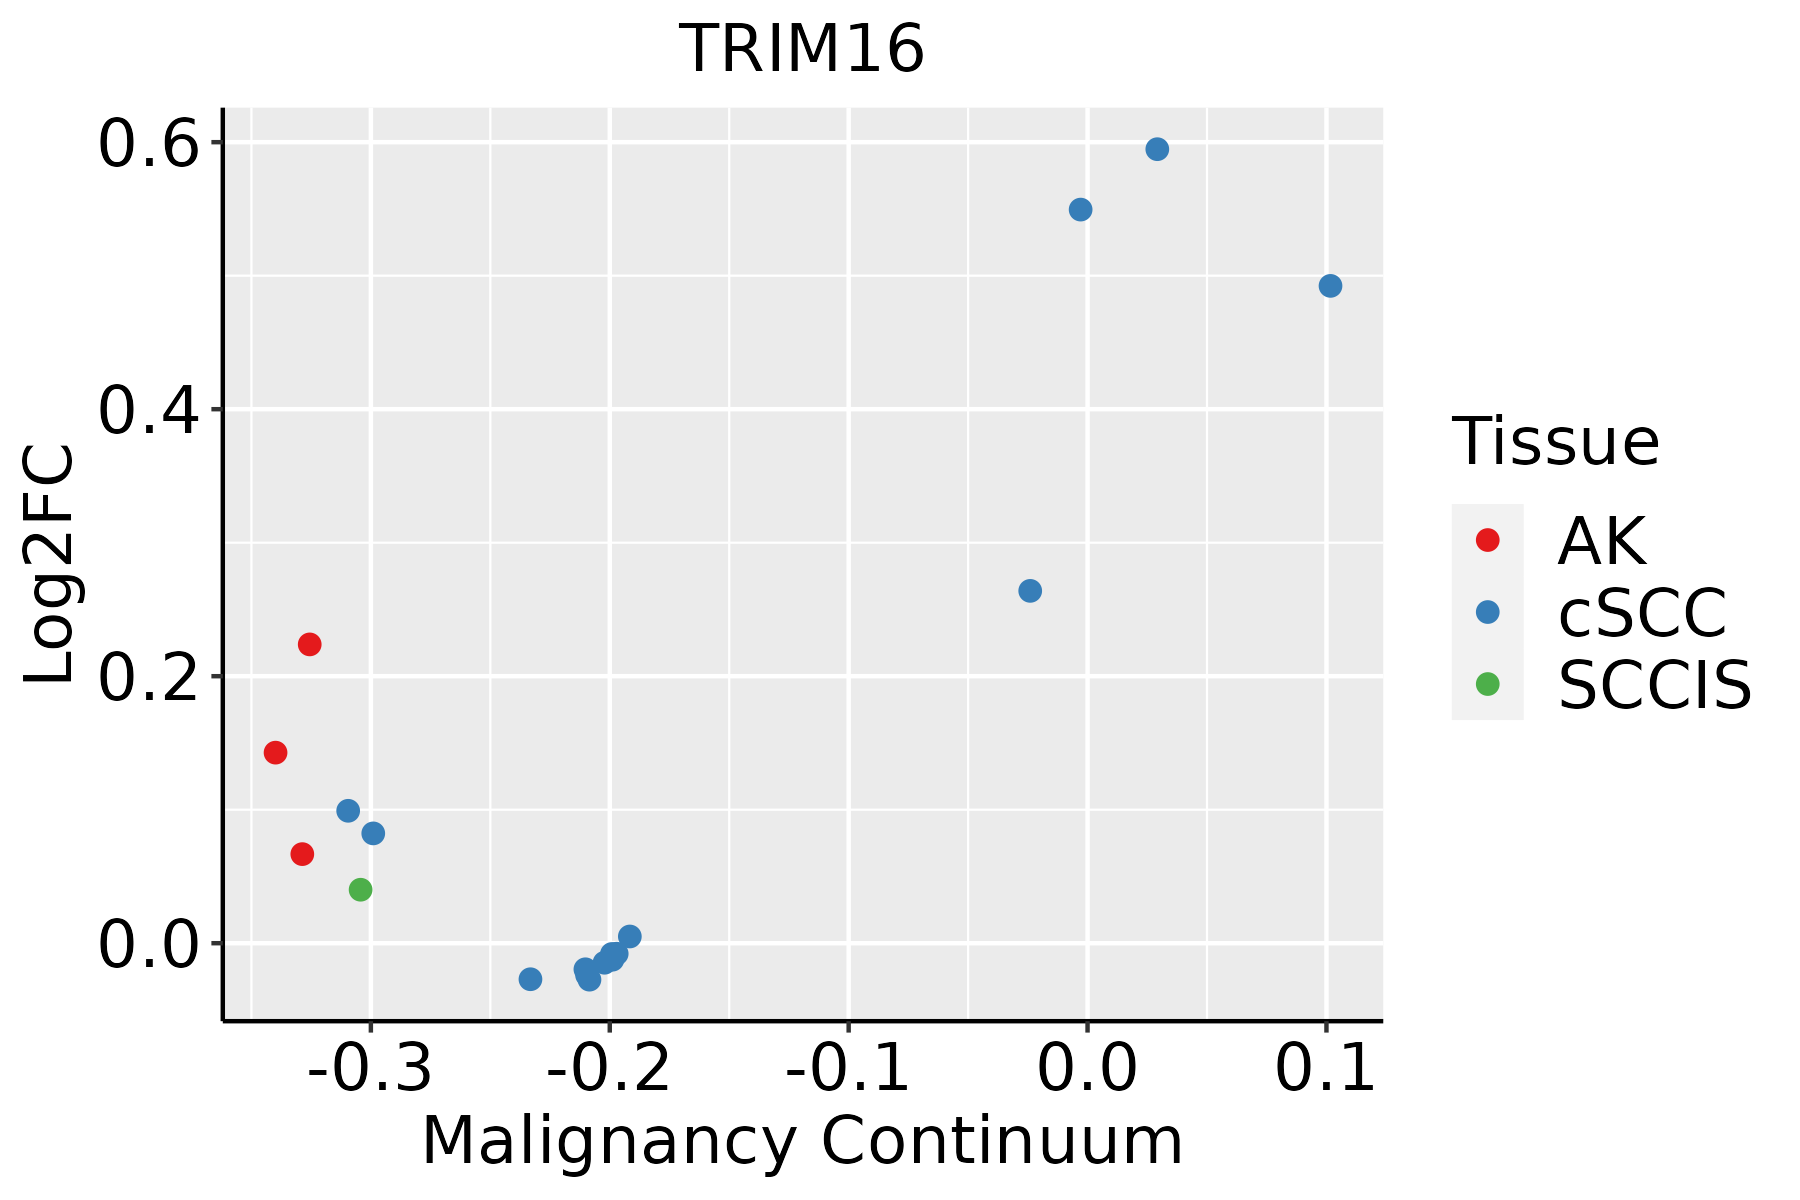 | AK: Actinic keratosis |
| cSCC: Cutaneous squamous cell carcinoma | ||
| SCCIS:squamous cell carcinoma in situ |
| ∗log2FC in expression of this searched gene in stem-like cells from each diseased tissue sample relative to stem-like cells in normal samples in each tissue plotted against the malignancy continuum. Samples are colored based on if they are from different disease stage. |
Top |
Malignant transformation related pathway analysis |
| Find out the enriched GO biological processes and KEGG pathways involved in transition from healthy to precancer to cancer |
| Tissue | Disease Stage | Enriched GO biological Processes |
| Colorectum | AD |  |
| Colorectum | SER |  |
| Colorectum | MSS |  |
| Colorectum | MSI-H |  |
| Colorectum | FAP |  |
| ∗Top 15 enriched GO BP terms are showed in the bar plot of each disease state in each tissue. Each row represents a significant GO biological process which is colored according to the -log10(p.adjust). |
| Page: 1 2 3 4 5 6 7 8 9 |
| GO ID | Tissue | Disease Stage | Description | Gene Ratio | Bg Ratio | pvalue | p.adjust | Count |
| GO:004396712 | Esophagus | ESCC | histone H4 acetylation | 53/8552 | 67/18723 | 2.11e-08 | 4.03e-07 | 53 |
| GO:00435888 | Esophagus | ESCC | skin development | 163/8552 | 263/18723 | 6.48e-08 | 1.14e-06 | 163 |
| GO:000854410 | Esophagus | ESCC | epidermis development | 193/8552 | 324/18723 | 2.87e-07 | 4.19e-06 | 193 |
| GO:0043434111 | Esophagus | ESCC | response to peptide hormone | 234/8552 | 414/18723 | 4.93e-06 | 5.21e-05 | 234 |
| GO:000991310 | Esophagus | ESCC | epidermal cell differentiation | 122/8552 | 202/18723 | 1.69e-05 | 1.51e-04 | 122 |
| GO:00456826 | Esophagus | ESCC | regulation of epidermis development | 46/8552 | 65/18723 | 3.65e-05 | 2.97e-04 | 46 |
| GO:00439662 | Esophagus | ESCC | histone H3 acetylation | 43/8552 | 61/18723 | 7.57e-05 | 5.67e-04 | 43 |
| GO:00302167 | Esophagus | ESCC | keratinocyte differentiation | 86/8552 | 139/18723 | 8.53e-05 | 6.19e-04 | 86 |
| GO:00456046 | Esophagus | ESCC | regulation of epidermal cell differentiation | 41/8552 | 58/18723 | 1.00e-04 | 7.10e-04 | 41 |
| GO:00456167 | Esophagus | ESCC | regulation of keratinocyte differentiation | 26/8552 | 37/18723 | 2.16e-03 | 9.62e-03 | 26 |
| GO:000181916 | Esophagus | ESCC | positive regulation of cytokine production | 244/8552 | 467/18723 | 2.29e-03 | 1.01e-02 | 244 |
| GO:00456841 | Esophagus | ESCC | positive regulation of epidermis development | 23/8552 | 32/18723 | 2.43e-03 | 1.06e-02 | 23 |
| GO:00456061 | Esophagus | ESCC | positive regulation of epidermal cell differentiation | 20/8552 | 27/18723 | 2.61e-03 | 1.11e-02 | 20 |
| GO:004838412 | Esophagus | ESCC | retinoic acid receptor signaling pathway | 22/8552 | 31/18723 | 3.90e-03 | 1.58e-02 | 22 |
| GO:00325261 | Esophagus | ESCC | response to retinoic acid | 63/8552 | 107/18723 | 4.05e-03 | 1.62e-02 | 63 |
| GO:00456181 | Esophagus | ESCC | positive regulation of keratinocyte differentiation | 14/8552 | 19/18723 | 1.27e-02 | 4.21e-02 | 14 |
| GO:001657021 | Liver | HCC | histone modification | 283/7958 | 463/18723 | 2.68e-16 | 2.33e-14 | 283 |
| GO:00182052 | Liver | HCC | peptidyl-lysine modification | 230/7958 | 376/18723 | 1.51e-13 | 8.32e-12 | 230 |
| GO:003052222 | Liver | HCC | intracellular receptor signaling pathway | 171/7958 | 265/18723 | 3.00e-13 | 1.61e-11 | 171 |
| GO:004343422 | Liver | HCC | response to peptide hormone | 247/7958 | 414/18723 | 9.55e-13 | 4.77e-11 | 247 |
| Page: 1 2 3 4 5 6 |
| Pathway ID | Tissue | Disease Stage | Description | Gene Ratio | Bg Ratio | pvalue | p.adjust | qvalue | Count |
| Page: 1 |
Top |
Cell-cell communication analysis |
| Identification of potential cell-cell interactions between two cell types and their ligand-receptor pairs for different disease states |
| Ligand | Receptor | LRpair | Pathway | Tissue | Disease Stage |
| Page: 1 |
Top |
Single-cell gene regulatory network inference analysis |
| Find out the significant the regulons (TFs) and the target genes of each regulon across cell types for different disease states |
| TF | Cell Type | Tissue | Disease Stage | Target Gene | RSS | Regulon Activity |
| ∗The dot plots of a searched regulon are shown for all cell subpopulations in each disease state of each tissue based on the regulon specific score inferred using pySCENIC and by calculating the average expression. |
| Page: 1 |
Top |
Somatic mutation of malignant transformation related genes |
| Annotation of somatic variants for genes involved in malignant transformation |
| Hugo Symbol | Variant Class | Variant Classification | dbSNP RS | HGVSc | HGVSp | HGVSp Short | SWISSPROT | BIOTYPE | SIFT | PolyPhen | Tumor Sample Barcode | Tissue | Histology | Sex | Age | Stage | Therapy Types | Drugs | Outcome |
| TRIM16 | SNV | Missense_Mutation | novel | c.1115N>T | p.Ala372Val | p.A372V | O95361 | protein_coding | tolerated(0.13) | benign(0.044) | TCGA-2W-A8YY-01 | Cervix | cervical & endocervical cancer | Female | <65 | I/II | Chemotherapy | cisplatin | CR |
| TRIM16 | SNV | Missense_Mutation | novel | c.1639N>C | p.Asp547His | p.D547H | O95361 | protein_coding | deleterious(0.03) | probably_damaging(0.956) | TCGA-C5-A7X5-01 | Cervix | cervical & endocervical cancer | Female | >=65 | I/II | Chemotherapy | carboplatin | PD |
| TRIM16 | SNV | Missense_Mutation | c.1081G>C | p.Glu361Gln | p.E361Q | O95361 | protein_coding | tolerated(0.07) | possibly_damaging(0.796) | TCGA-EK-A2R9-01 | Cervix | cervical & endocervical cancer | Female | <65 | I/II | Unknown | Unknown | SD | |
| TRIM16 | SNV | Missense_Mutation | novel | c.251C>G | p.Thr84Ser | p.T84S | O95361 | protein_coding | tolerated(0.65) | benign(0.014) | TCGA-JW-A5VL-01 | Cervix | cervical & endocervical cancer | Female | <65 | I/II | Unknown | Unknown | SD |
| TRIM16 | SNV | Missense_Mutation | rs746816242 | c.946N>A | p.Glu316Lys | p.E316K | O95361 | protein_coding | deleterious(0.02) | benign(0.02) | TCGA-UC-A7PF-01 | Cervix | cervical & endocervical cancer | Female | <65 | I/II | Unknown | Unknown | SD |
| TRIM16 | SNV | Missense_Mutation | c.1646N>T | p.Gly549Val | p.G549V | O95361 | protein_coding | deleterious(0.01) | probably_damaging(0.933) | TCGA-AA-3864-01 | Colorectum | colon adenocarcinoma | Male | >=65 | I/II | Unknown | Unknown | SD | |
| TRIM16 | SNV | Missense_Mutation | c.449N>A | p.Cys150Tyr | p.C150Y | O95361 | protein_coding | deleterious(0) | probably_damaging(1) | TCGA-AA-A02R-01 | Colorectum | colon adenocarcinoma | Female | >=65 | I/II | Unknown | Unknown | PD | |
| TRIM16 | SNV | Missense_Mutation | c.907C>A | p.Leu303Met | p.L303M | O95361 | protein_coding | deleterious(0.04) | probably_damaging(0.968) | TCGA-AM-5821-01 | Colorectum | colon adenocarcinoma | Female | >=65 | I/II | Unknown | Unknown | SD | |
| TRIM16 | SNV | Missense_Mutation | novel | c.29N>A | p.Gly10Glu | p.G10E | O95361 | protein_coding | deleterious_low_confidence(0.04) | benign(0.011) | TCGA-AZ-6598-01 | Colorectum | colon adenocarcinoma | Female | >=65 | I/II | Unknown | Unknown | SD |
| TRIM16 | SNV | Missense_Mutation | c.121G>A | p.Glu41Lys | p.E41K | O95361 | protein_coding | tolerated(0.15) | benign(0.006) | TCGA-CK-5912-01 | Colorectum | colon adenocarcinoma | Male | >=65 | I/II | Unknown | Unknown | SD |
| Page: 1 2 3 4 5 6 |
Top |
Related drugs of malignant transformation related genes |
| Identification of chemicals and drugs interact with genes involved in malignant transfromation |
| (DGIdb 4.0) |
| Entrez ID | Symbol | Category | Interaction Types | Drug Claim Name | Drug Name | PMIDs |
| Page: 1 |

Copyright 2023-Present -The University of Texas Health Science Center at Houston |