| Tissue | Expression Dynamics | Abbreviation |
| Cervix | 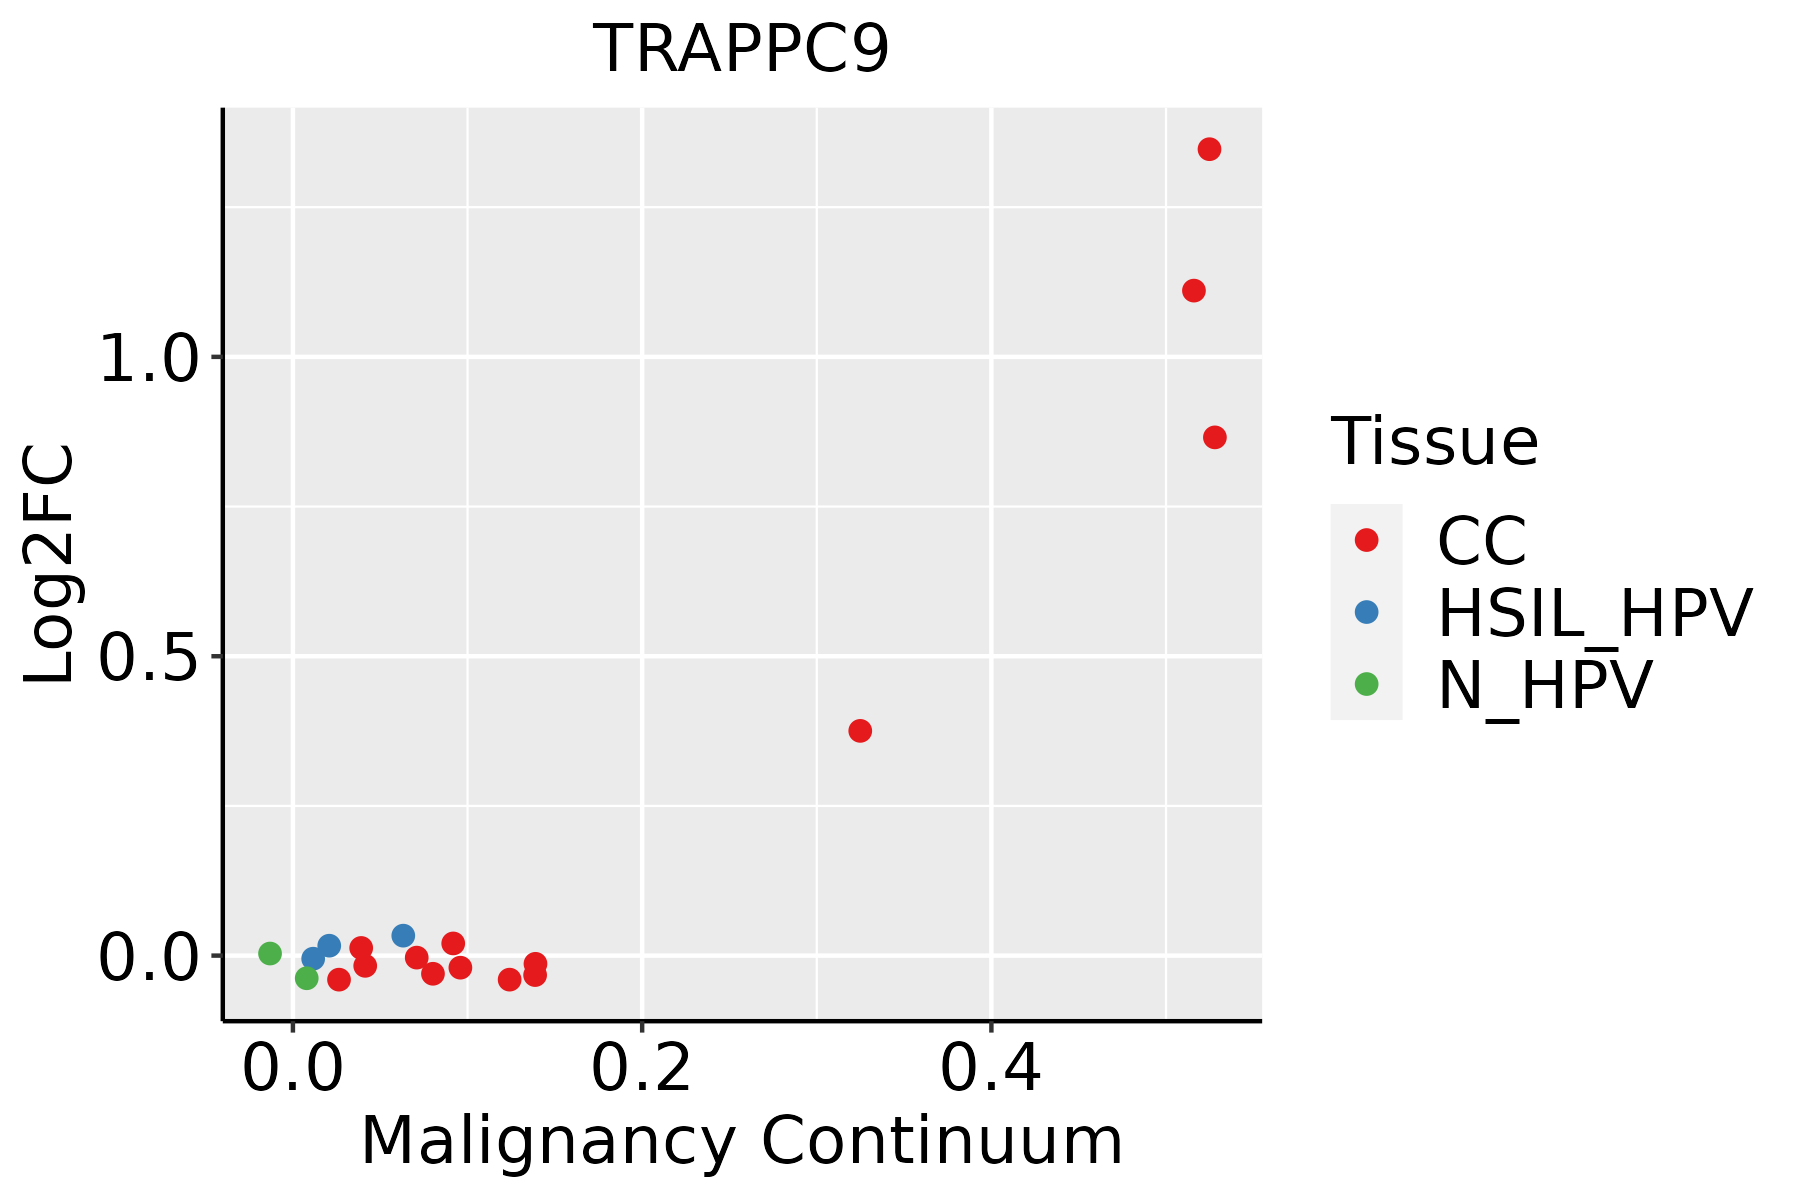 | CC: Cervix cancer |
| HSIL_HPV: HPV-infected high-grade squamous intraepithelial lesions |
| N_HPV: HPV-infected normal cervix |
| Colorectum (GSE201348) |  | FAP: Familial adenomatous polyposis |
| CRC: Colorectal cancer |
| Colorectum (HTA11) |  | AD: Adenomas |
| SER: Sessile serrated lesions |
| MSI-H: Microsatellite-high colorectal cancer |
| MSS: Microsatellite stable colorectal cancer |
| Endometrium |  | AEH: Atypical endometrial hyperplasia |
| EEC: Endometrioid Cancer |
| Esophagus | 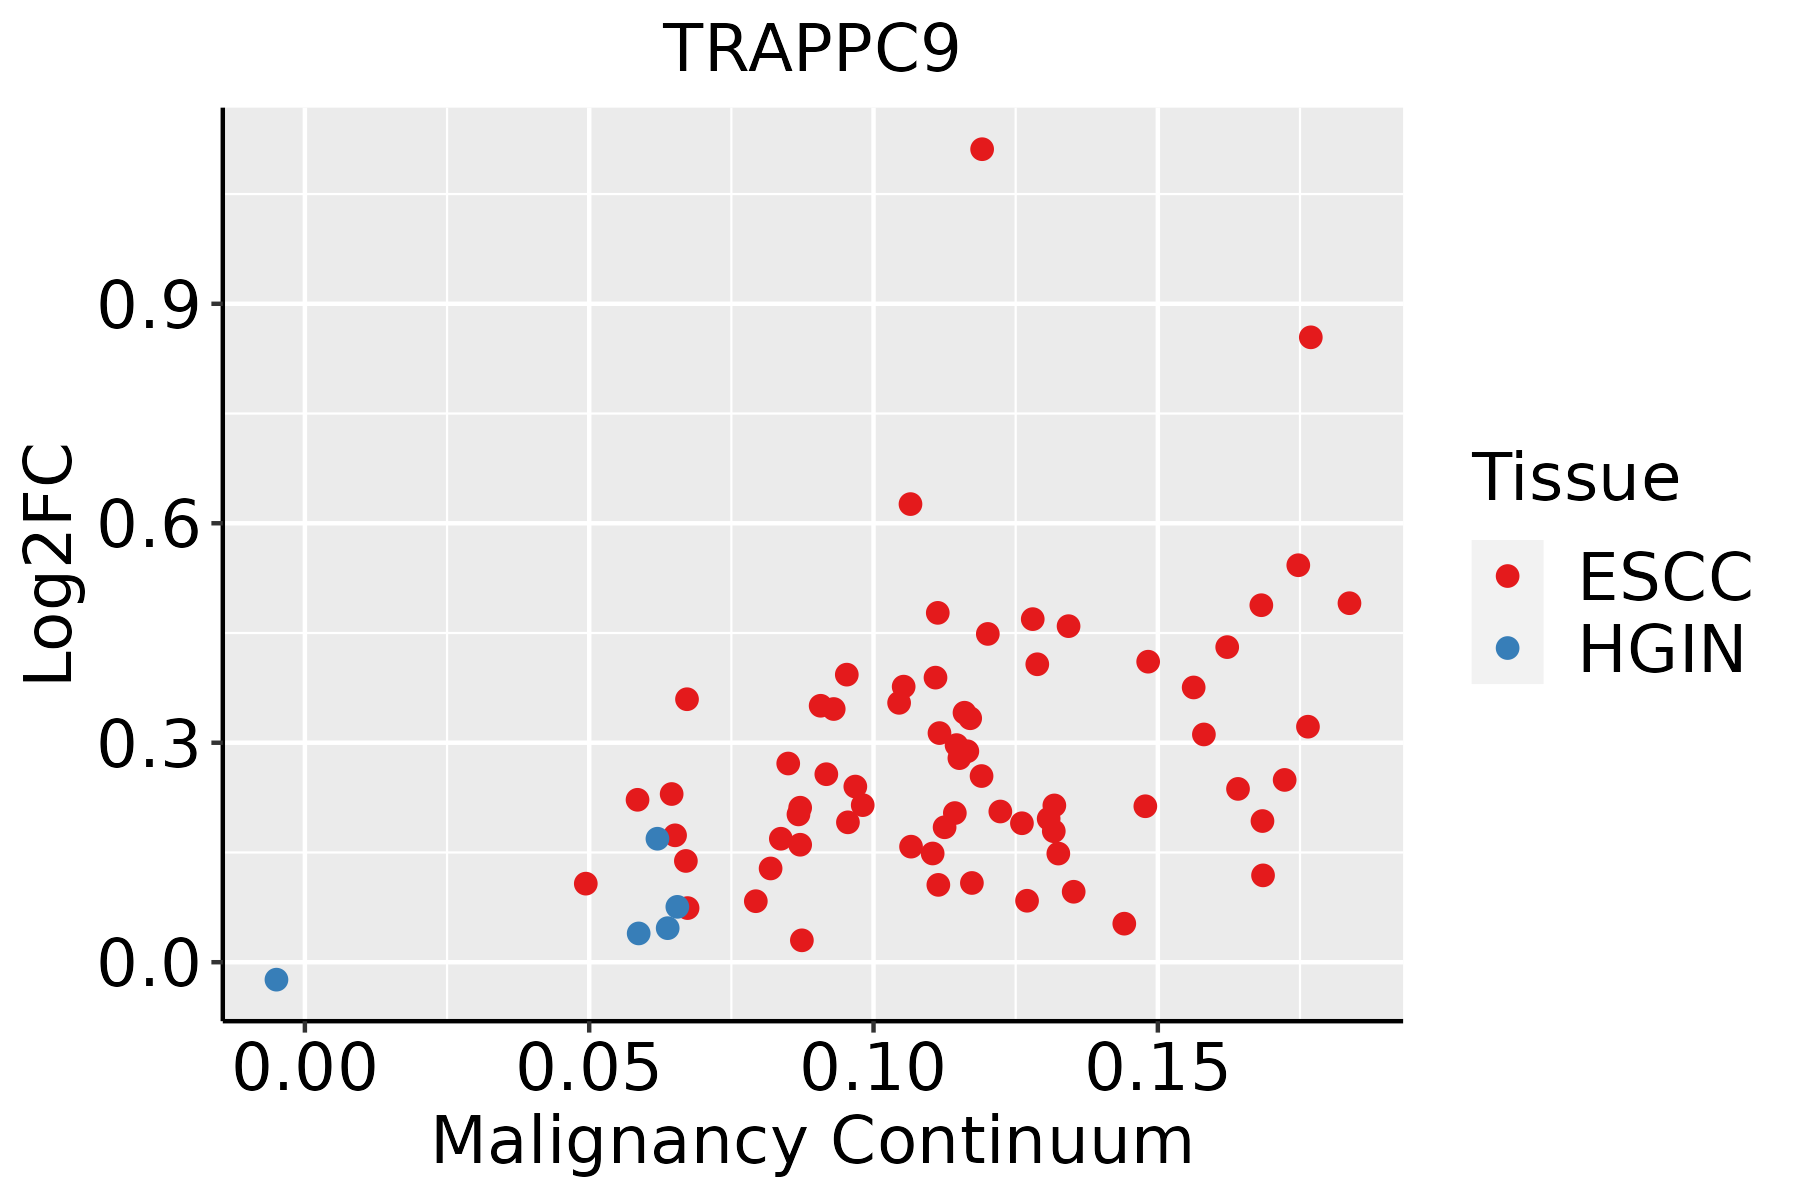 | ESCC: Esophageal squamous cell carcinoma |
| HGIN: High-grade intraepithelial neoplasias |
| LGIN: Low-grade intraepithelial neoplasias |
| Liver | 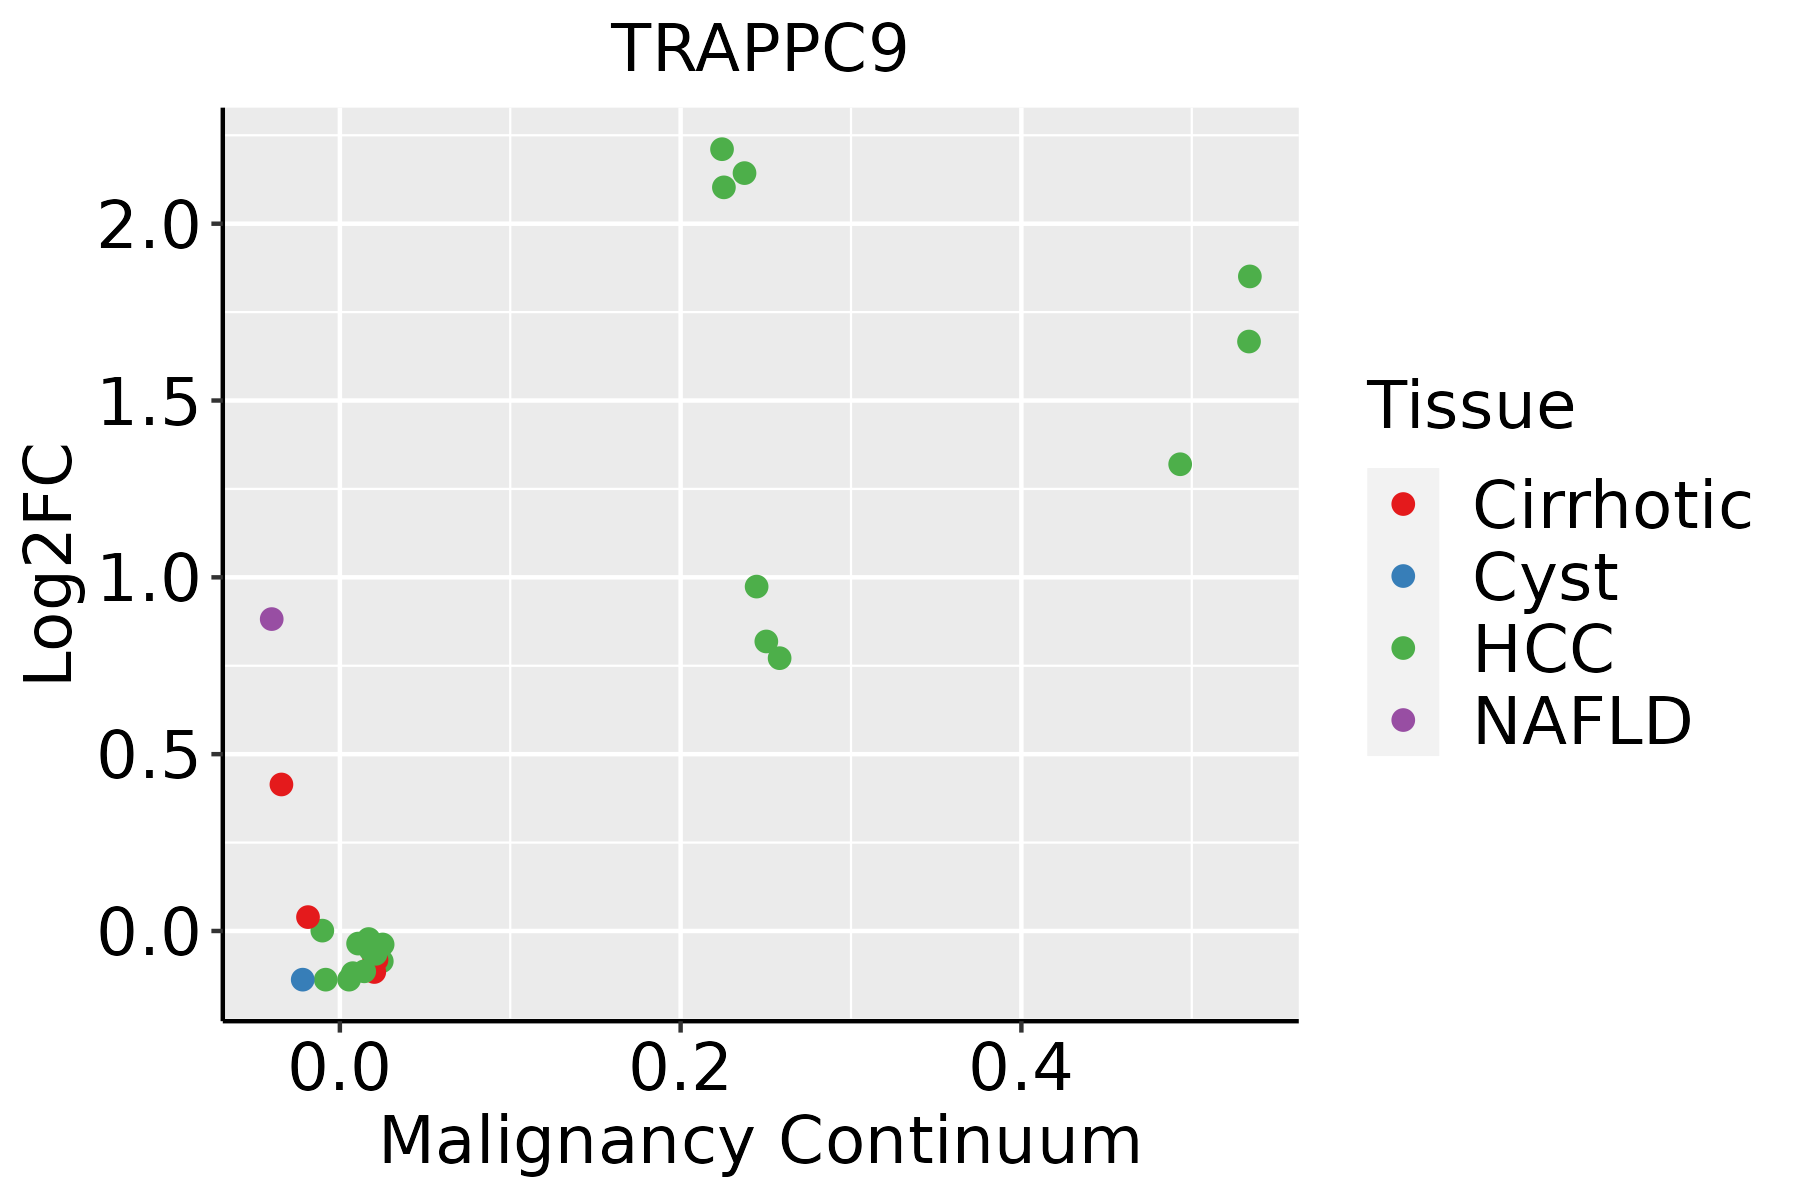 | HCC: Hepatocellular carcinoma |
| NAFLD: Non-alcoholic fatty liver disease |
| Lung | 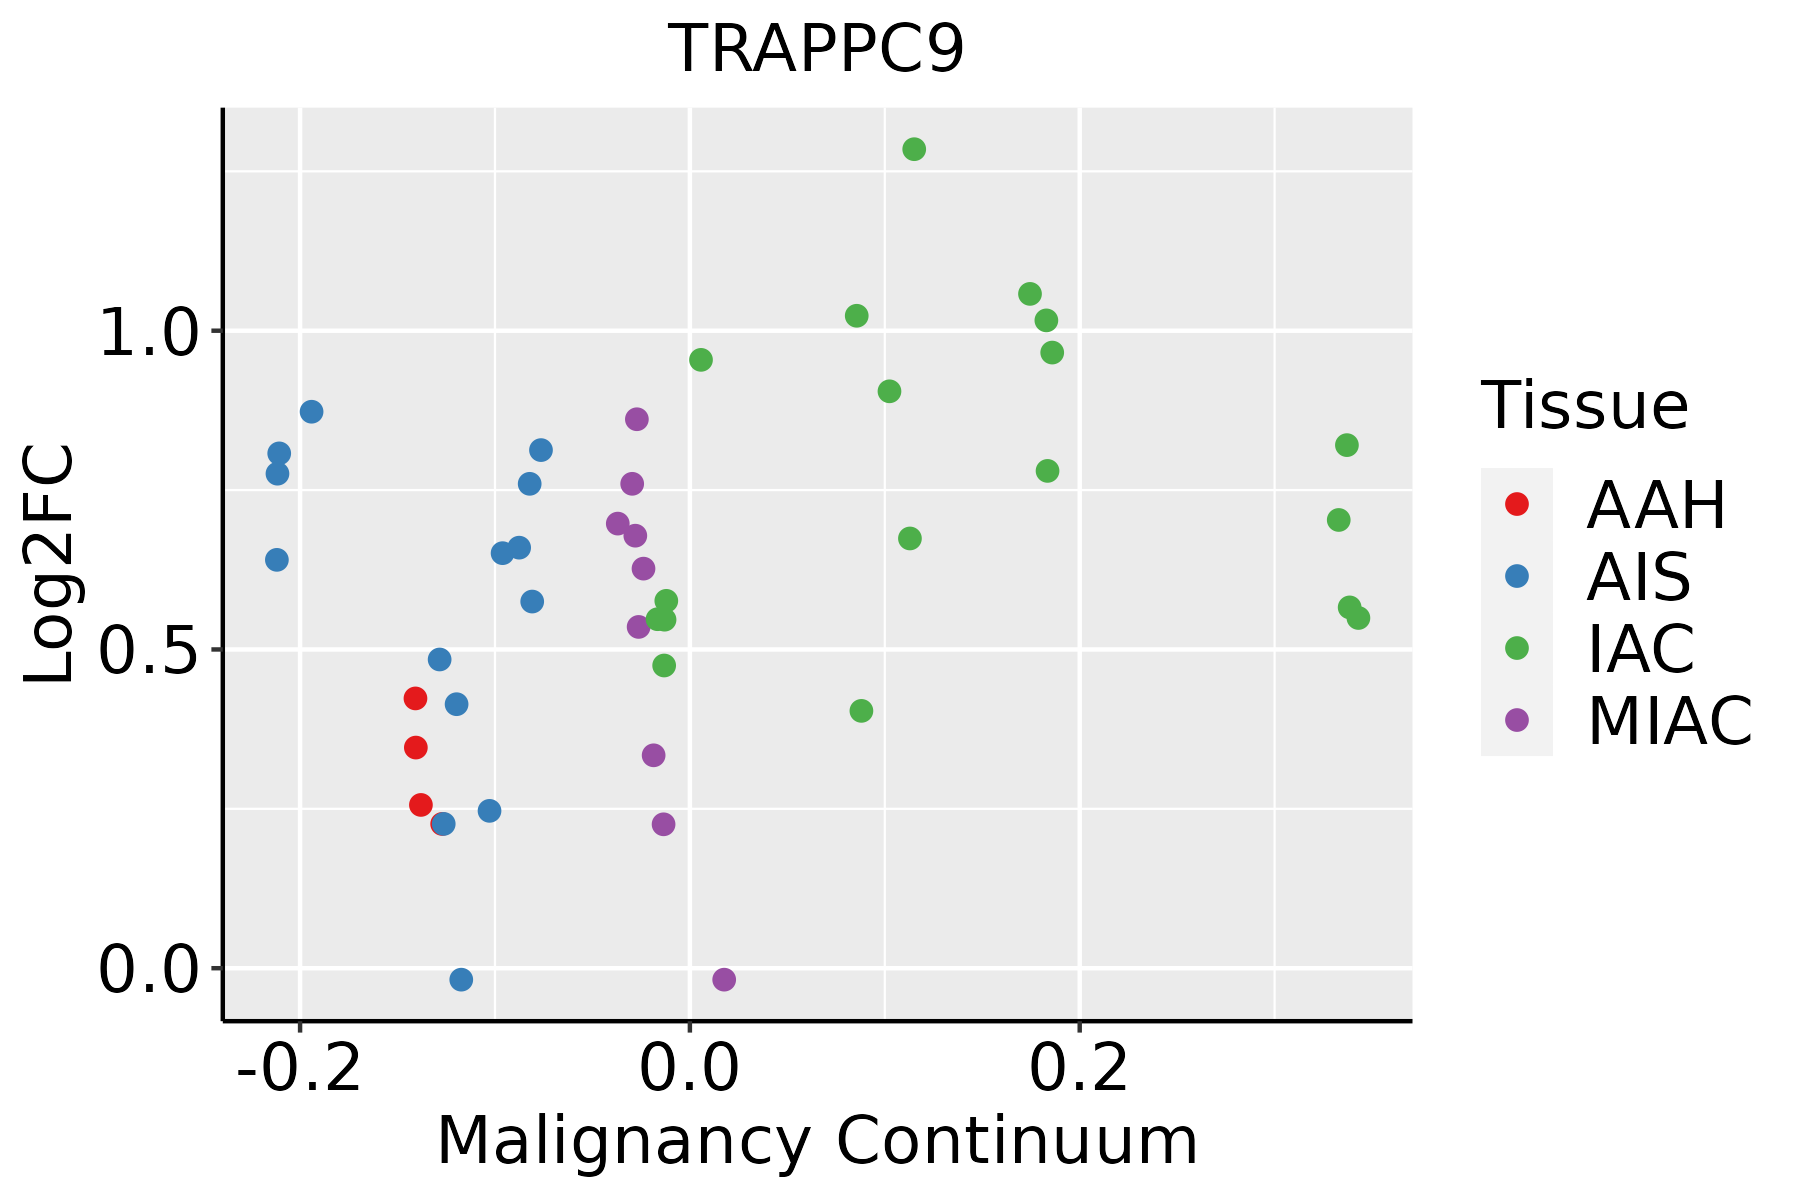 | AAH: Atypical adenomatous hyperplasia |
| AIS: Adenocarcinoma in situ |
| IAC: Invasive lung adenocarcinoma |
| MIA: Minimally invasive adenocarcinoma |
| GO ID | Tissue | Disease Stage | Description | Gene Ratio | Bg Ratio | pvalue | p.adjust | Count |
| GO:00510908 | Esophagus | ESCC | regulation of DNA-binding transcription factor activity | 252/8552 | 440/18723 | 5.22e-07 | 6.97e-06 | 252 |
| GO:00510918 | Esophagus | ESCC | positive regulation of DNA-binding transcription factor activity | 155/8552 | 260/18723 | 3.83e-06 | 4.14e-05 | 155 |
| GO:00510926 | Esophagus | ESCC | positive regulation of NF-kappaB transcription factor activity | 91/8552 | 152/18723 | 2.91e-04 | 1.75e-03 | 91 |
| GO:00215436 | Esophagus | ESCC | pallium development | 94/8552 | 169/18723 | 5.79e-03 | 2.14e-02 | 94 |
| GO:00510902 | Liver | HCC | regulation of DNA-binding transcription factor activity | 220/7958 | 440/18723 | 8.04e-04 | 4.82e-03 | 220 |
| GO:00510913 | Liver | HCC | positive regulation of DNA-binding transcription factor activity | 131/7958 | 260/18723 | 5.98e-03 | 2.45e-02 | 131 |
| GO:00510903 | Lung | IAC | regulation of DNA-binding transcription factor activity | 76/2061 | 440/18723 | 4.44e-05 | 1.05e-03 | 76 |
| GO:00510914 | Lung | IAC | positive regulation of DNA-binding transcription factor activity | 50/2061 | 260/18723 | 5.87e-05 | 1.29e-03 | 50 |
| GO:00219872 | Lung | IAC | cerebral cortex development | 27/2061 | 114/18723 | 8.78e-05 | 1.77e-03 | 27 |
| GO:0051092 | Lung | IAC | positive regulation of NF-kappaB transcription factor activity | 32/2061 | 152/18723 | 2.25e-04 | 3.90e-03 | 32 |
| GO:00215432 | Lung | IAC | pallium development | 33/2061 | 169/18723 | 7.51e-04 | 9.82e-03 | 33 |
| GO:00309002 | Lung | IAC | forebrain development | 61/2061 | 379/18723 | 1.52e-03 | 1.61e-02 | 61 |
| GO:00510921 | Lung | AIS | positive regulation of NF-kappaB transcription factor activity | 28/1849 | 152/18723 | 8.81e-04 | 1.19e-02 | 28 |
| GO:005109011 | Lung | AIS | regulation of DNA-binding transcription factor activity | 64/1849 | 440/18723 | 1.04e-03 | 1.36e-02 | 64 |
| GO:005109111 | Lung | AIS | positive regulation of DNA-binding transcription factor activity | 41/1849 | 260/18723 | 1.77e-03 | 2.01e-02 | 41 |
| GO:003090011 | Lung | AIS | forebrain development | 55/1849 | 379/18723 | 2.37e-03 | 2.48e-02 | 55 |
| Hugo Symbol | Variant Class | Variant Classification | dbSNP RS | HGVSc | HGVSp | HGVSp Short | SWISSPROT | BIOTYPE | SIFT | PolyPhen | Tumor Sample Barcode | Tissue | Histology | Sex | Age | Stage | Therapy Types | Drugs | Outcome |
| TRAPPC9 | SNV | Missense_Mutation | novel | c.2367N>G | p.Ile789Met | p.I789M | Q96Q05 | protein_coding | deleterious(0) | probably_damaging(0.935) | TCGA-A2-A0SU-01 | Breast | breast invasive carcinoma | Female | >=65 | I/II | Hormone Therapy | arimidex | SD |
| TRAPPC9 | SNV | Missense_Mutation | rs150200902 | c.3469N>A | p.Ala1157Thr | p.A1157T | Q96Q05 | protein_coding | tolerated(0.8) | possibly_damaging(0.714) | TCGA-A7-A26G-01 | Breast | breast invasive carcinoma | Female | <65 | I/II | Chemotherapy | taxotere | SD |
| TRAPPC9 | SNV | Missense_Mutation | rs750167029 | c.3572N>T | p.Ala1191Val | p.A1191V | Q96Q05 | protein_coding | tolerated(0.28) | benign(0.062) | TCGA-AC-A8OP-01 | Breast | breast invasive carcinoma | Female | >=65 | I/II | Unknown | Unknown | SD |
| TRAPPC9 | SNV | Missense_Mutation | rs145782440 | c.1471N>A | p.Glu491Lys | p.E491K | Q96Q05 | protein_coding | deleterious(0.01) | possibly_damaging(0.506) | TCGA-AN-A046-01 | Breast | breast invasive carcinoma | Female | >=65 | I/II | Unknown | Unknown | SD |
| TRAPPC9 | SNV | Missense_Mutation | | c.2752N>A | p.Leu918Met | p.L918M | Q96Q05 | protein_coding | tolerated(0.19) | possibly_damaging(0.584) | TCGA-AO-A128-01 | Breast | breast invasive carcinoma | Female | <65 | I/II | Chemotherapy | doxorubicin | SD |
| TRAPPC9 | SNV | Missense_Mutation | | c.1226N>A | p.Ile409Asn | p.I409N | Q96Q05 | protein_coding | tolerated(0.07) | possibly_damaging(0.538) | TCGA-BH-A209-01 | Breast | breast invasive carcinoma | Female | >=65 | I/II | Unknown | Unknown | SD |
| TRAPPC9 | SNV | Missense_Mutation | | c.2092N>A | p.Glu698Lys | p.E698K | Q96Q05 | protein_coding | deleterious(0) | possibly_damaging(0.81) | TCGA-D8-A1JA-01 | Breast | breast invasive carcinoma | Female | <65 | III/IV | Chemotherapy | adriamycin | PD |
| TRAPPC9 | SNV | Missense_Mutation | | c.1186C>T | p.Leu396Phe | p.L396F | Q96Q05 | protein_coding | deleterious(0.04) | probably_damaging(0.954) | TCGA-EW-A1OV-01 | Breast | breast invasive carcinoma | Female | <65 | I/II | Chemotherapy | epirubicin | SD |
| TRAPPC9 | SNV | Missense_Mutation | novel | c.116N>T | p.Ala39Val | p.A39V | Q96Q05 | protein_coding | deleterious_low_confidence(0) | benign(0) | TCGA-GM-A3XL-01 | Breast | breast invasive carcinoma | Female | <65 | I/II | Chemotherapy | fluorouracil | CR |
| TRAPPC9 | insertion | In_Frame_Ins | novel | c.1903_1904insCACACGGGAACAGGGCAGCTCCTCGCCCACACAAGCACT | p.Leu635delinsProHisGlyAsnArgAlaAlaProArgProHisLysHisPhe | p.L635delinsPHGNRAAPRPHKHF | Q96Q05 | protein_coding | | | TCGA-A2-A0EQ-01 | Breast | breast invasive carcinoma | Female | <65 | I/II | Chemotherapy | adriamycin | SD |


