
|
|||||
|
 | |
| |
| |
| |
| |
| |
|
Gene: TP53INP1 |
Gene summary for TP53INP1 |
| Gene information | Species | Human | Gene symbol | TP53INP1 | Gene ID | 94241 |
| Gene name | tumor protein p53 inducible nuclear protein 1 | |
| Gene Alias | SIP | |
| Cytomap | 8q22.1 | |
| Gene Type | protein-coding | GO ID | GO:0000045 | UniProtAcc | Q96A56 |
Top |
Malignant transformation analysis |
| Identification of the aberrant gene expression in precancerous and cancerous lesions by comparing the gene expression of stem-like cells in diseased tissues with normal stem cells |
| Entrez ID | Symbol | Replicates | Species | Organ | Tissue | Adj P-value | Log2FC | Malignancy |
| 94241 | TP53INP1 | LZE24T | Human | Esophagus | ESCC | 1.27e-21 | 6.26e-01 | 0.0596 |
| 94241 | TP53INP1 | P2T-E | Human | Esophagus | ESCC | 1.11e-08 | 1.35e-01 | 0.1177 |
| 94241 | TP53INP1 | P8T-E | Human | Esophagus | ESCC | 7.02e-11 | 1.46e-01 | 0.0889 |
| 94241 | TP53INP1 | P9T-E | Human | Esophagus | ESCC | 4.04e-06 | 9.56e-02 | 0.1131 |
| 94241 | TP53INP1 | P10T-E | Human | Esophagus | ESCC | 2.53e-16 | 3.30e-01 | 0.116 |
| 94241 | TP53INP1 | P12T-E | Human | Esophagus | ESCC | 5.98e-09 | 2.10e-01 | 0.1122 |
| 94241 | TP53INP1 | P15T-E | Human | Esophagus | ESCC | 4.78e-02 | 1.36e-01 | 0.1149 |
| 94241 | TP53INP1 | P16T-E | Human | Esophagus | ESCC | 2.52e-03 | 9.69e-02 | 0.1153 |
| 94241 | TP53INP1 | P20T-E | Human | Esophagus | ESCC | 4.49e-02 | 7.49e-02 | 0.1124 |
| 94241 | TP53INP1 | P21T-E | Human | Esophagus | ESCC | 7.13e-04 | 2.62e-02 | 0.1617 |
| 94241 | TP53INP1 | P22T-E | Human | Esophagus | ESCC | 3.09e-05 | 9.06e-02 | 0.1236 |
| 94241 | TP53INP1 | P23T-E | Human | Esophagus | ESCC | 2.02e-03 | 1.88e-01 | 0.108 |
| 94241 | TP53INP1 | P26T-E | Human | Esophagus | ESCC | 7.09e-04 | 4.77e-02 | 0.1276 |
| 94241 | TP53INP1 | P27T-E | Human | Esophagus | ESCC | 8.37e-08 | 2.14e-01 | 0.1055 |
| 94241 | TP53INP1 | P31T-E | Human | Esophagus | ESCC | 2.50e-09 | 2.06e-01 | 0.1251 |
| 94241 | TP53INP1 | P32T-E | Human | Esophagus | ESCC | 1.71e-02 | 1.75e-02 | 0.1666 |
| 94241 | TP53INP1 | P36T-E | Human | Esophagus | ESCC | 1.49e-05 | 1.65e-01 | 0.1187 |
| 94241 | TP53INP1 | P39T-E | Human | Esophagus | ESCC | 7.08e-04 | 8.66e-02 | 0.0894 |
| 94241 | TP53INP1 | P42T-E | Human | Esophagus | ESCC | 6.12e-03 | 1.10e-01 | 0.1175 |
| 94241 | TP53INP1 | P48T-E | Human | Esophagus | ESCC | 3.52e-05 | 7.99e-02 | 0.0959 |
| Page: 1 2 3 |
| Tissue | Expression Dynamics | Abbreviation |
| Esophagus |  | ESCC: Esophageal squamous cell carcinoma |
| HGIN: High-grade intraepithelial neoplasias | ||
| LGIN: Low-grade intraepithelial neoplasias | ||
| Liver |  | HCC: Hepatocellular carcinoma |
| NAFLD: Non-alcoholic fatty liver disease | ||
| Prostate | 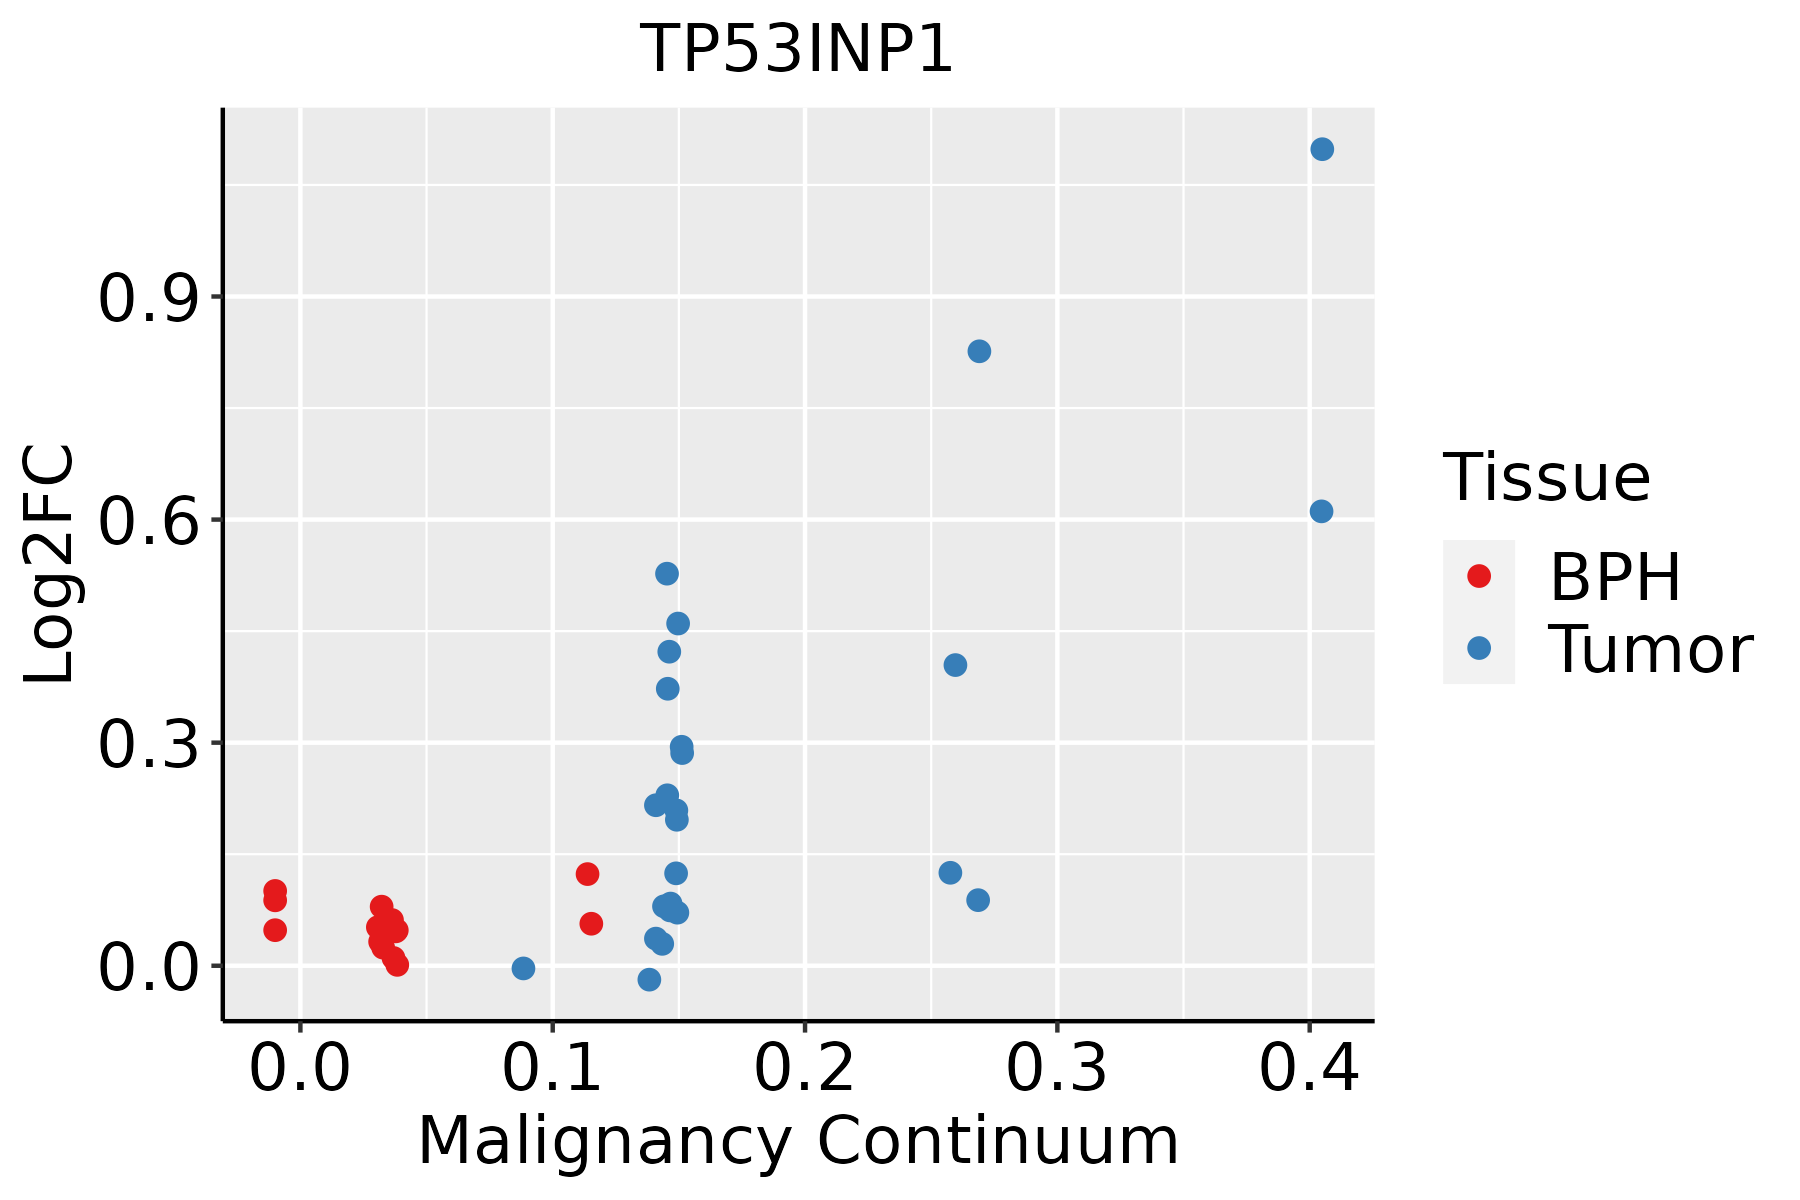 | BPH: Benign Prostatic Hyperplasia |
| Thyroid |  | ATC: Anaplastic thyroid cancer |
| HT: Hashimoto's thyroiditis | ||
| PTC: Papillary thyroid cancer |
| ∗log2FC in expression of this searched gene in stem-like cells from each diseased tissue sample relative to stem-like cells in normal samples in each tissue plotted against the malignancy continuum. Samples are colored based on if they are from different disease stage. |
Top |
Malignant transformation related pathway analysis |
| Find out the enriched GO biological processes and KEGG pathways involved in transition from healthy to precancer to cancer |
| Tissue | Disease Stage | Enriched GO biological Processes |
| Colorectum | AD |  |
| Colorectum | SER |  |
| Colorectum | MSS |  |
| Colorectum | MSI-H |  |
| Colorectum | FAP |  |
| ∗Top 15 enriched GO BP terms are showed in the bar plot of each disease state in each tissue. Each row represents a significant GO biological process which is colored according to the -log10(p.adjust). |
| Page: 1 2 3 4 5 6 7 8 9 |
| GO ID | Tissue | Disease Stage | Description | Gene Ratio | Bg Ratio | pvalue | p.adjust | Count |
| GO:000941611 | Esophagus | ESCC | response to light stimulus | 183/8552 | 320/18723 | 2.03e-05 | 1.76e-04 | 183 |
| GO:000963620 | Esophagus | ESCC | response to toxic substance | 150/8552 | 262/18723 | 1.00e-04 | 7.12e-04 | 150 |
| GO:000926619 | Esophagus | ESCC | response to temperature stimulus | 106/8552 | 178/18723 | 1.30e-04 | 8.84e-04 | 106 |
| GO:00714821 | Esophagus | ESCC | cellular response to light stimulus | 75/8552 | 123/18723 | 4.45e-04 | 2.50e-03 | 75 |
| GO:1990748110 | Esophagus | ESCC | cellular detoxification | 70/8552 | 116/18723 | 1.02e-03 | 5.17e-03 | 70 |
| GO:00481471 | Esophagus | ESCC | negative regulation of fibroblast proliferation | 22/8552 | 30/18723 | 1.98e-03 | 8.90e-03 | 22 |
| GO:00481023 | Esophagus | ESCC | autophagic cell death | 10/8552 | 11/18723 | 2.54e-03 | 1.08e-02 | 10 |
| GO:0097305111 | Esophagus | ESCC | response to alcohol | 138/8552 | 253/18723 | 2.70e-03 | 1.14e-02 | 138 |
| GO:0097237110 | Esophagus | ESCC | cellular response to toxic substance | 72/8552 | 124/18723 | 3.65e-03 | 1.49e-02 | 72 |
| GO:0098869110 | Esophagus | ESCC | cellular oxidant detoxification | 60/8552 | 101/18723 | 3.76e-03 | 1.53e-02 | 60 |
| GO:00098967 | Liver | NAFLD | positive regulation of catabolic process | 108/1882 | 492/18723 | 2.68e-15 | 3.14e-12 | 108 |
| GO:00313317 | Liver | NAFLD | positive regulation of cellular catabolic process | 92/1882 | 427/18723 | 1.01e-12 | 4.91e-10 | 92 |
| GO:00069797 | Liver | NAFLD | response to oxidative stress | 78/1882 | 446/18723 | 7.85e-07 | 4.29e-05 | 78 |
| GO:00105065 | Liver | NAFLD | regulation of autophagy | 57/1882 | 317/18723 | 1.00e-05 | 3.18e-04 | 57 |
| GO:00712145 | Liver | NAFLD | cellular response to abiotic stimulus | 56/1882 | 331/18723 | 7.01e-05 | 1.47e-03 | 56 |
| GO:01040045 | Liver | NAFLD | cellular response to environmental stimulus | 56/1882 | 331/18723 | 7.01e-05 | 1.47e-03 | 56 |
| GO:00105083 | Liver | NAFLD | positive regulation of autophagy | 26/1882 | 124/18723 | 2.20e-04 | 3.74e-03 | 26 |
| GO:00621977 | Liver | NAFLD | cellular response to chemical stress | 54/1882 | 337/18723 | 3.83e-04 | 5.73e-03 | 54 |
| GO:00973056 | Liver | NAFLD | response to alcohol | 42/1882 | 253/18723 | 7.91e-04 | 9.89e-03 | 42 |
| GO:00714783 | Liver | NAFLD | cellular response to radiation | 33/1882 | 186/18723 | 8.76e-04 | 1.07e-02 | 33 |
| Page: 1 2 3 4 5 6 7 8 9 10 11 12 |
| Pathway ID | Tissue | Disease Stage | Description | Gene Ratio | Bg Ratio | pvalue | p.adjust | qvalue | Count |
| Page: 1 |
Top |
Cell-cell communication analysis |
| Identification of potential cell-cell interactions between two cell types and their ligand-receptor pairs for different disease states |
| Ligand | Receptor | LRpair | Pathway | Tissue | Disease Stage |
| Page: 1 |
Top |
Single-cell gene regulatory network inference analysis |
| Find out the significant the regulons (TFs) and the target genes of each regulon across cell types for different disease states |
| TF | Cell Type | Tissue | Disease Stage | Target Gene | RSS | Regulon Activity |
| ∗The dot plots of a searched regulon are shown for all cell subpopulations in each disease state of each tissue based on the regulon specific score inferred using pySCENIC and by calculating the average expression. |
| Page: 1 |
Top |
Somatic mutation of malignant transformation related genes |
| Annotation of somatic variants for genes involved in malignant transformation |
| Hugo Symbol | Variant Class | Variant Classification | dbSNP RS | HGVSc | HGVSp | HGVSp Short | SWISSPROT | BIOTYPE | SIFT | PolyPhen | Tumor Sample Barcode | Tissue | Histology | Sex | Age | Stage | Therapy Types | Drugs | Outcome |
| TP53INP1 | SNV | Missense_Mutation | novel | c.379N>T | p.Pro127Ser | p.P127S | Q96A56 | protein_coding | deleterious(0) | probably_damaging(0.999) | TCGA-A2-A0EQ-01 | Breast | breast invasive carcinoma | Female | <65 | I/II | Chemotherapy | adriamycin | SD |
| TP53INP1 | SNV | Missense_Mutation | c.649N>A | p.Asp217Asn | p.D217N | Q96A56 | protein_coding | tolerated(0.13) | possibly_damaging(0.536) | TCGA-BH-A0HF-01 | Breast | breast invasive carcinoma | Female | >=65 | I/II | Hormone Therapy | arimidex | SD | |
| TP53INP1 | SNV | Missense_Mutation | novel | c.82N>T | p.Asp28Tyr | p.D28Y | Q96A56 | protein_coding | deleterious(0) | probably_damaging(0.983) | TCGA-OL-A6VQ-01 | Breast | breast invasive carcinoma | Female | <65 | I/II | Unknown | Unknown | SD |
| TP53INP1 | insertion | Frame_Shift_Ins | novel | c.511_512insATCAGTG | p.Cys171TyrfsTer32 | p.C171Yfs*32 | Q96A56 | protein_coding | TCGA-A2-A0D1-01 | Breast | breast invasive carcinoma | Female | >=65 | I/II | Chemotherapy | taxotere | SD | ||
| TP53INP1 | insertion | Frame_Shift_Ins | novel | c.509_510insACCAATTGATAACCAATCACATAGTT | p.His170GlnfsTer35 | p.H170Qfs*35 | Q96A56 | protein_coding | TCGA-A2-A0D1-01 | Breast | breast invasive carcinoma | Female | >=65 | I/II | Chemotherapy | taxotere | SD | ||
| TP53INP1 | insertion | In_Frame_Ins | novel | c.139_140insTCTTCTTTCTCTTCATTTATACCC | p.Glu47delinsValPhePheLeuPheIleTyrThrGln | p.E47delinsVFFLFIYTQ | Q96A56 | protein_coding | TCGA-AN-A046-01 | Breast | breast invasive carcinoma | Female | >=65 | I/II | Unknown | Unknown | SD | ||
| TP53INP1 | SNV | Missense_Mutation | c.136N>A | p.Glu46Lys | p.E46K | Q96A56 | protein_coding | tolerated(0.12) | benign(0.049) | TCGA-FU-A3YQ-01 | Cervix | cervical & endocervical cancer | Female | <65 | I/II | Unknown | Unknown | SD | |
| TP53INP1 | SNV | Missense_Mutation | novel | c.421N>T | p.Leu141Phe | p.L141F | Q96A56 | protein_coding | deleterious(0.02) | possibly_damaging(0.787) | TCGA-VS-A8QF-01 | Cervix | cervical & endocervical cancer | Female | <65 | I/II | Chemotherapy | cisplatin | CR |
| TP53INP1 | deletion | Frame_Shift_Del | novel | c.26_29delTTGT | p.Phe9TrpfsTer28 | p.F9Wfs*28 | Q96A56 | protein_coding | TCGA-VS-A959-01 | Cervix | cervical & endocervical cancer | Female | >=65 | I/II | Unknown | Unknown | SD | ||
| TP53INP1 | SNV | Missense_Mutation | c.649N>A | p.Asp217Asn | p.D217N | Q96A56 | protein_coding | tolerated(0.13) | possibly_damaging(0.536) | TCGA-AA-3837-01 | Colorectum | colon adenocarcinoma | Male | >=65 | I/II | Unknown | Unknown | SD |
| Page: 1 2 3 |
Top |
Related drugs of malignant transformation related genes |
| Identification of chemicals and drugs interact with genes involved in malignant transfromation |
| (DGIdb 4.0) |
| Entrez ID | Symbol | Category | Interaction Types | Drug Claim Name | Drug Name | PMIDs |
| Page: 1 |

Copyright 2023-Present -The University of Texas Health Science Center at Houston |