
|
|||||
|
 | |
| |
| |
| |
| |
| |
|
Gene: TOM1L2 |
Gene summary for TOM1L2 |
| Gene information | Species | Human | Gene symbol | TOM1L2 | Gene ID | 146691 |
| Gene name | target of myb1 like 2 membrane trafficking protein | |
| Gene Alias | TOM1L2 | |
| Cytomap | 17p11.2 | |
| Gene Type | protein-coding | GO ID | GO:0000278 | UniProtAcc | Q6ZVM7 |
Top |
Malignant transformation analysis |
| Identification of the aberrant gene expression in precancerous and cancerous lesions by comparing the gene expression of stem-like cells in diseased tissues with normal stem cells |
| Entrez ID | Symbol | Replicates | Species | Organ | Tissue | Adj P-value | Log2FC | Malignancy |
| 146691 | TOM1L2 | CCI_1 | Human | Cervix | CC | 6.30e-16 | 1.05e+00 | 0.528 |
| 146691 | TOM1L2 | CCI_2 | Human | Cervix | CC | 3.91e-11 | 8.89e-01 | 0.5249 |
| 146691 | TOM1L2 | CCI_3 | Human | Cervix | CC | 5.15e-16 | 7.21e-01 | 0.516 |
| 146691 | TOM1L2 | HTA11_2487_2000001011 | Human | Colorectum | SER | 6.16e-06 | 5.79e-01 | -0.1808 |
| 146691 | TOM1L2 | HTA11_1938_2000001011 | Human | Colorectum | AD | 1.40e-04 | 5.44e-01 | -0.0811 |
| 146691 | TOM1L2 | HTA11_347_2000001011 | Human | Colorectum | AD | 5.79e-11 | 5.90e-01 | -0.1954 |
| 146691 | TOM1L2 | HTA11_2112_2000001011 | Human | Colorectum | SER | 3.78e-02 | 7.54e-01 | -0.2196 |
| 146691 | TOM1L2 | HTA11_83_2000001011 | Human | Colorectum | SER | 1.82e-03 | 6.42e-01 | -0.1526 |
| 146691 | TOM1L2 | HTA11_1391_2000001011 | Human | Colorectum | AD | 4.03e-08 | 7.63e-01 | -0.059 |
| 146691 | TOM1L2 | HTA11_99999970781_79442 | Human | Colorectum | MSS | 3.28e-02 | -1.92e-01 | 0.294 |
| 146691 | TOM1L2 | A015-C-203 | Human | Colorectum | FAP | 1.86e-24 | -3.60e-01 | -0.1294 |
| 146691 | TOM1L2 | A015-C-204 | Human | Colorectum | FAP | 2.19e-03 | -2.52e-01 | -0.0228 |
| 146691 | TOM1L2 | A002-C-201 | Human | Colorectum | FAP | 6.86e-08 | -2.53e-01 | 0.0324 |
| 146691 | TOM1L2 | A002-C-203 | Human | Colorectum | FAP | 1.11e-02 | -9.96e-02 | 0.2786 |
| 146691 | TOM1L2 | A001-C-119 | Human | Colorectum | FAP | 2.98e-02 | -2.28e-01 | -0.1557 |
| 146691 | TOM1L2 | A001-C-108 | Human | Colorectum | FAP | 2.70e-10 | -2.39e-01 | -0.0272 |
| 146691 | TOM1L2 | A002-C-205 | Human | Colorectum | FAP | 1.59e-15 | -3.66e-01 | -0.1236 |
| 146691 | TOM1L2 | A015-C-005 | Human | Colorectum | FAP | 6.54e-06 | -3.48e-01 | -0.0336 |
| 146691 | TOM1L2 | A015-C-006 | Human | Colorectum | FAP | 5.42e-12 | -4.62e-01 | -0.0994 |
| 146691 | TOM1L2 | A015-C-106 | Human | Colorectum | FAP | 4.18e-07 | -2.19e-01 | -0.0511 |
| Page: 1 2 3 4 5 6 7 |
| Tissue | Expression Dynamics | Abbreviation |
| Cervix |  | CC: Cervix cancer |
| HSIL_HPV: HPV-infected high-grade squamous intraepithelial lesions | ||
| N_HPV: HPV-infected normal cervix | ||
| Colorectum (GSE201348) |  | FAP: Familial adenomatous polyposis |
| CRC: Colorectal cancer | ||
| Colorectum (HTA11) |  | AD: Adenomas |
| SER: Sessile serrated lesions | ||
| MSI-H: Microsatellite-high colorectal cancer | ||
| MSS: Microsatellite stable colorectal cancer | ||
| Esophagus |  | ESCC: Esophageal squamous cell carcinoma |
| HGIN: High-grade intraepithelial neoplasias | ||
| LGIN: Low-grade intraepithelial neoplasias | ||
| Oral Cavity | 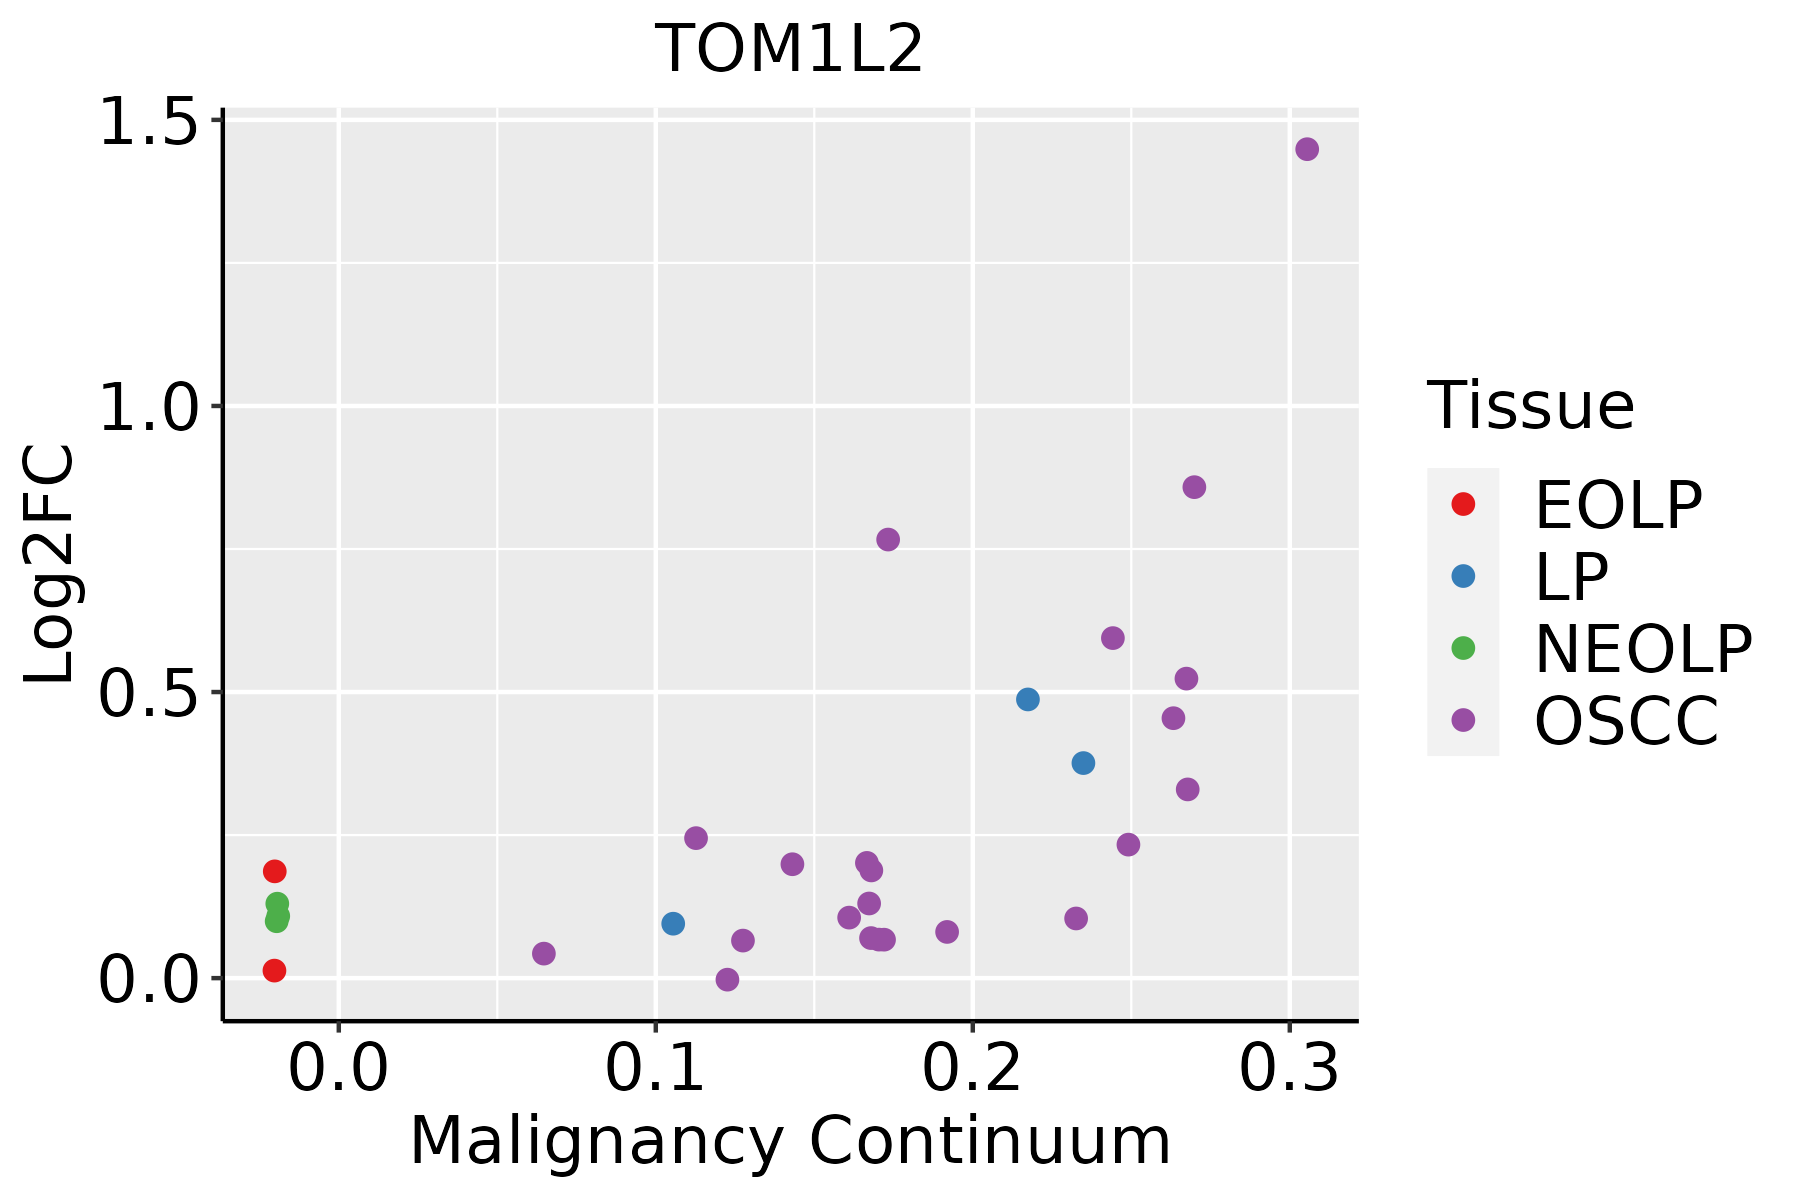 | EOLP: Erosive Oral lichen planus |
| LP: leukoplakia | ||
| NEOLP: Non-erosive oral lichen planus | ||
| OSCC: Oral squamous cell carcinoma | ||
| Prostate | 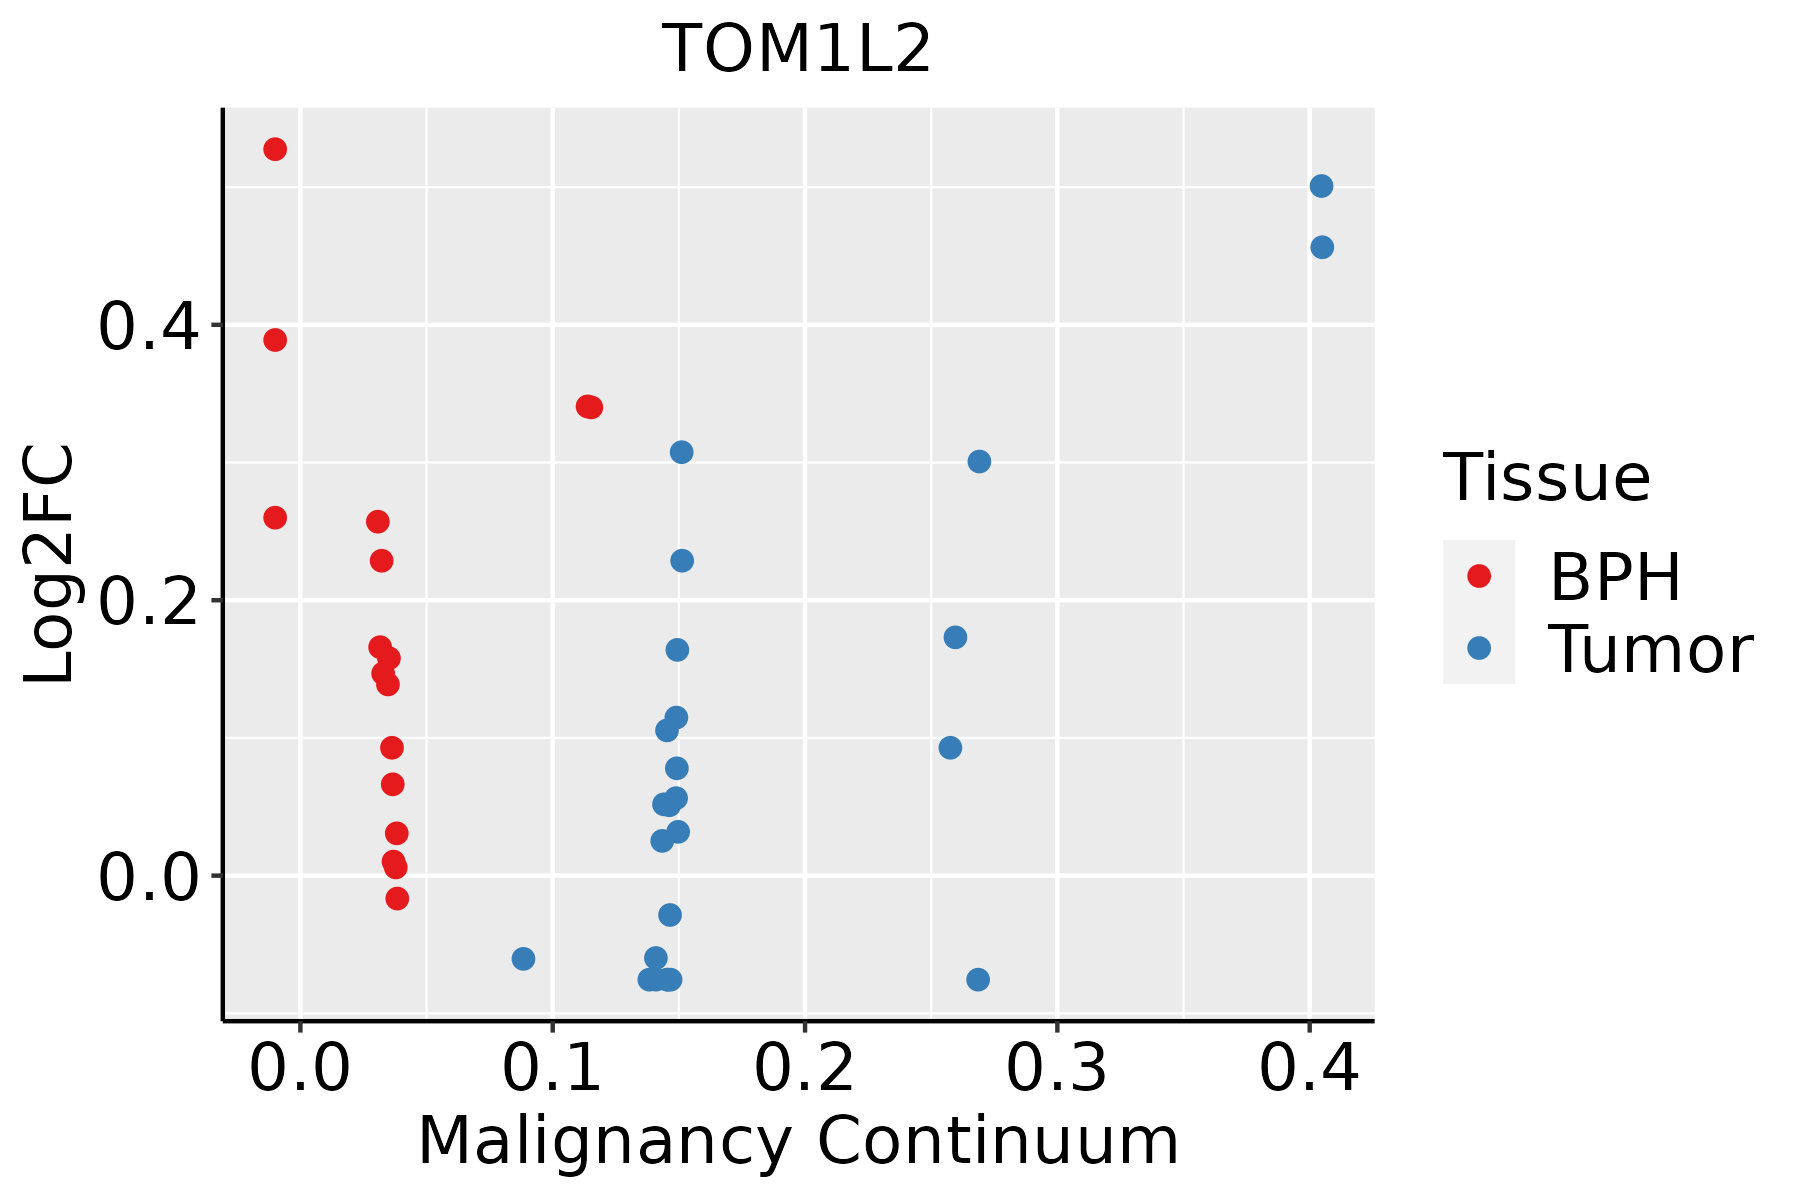 | BPH: Benign Prostatic Hyperplasia |
| Skin | 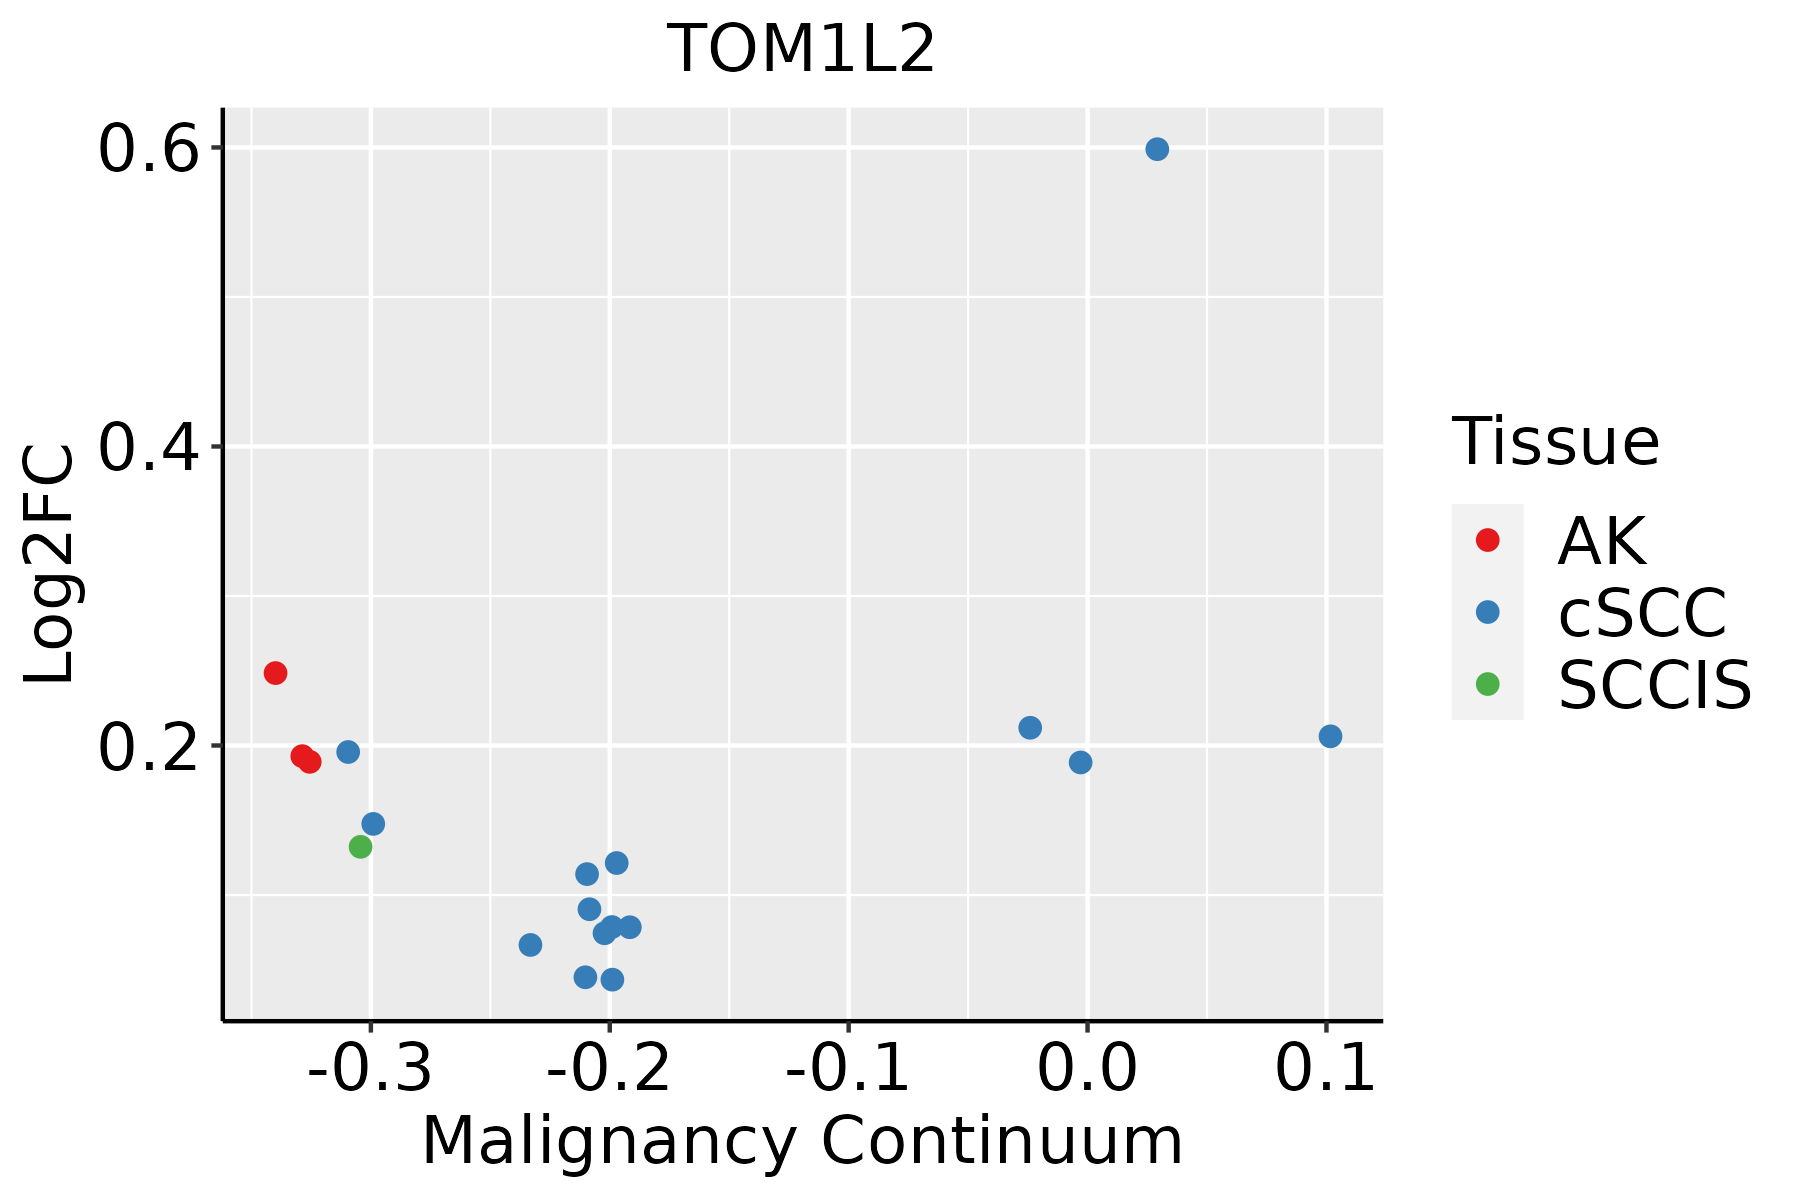 | AK: Actinic keratosis |
| cSCC: Cutaneous squamous cell carcinoma | ||
| SCCIS:squamous cell carcinoma in situ | ||
| Thyroid | 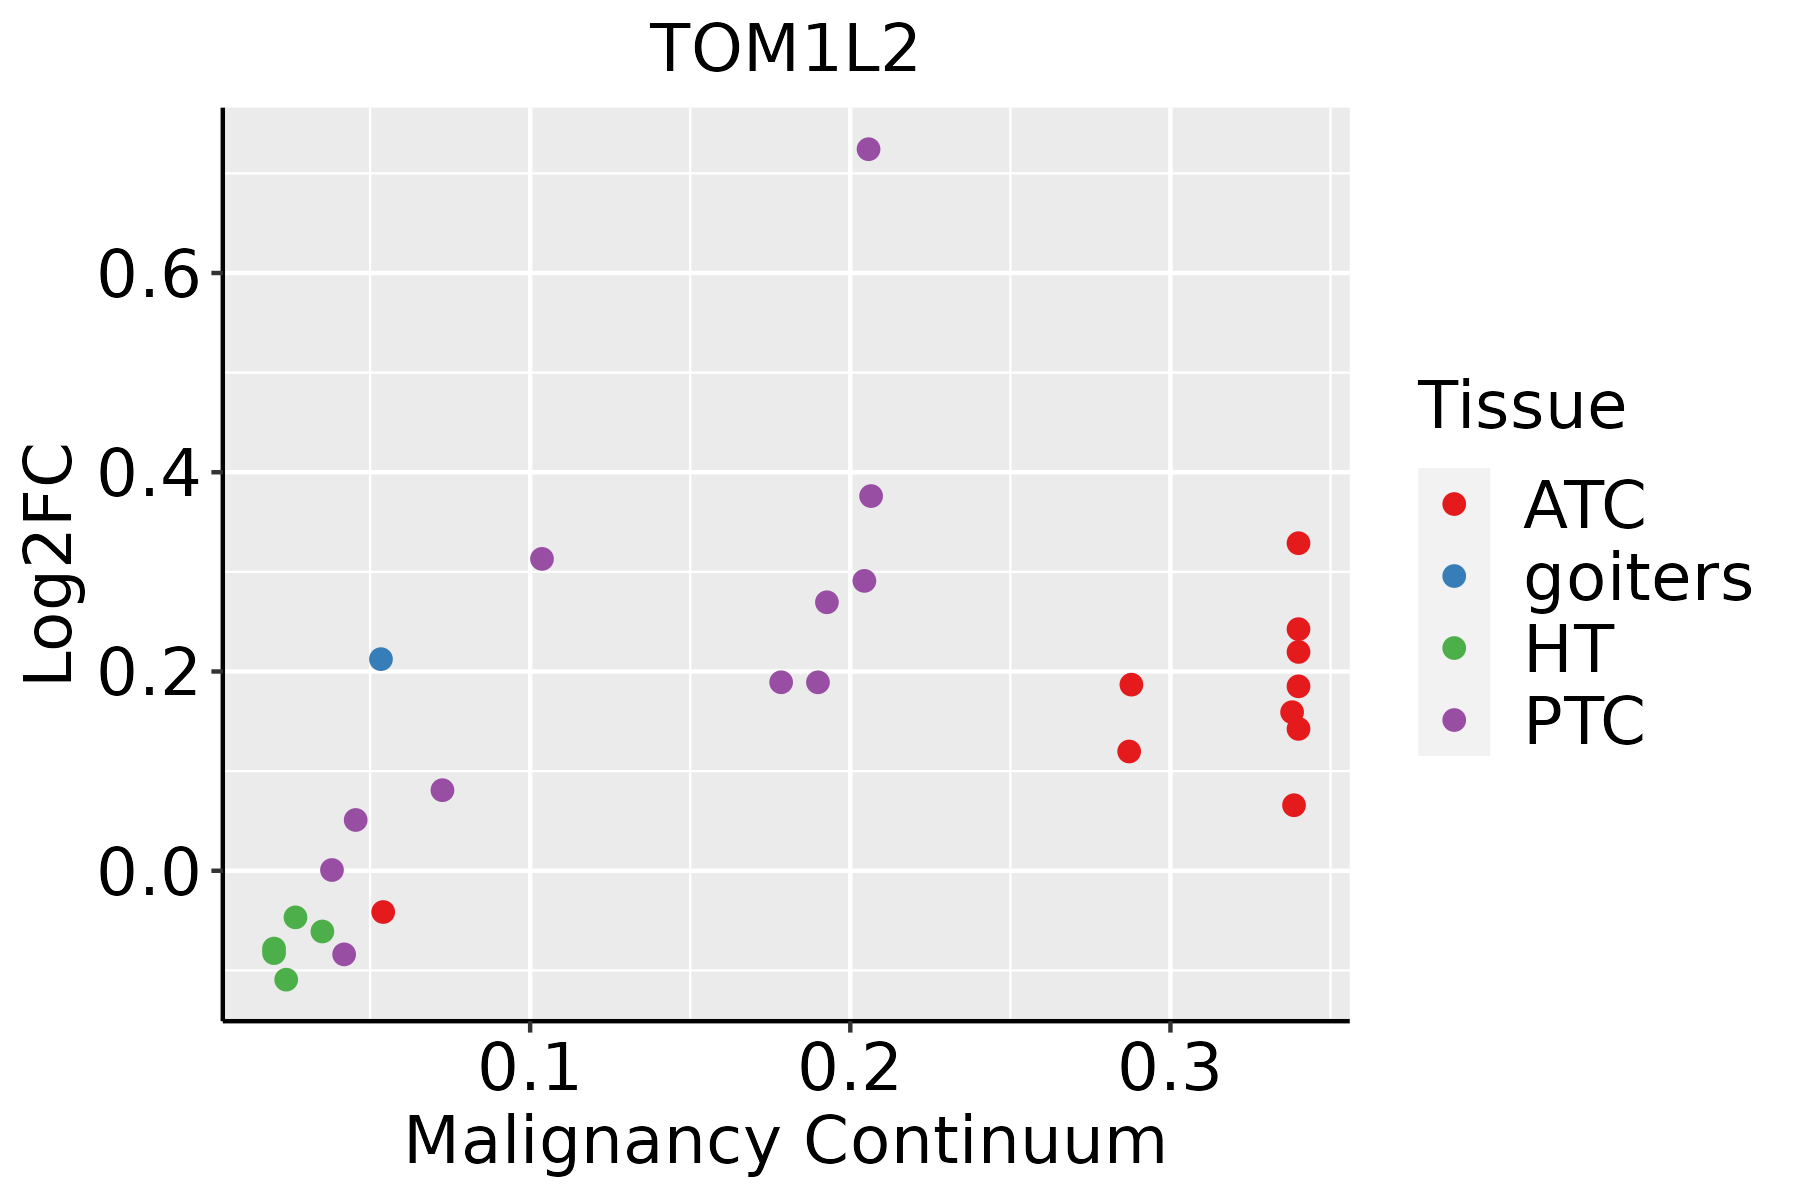 | ATC: Anaplastic thyroid cancer |
| HT: Hashimoto's thyroiditis | ||
| PTC: Papillary thyroid cancer |
| ∗log2FC in expression of this searched gene in stem-like cells from each diseased tissue sample relative to stem-like cells in normal samples in each tissue plotted against the malignancy continuum. Samples are colored based on if they are from different disease stage. |
Top |
Malignant transformation related pathway analysis |
| Find out the enriched GO biological processes and KEGG pathways involved in transition from healthy to precancer to cancer |
| Tissue | Disease Stage | Enriched GO biological Processes |
| Colorectum | AD |  |
| Colorectum | SER |  |
| Colorectum | MSS |  |
| Colorectum | MSI-H |  |
| Colorectum | FAP |  |
| ∗Top 15 enriched GO BP terms are showed in the bar plot of each disease state in each tissue. Each row represents a significant GO biological process which is colored according to the -log10(p.adjust). |
| Page: 1 2 3 4 5 6 7 8 9 |
| GO ID | Tissue | Disease Stage | Description | Gene Ratio | Bg Ratio | pvalue | p.adjust | Count |
| GO:00459305 | Esophagus | HGIN | negative regulation of mitotic cell cycle | 49/2587 | 235/18723 | 1.88e-03 | 2.01e-02 | 49 |
| GO:014001414 | Esophagus | ESCC | mitotic nuclear division | 218/8552 | 287/18723 | 6.17e-26 | 1.78e-23 | 218 |
| GO:000734615 | Esophagus | ESCC | regulation of mitotic cell cycle | 293/8552 | 457/18723 | 8.00e-16 | 5.64e-14 | 293 |
| GO:00482853 | Esophagus | ESCC | organelle fission | 301/8552 | 488/18723 | 4.64e-13 | 2.12e-11 | 301 |
| GO:00002802 | Esophagus | ESCC | nuclear division | 270/8552 | 439/18723 | 1.17e-11 | 4.24e-10 | 270 |
| GO:00457865 | Esophagus | ESCC | negative regulation of cell cycle | 236/8552 | 385/18723 | 3.62e-10 | 9.93e-09 | 236 |
| GO:0010639110 | Esophagus | ESCC | negative regulation of organelle organization | 215/8552 | 348/18723 | 8.20e-10 | 2.01e-08 | 215 |
| GO:00070883 | Esophagus | ESCC | regulation of mitotic nuclear division | 78/8552 | 110/18723 | 6.96e-08 | 1.21e-06 | 78 |
| GO:00109484 | Esophagus | ESCC | negative regulation of cell cycle process | 177/8552 | 294/18723 | 3.26e-07 | 4.59e-06 | 177 |
| GO:004593013 | Esophagus | ESCC | negative regulation of mitotic cell cycle | 143/8552 | 235/18723 | 1.84e-06 | 2.15e-05 | 143 |
| GO:00517831 | Esophagus | ESCC | regulation of nuclear division | 90/8552 | 139/18723 | 4.30e-06 | 4.60e-05 | 90 |
| GO:00458393 | Esophagus | ESCC | negative regulation of mitotic nuclear division | 37/8552 | 48/18723 | 8.99e-06 | 8.65e-05 | 37 |
| GO:00517843 | Esophagus | ESCC | negative regulation of nuclear division | 41/8552 | 56/18723 | 2.64e-05 | 2.21e-04 | 41 |
| GO:01400145 | Oral cavity | OSCC | mitotic nuclear division | 191/7305 | 287/18723 | 1.99e-21 | 3.70e-19 | 191 |
| GO:00073469 | Oral cavity | OSCC | regulation of mitotic cell cycle | 266/7305 | 457/18723 | 3.87e-17 | 3.41e-15 | 266 |
| GO:00482852 | Oral cavity | OSCC | organelle fission | 265/7305 | 488/18723 | 3.22e-12 | 1.27e-10 | 265 |
| GO:00002801 | Oral cavity | OSCC | nuclear division | 237/7305 | 439/18723 | 9.62e-11 | 2.90e-09 | 237 |
| GO:001063918 | Oral cavity | OSCC | negative regulation of organelle organization | 190/7305 | 348/18723 | 2.12e-09 | 4.97e-08 | 190 |
| GO:00457864 | Oral cavity | OSCC | negative regulation of cell cycle | 206/7305 | 385/18723 | 4.28e-09 | 9.55e-08 | 206 |
| GO:00459304 | Oral cavity | OSCC | negative regulation of mitotic cell cycle | 132/7305 | 235/18723 | 6.51e-08 | 1.16e-06 | 132 |
| Page: 1 2 3 4 5 6 |
| Pathway ID | Tissue | Disease Stage | Description | Gene Ratio | Bg Ratio | pvalue | p.adjust | qvalue | Count |
| Page: 1 |
Top |
Cell-cell communication analysis |
| Identification of potential cell-cell interactions between two cell types and their ligand-receptor pairs for different disease states |
| Ligand | Receptor | LRpair | Pathway | Tissue | Disease Stage |
| Page: 1 |
Top |
Single-cell gene regulatory network inference analysis |
| Find out the significant the regulons (TFs) and the target genes of each regulon across cell types for different disease states |
| TF | Cell Type | Tissue | Disease Stage | Target Gene | RSS | Regulon Activity |
| ∗The dot plots of a searched regulon are shown for all cell subpopulations in each disease state of each tissue based on the regulon specific score inferred using pySCENIC and by calculating the average expression. |
| Page: 1 |
Top |
Somatic mutation of malignant transformation related genes |
| Annotation of somatic variants for genes involved in malignant transformation |
| Hugo Symbol | Variant Class | Variant Classification | dbSNP RS | HGVSc | HGVSp | HGVSp Short | SWISSPROT | BIOTYPE | SIFT | PolyPhen | Tumor Sample Barcode | Tissue | Histology | Sex | Age | Stage | Therapy Types | Drugs | Outcome |
| TOM1L2 | SNV | Missense_Mutation | c.812N>A | p.Arg271His | p.R271H | Q6ZVM7 | protein_coding | deleterious(0) | probably_damaging(0.999) | TCGA-AN-A0AK-01 | Breast | breast invasive carcinoma | Female | >=65 | I/II | Unknown | Unknown | SD | |
| TOM1L2 | insertion | Frame_Shift_Ins | novel | c.995_996insGGTGGGAAGATCACTTGAGGCCAGGTGTTTGAGACCAG | p.Asp332GlufsTer23 | p.D332Efs*23 | Q6ZVM7 | protein_coding | TCGA-A8-A0A2-01 | Breast | breast invasive carcinoma | Female | >=65 | I/II | Hormone Therapy | tamoxiphen | SD | ||
| TOM1L2 | insertion | In_Frame_Ins | novel | c.965_966insTGG | p.Leu322_Asn323insGly | p.L322_N323insG | Q6ZVM7 | protein_coding | TCGA-AN-A0FK-01 | Breast | breast invasive carcinoma | Female | >=65 | III/IV | Unknown | Unknown | SD | ||
| TOM1L2 | insertion | Frame_Shift_Ins | novel | c.963_964insATATCTACAGAGGG | p.Leu322IlefsTer6 | p.L322Ifs*6 | Q6ZVM7 | protein_coding | TCGA-AN-A0FK-01 | Breast | breast invasive carcinoma | Female | >=65 | III/IV | Unknown | Unknown | SD | ||
| TOM1L2 | SNV | Missense_Mutation | c.1289N>T | p.Ala430Val | p.A430V | Q6ZVM7 | protein_coding | tolerated(0.29) | benign(0.001) | TCGA-A6-2686-01 | Colorectum | colon adenocarcinoma | Female | >=65 | I/II | Unknown | Unknown | SD | |
| TOM1L2 | SNV | Missense_Mutation | novel | c.1400N>T | p.Arg467Ile | p.R467I | Q6ZVM7 | protein_coding | deleterious(0) | probably_damaging(0.999) | TCGA-AA-A00N-01 | Colorectum | colon adenocarcinoma | Male | >=65 | I/II | Unknown | Unknown | PD |
| TOM1L2 | SNV | Missense_Mutation | c.449A>C | p.Glu150Ala | p.E150A | Q6ZVM7 | protein_coding | deleterious(0) | probably_damaging(0.997) | TCGA-AA-A010-01 | Colorectum | colon adenocarcinoma | Female | <65 | I/II | Chemotherapy | folinic | CR | |
| TOM1L2 | SNV | Missense_Mutation | c.184C>T | p.Arg62Trp | p.R62W | Q6ZVM7 | protein_coding | deleterious(0) | probably_damaging(0.926) | TCGA-CK-4951-01 | Colorectum | colon adenocarcinoma | Female | >=65 | I/II | Unknown | Unknown | PD | |
| TOM1L2 | SNV | Missense_Mutation | c.1496N>A | p.Arg499Gln | p.R499Q | Q6ZVM7 | protein_coding | tolerated(0.11) | benign(0.067) | TCGA-CM-6171-01 | Colorectum | colon adenocarcinoma | Female | >=65 | I/II | Unknown | Unknown | SD | |
| TOM1L2 | SNV | Missense_Mutation | c.538N>G | p.Arg180Gly | p.R180G | Q6ZVM7 | protein_coding | tolerated(0.46) | benign(0) | TCGA-CM-6674-01 | Colorectum | colon adenocarcinoma | Male | <65 | I/II | Unknown | Unknown | SD |
| Page: 1 2 3 4 5 |
Top |
Related drugs of malignant transformation related genes |
| Identification of chemicals and drugs interact with genes involved in malignant transfromation |
| (DGIdb 4.0) |
| Entrez ID | Symbol | Category | Interaction Types | Drug Claim Name | Drug Name | PMIDs |
| Page: 1 |

Copyright 2023-Present -The University of Texas Health Science Center at Houston |