
|
|||||
|
 | |
| |
| |
| |
| |
| |
|
Gene: TOB2 |
Gene summary for TOB2 |
| Gene information | Species | Human | Gene symbol | TOB2 | Gene ID | 10766 |
| Gene name | transducer of ERBB2, 2 | |
| Gene Alias | APRO5 | |
| Cytomap | 22q13.2 | |
| Gene Type | protein-coding | GO ID | GO:0000003 | UniProtAcc | Q14106 |
Top |
Malignant transformation analysis |
| Identification of the aberrant gene expression in precancerous and cancerous lesions by comparing the gene expression of stem-like cells in diseased tissues with normal stem cells |
| Entrez ID | Symbol | Replicates | Species | Organ | Tissue | Adj P-value | Log2FC | Malignancy |
| 10766 | TOB2 | HTA11_1938_2000001011 | Human | Colorectum | AD | 5.45e-06 | 5.01e-01 | -0.0811 |
| 10766 | TOB2 | HTA11_78_2000001011 | Human | Colorectum | AD | 1.52e-02 | 3.42e-01 | -0.1088 |
| 10766 | TOB2 | HTA11_347_2000001011 | Human | Colorectum | AD | 2.32e-07 | 4.05e-01 | -0.1954 |
| 10766 | TOB2 | HTA11_696_2000001011 | Human | Colorectum | AD | 8.84e-05 | 3.31e-01 | -0.1464 |
| 10766 | TOB2 | HTA11_866_2000001011 | Human | Colorectum | AD | 1.86e-02 | 2.52e-01 | -0.1001 |
| 10766 | TOB2 | HTA11_1391_2000001011 | Human | Colorectum | AD | 1.05e-09 | 6.02e-01 | -0.059 |
| 10766 | TOB2 | HTA11_7696_3000711011 | Human | Colorectum | AD | 7.11e-03 | 2.19e-01 | 0.0674 |
| 10766 | TOB2 | HTA11_99999970781_79442 | Human | Colorectum | MSS | 3.43e-05 | 4.24e-01 | 0.294 |
| 10766 | TOB2 | LZE4T | Human | Esophagus | ESCC | 3.07e-07 | 4.75e-02 | 0.0811 |
| 10766 | TOB2 | LZE5T | Human | Esophagus | ESCC | 4.58e-06 | 1.23e-02 | 0.0514 |
| 10766 | TOB2 | LZE7T | Human | Esophagus | ESCC | 5.37e-03 | 3.49e-01 | 0.0667 |
| 10766 | TOB2 | LZE8T | Human | Esophagus | ESCC | 9.67e-04 | 1.21e-01 | 0.067 |
| 10766 | TOB2 | LZE20T | Human | Esophagus | ESCC | 6.71e-07 | 6.78e-02 | 0.0662 |
| 10766 | TOB2 | LZE22D1 | Human | Esophagus | HGIN | 1.16e-02 | -1.68e-01 | 0.0595 |
| 10766 | TOB2 | LZE22T | Human | Esophagus | ESCC | 4.63e-05 | 3.87e-02 | 0.068 |
| 10766 | TOB2 | LZE24T | Human | Esophagus | ESCC | 4.65e-09 | 5.13e-01 | 0.0596 |
| 10766 | TOB2 | LZE6T | Human | Esophagus | ESCC | 2.34e-05 | -9.95e-02 | 0.0845 |
| 10766 | TOB2 | P1T-E | Human | Esophagus | ESCC | 1.64e-03 | 6.05e-01 | 0.0875 |
| 10766 | TOB2 | P2T-E | Human | Esophagus | ESCC | 9.15e-16 | 2.75e-01 | 0.1177 |
| 10766 | TOB2 | P4T-E | Human | Esophagus | ESCC | 1.71e-18 | 3.87e-01 | 0.1323 |
| Page: 1 2 3 4 5 6 7 |
| Tissue | Expression Dynamics | Abbreviation |
| Colorectum (GSE201348) | 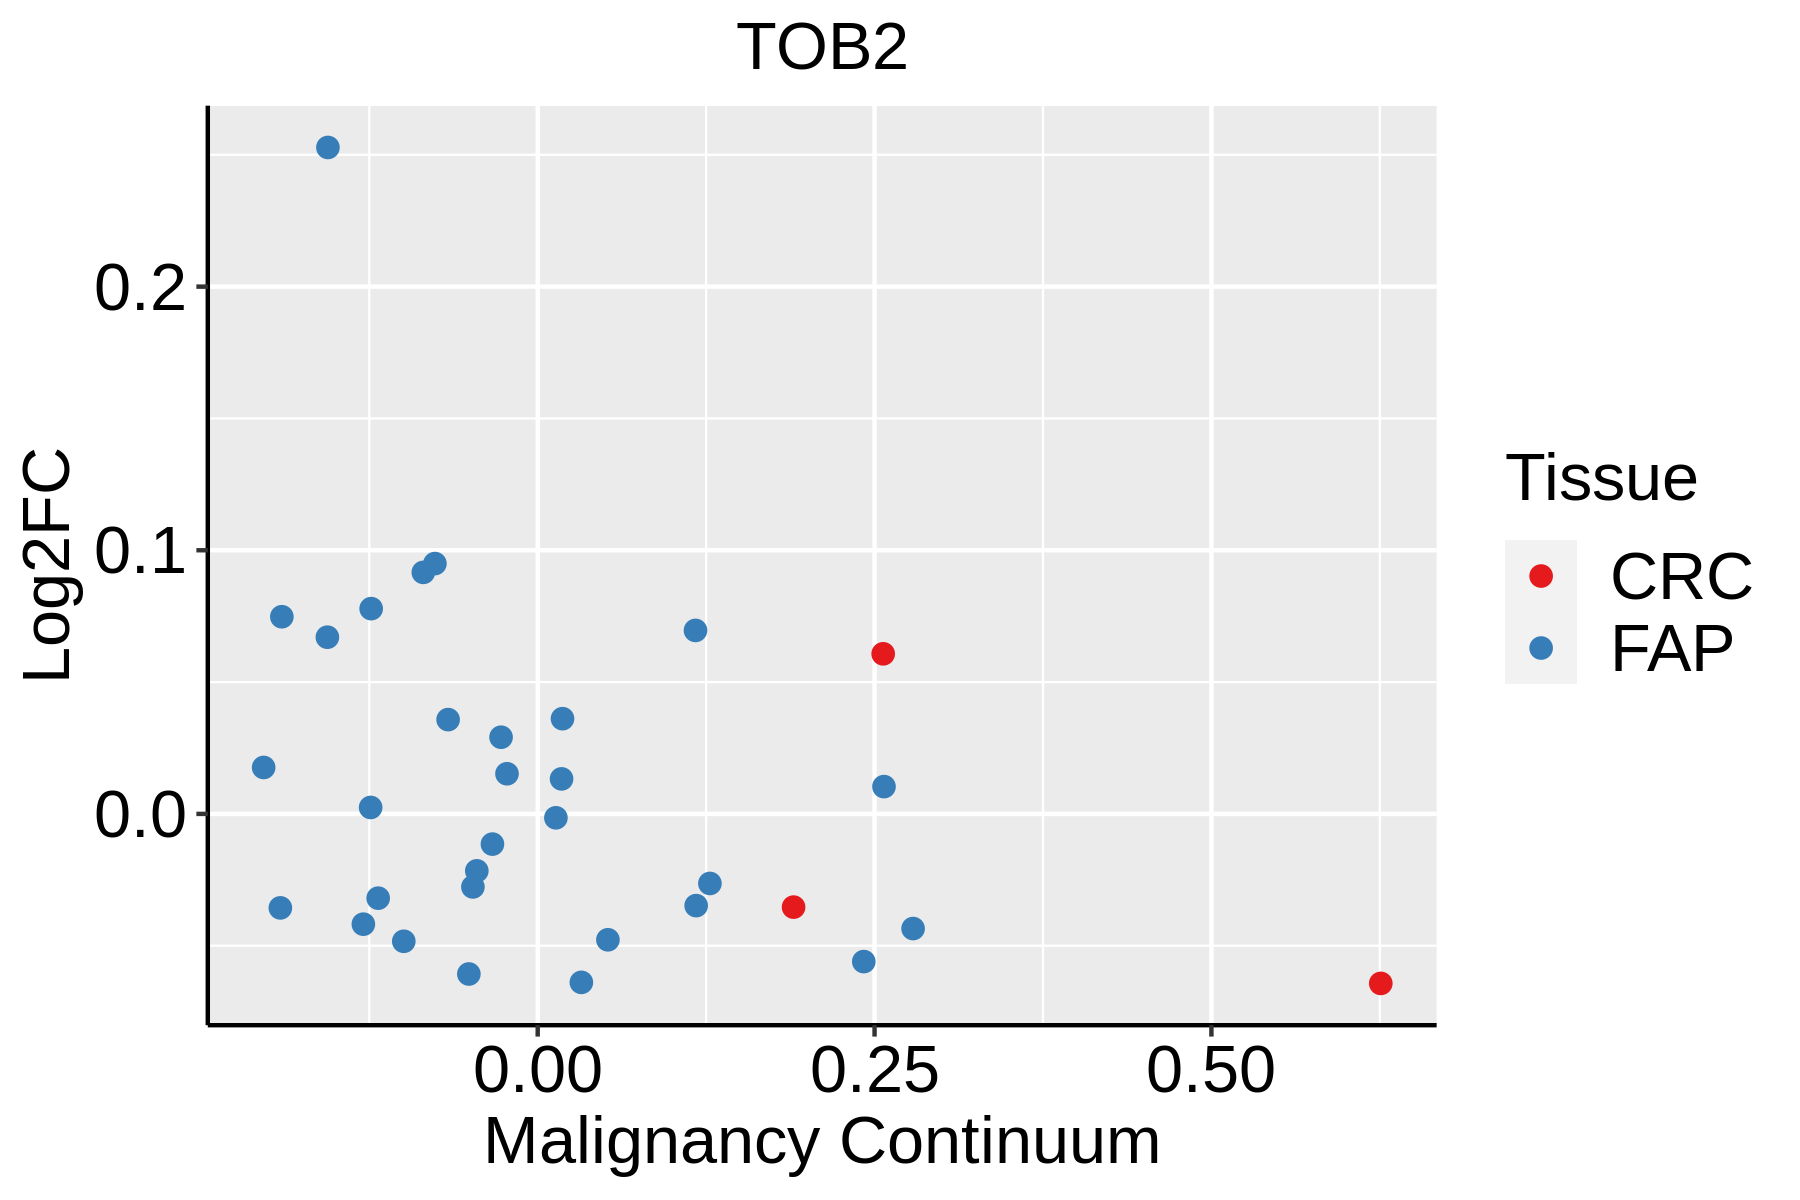 | FAP: Familial adenomatous polyposis |
| CRC: Colorectal cancer | ||
| Colorectum (HTA11) |  | AD: Adenomas |
| SER: Sessile serrated lesions | ||
| MSI-H: Microsatellite-high colorectal cancer | ||
| MSS: Microsatellite stable colorectal cancer | ||
| Esophagus | 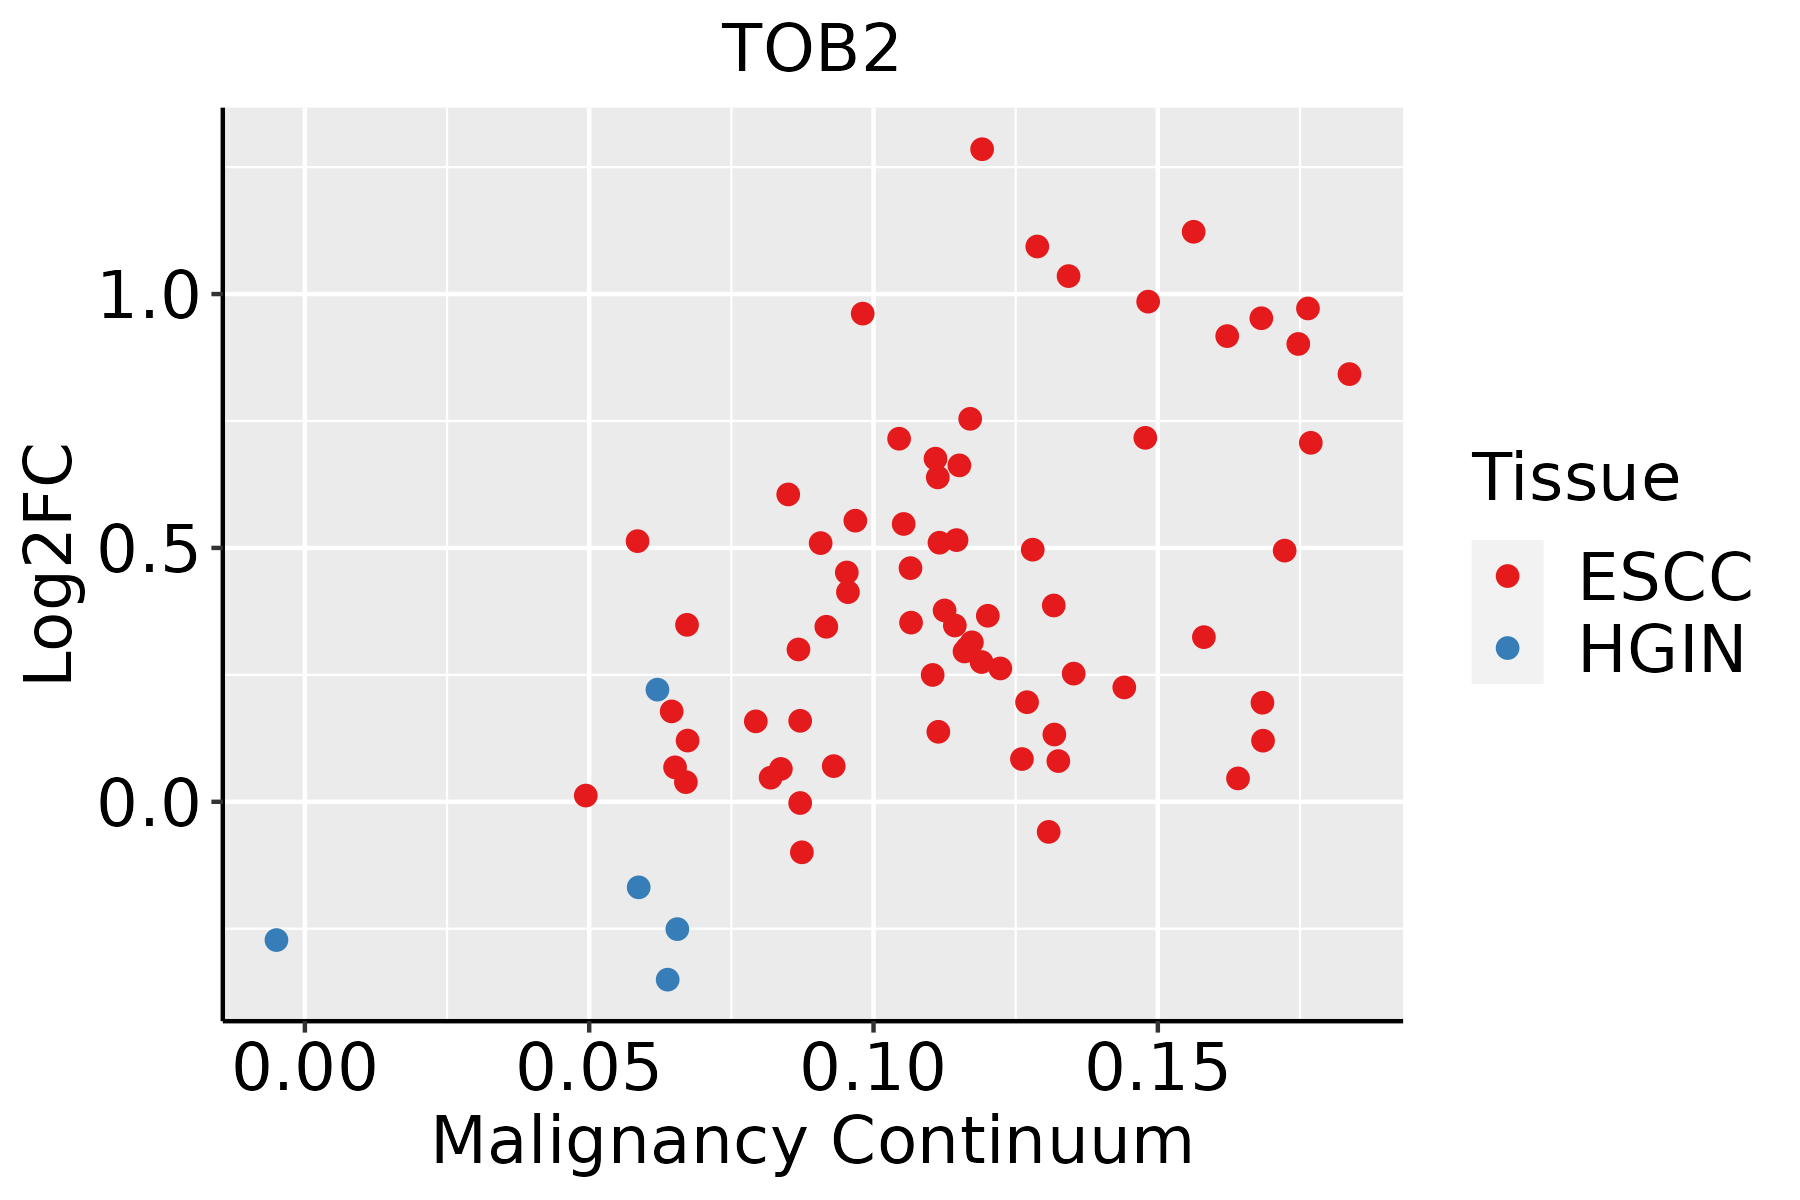 | ESCC: Esophageal squamous cell carcinoma |
| HGIN: High-grade intraepithelial neoplasias | ||
| LGIN: Low-grade intraepithelial neoplasias | ||
| Liver |  | HCC: Hepatocellular carcinoma |
| NAFLD: Non-alcoholic fatty liver disease | ||
| Oral Cavity | 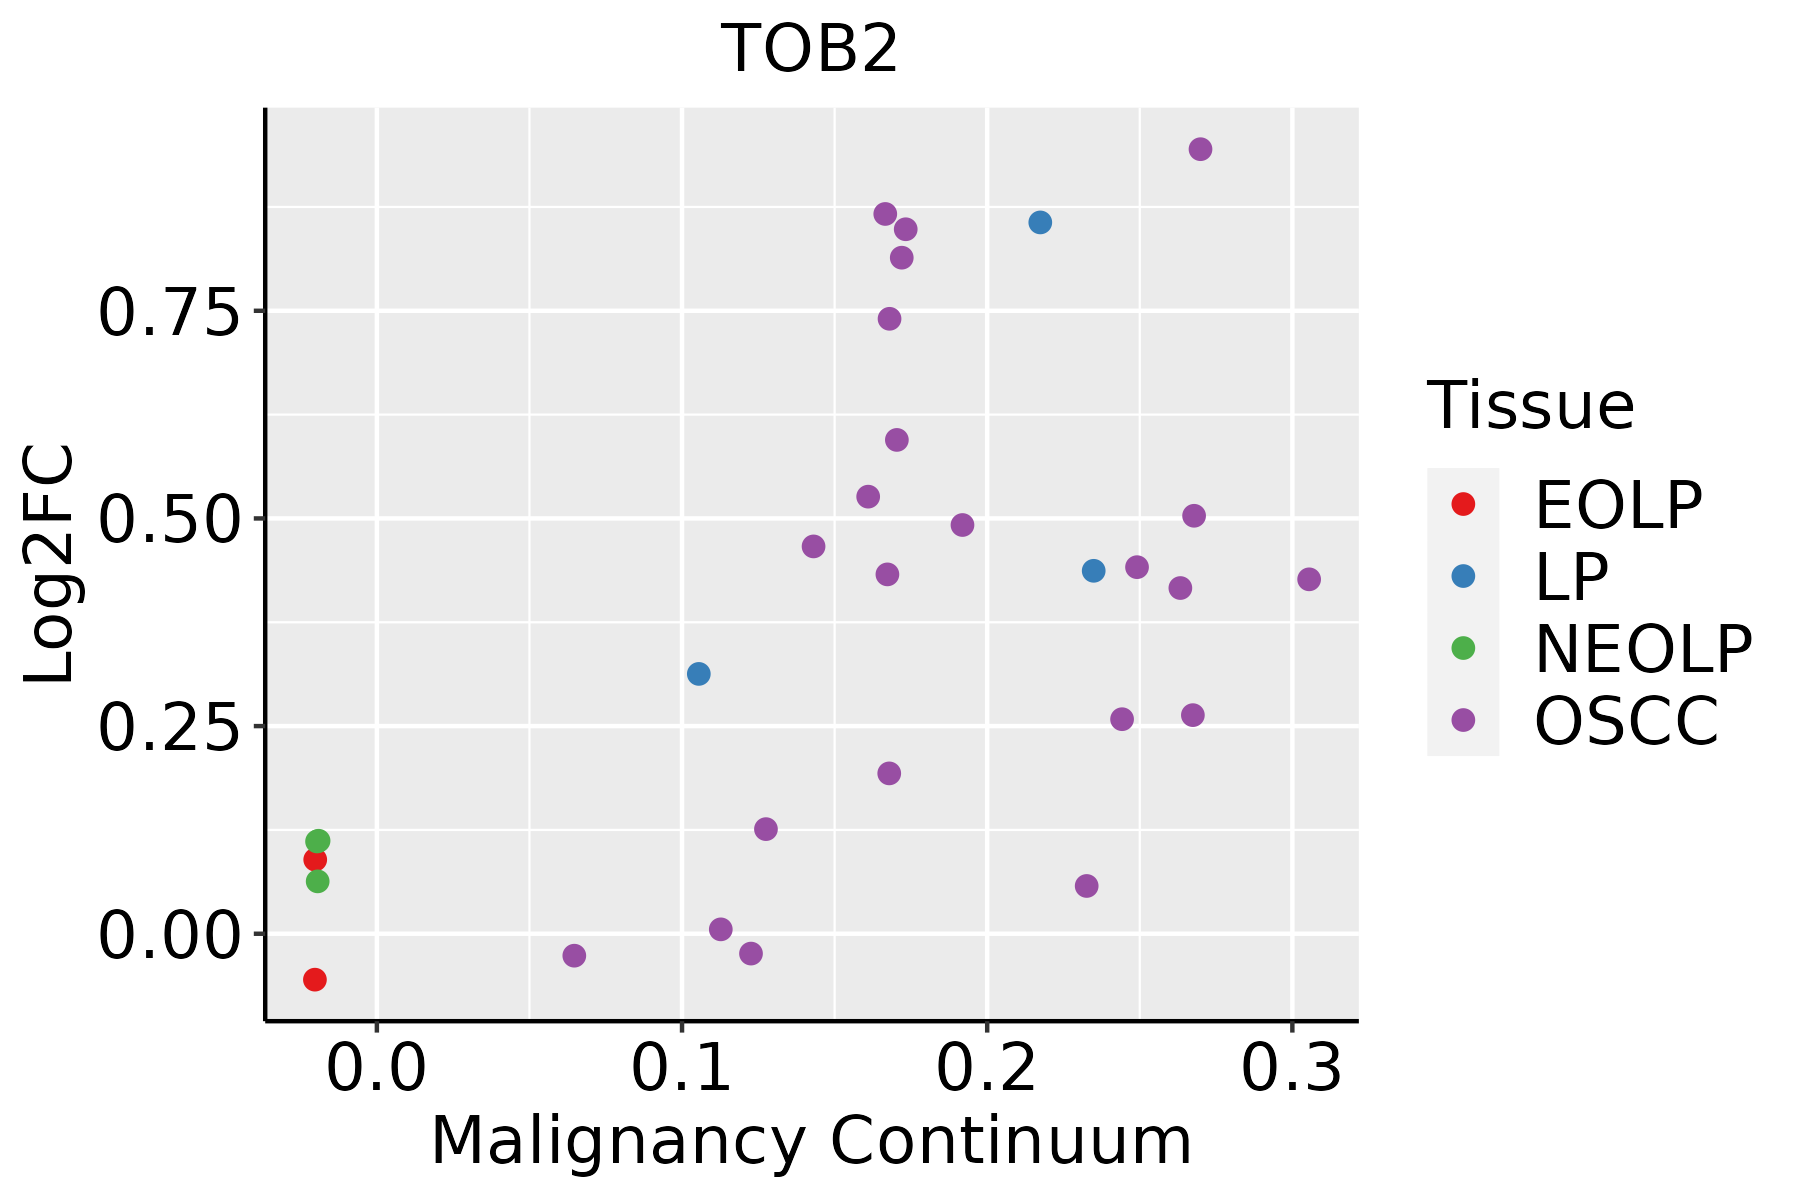 | EOLP: Erosive Oral lichen planus |
| LP: leukoplakia | ||
| NEOLP: Non-erosive oral lichen planus | ||
| OSCC: Oral squamous cell carcinoma | ||
| Prostate | 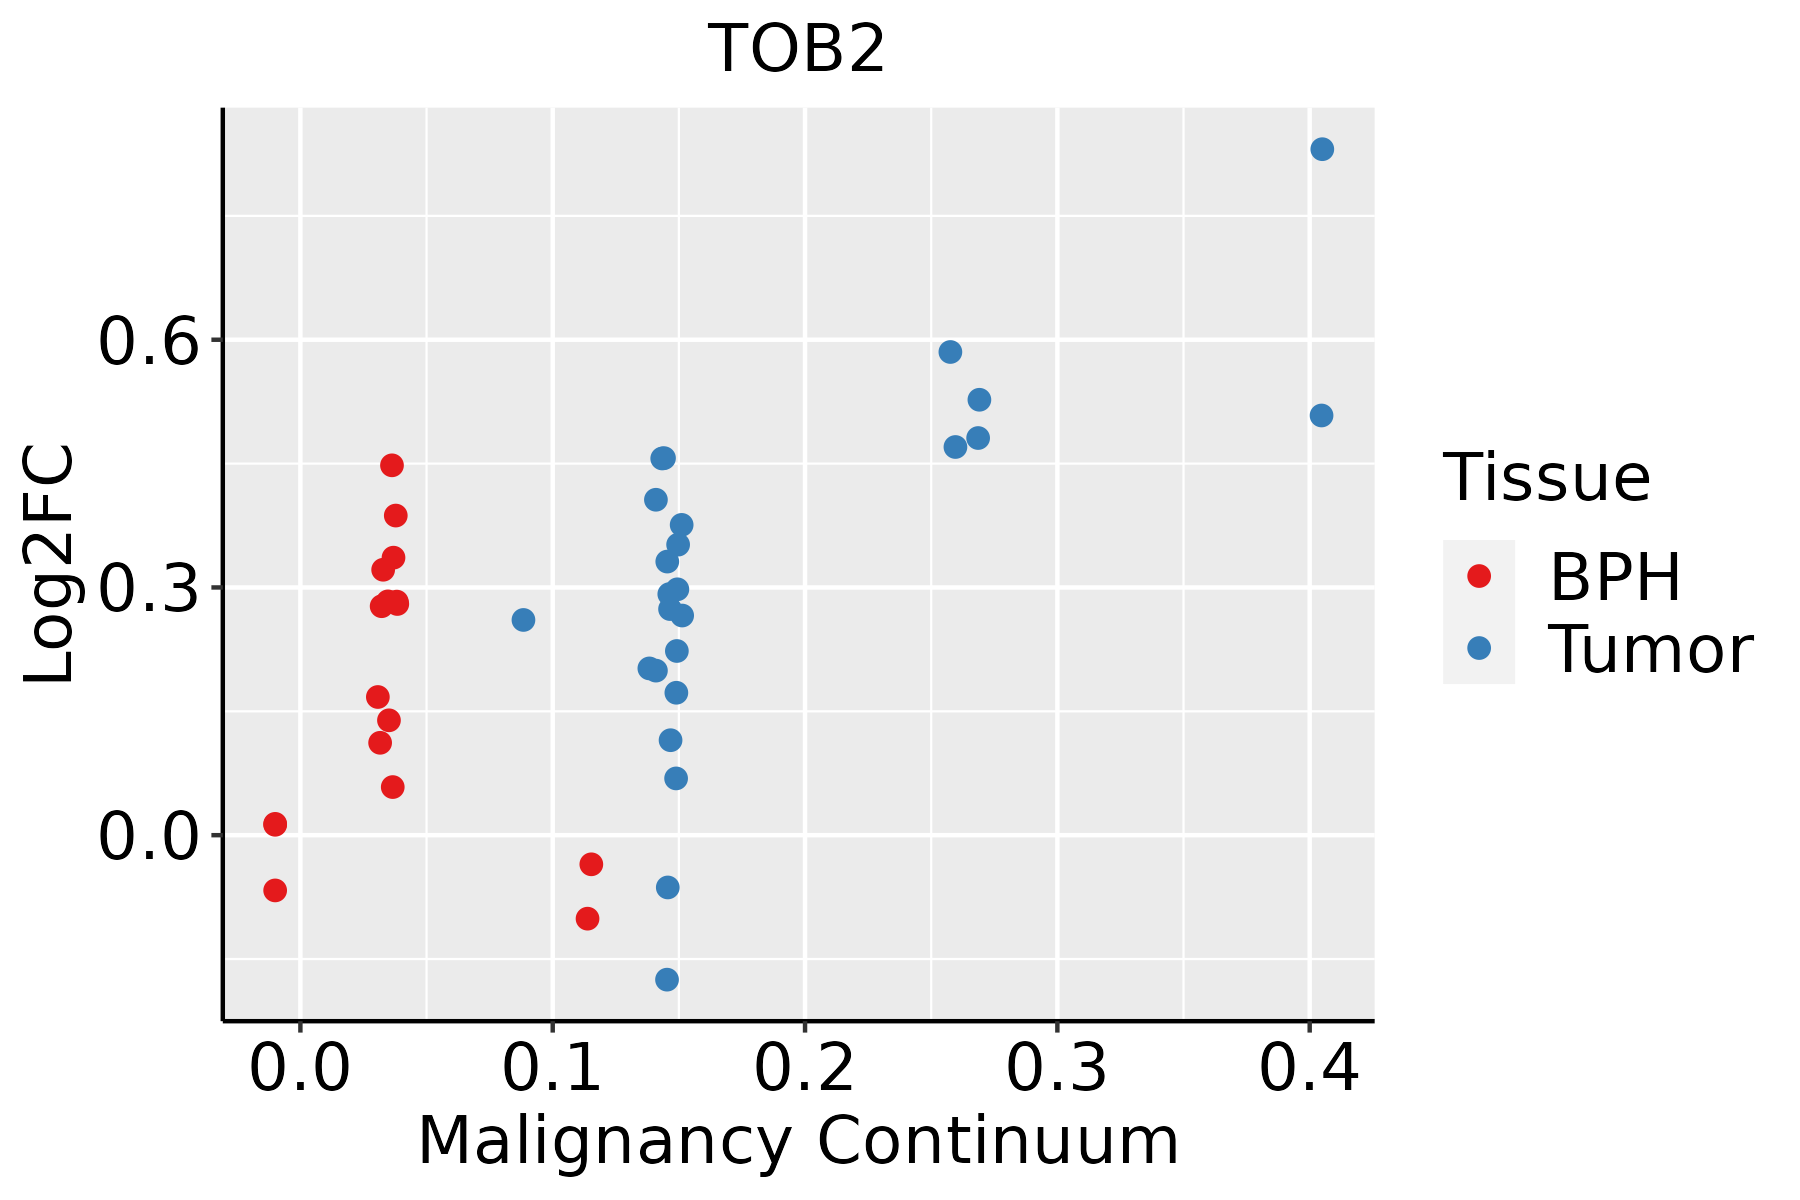 | BPH: Benign Prostatic Hyperplasia |
| Skin |  | AK: Actinic keratosis |
| cSCC: Cutaneous squamous cell carcinoma | ||
| SCCIS:squamous cell carcinoma in situ | ||
| Thyroid | 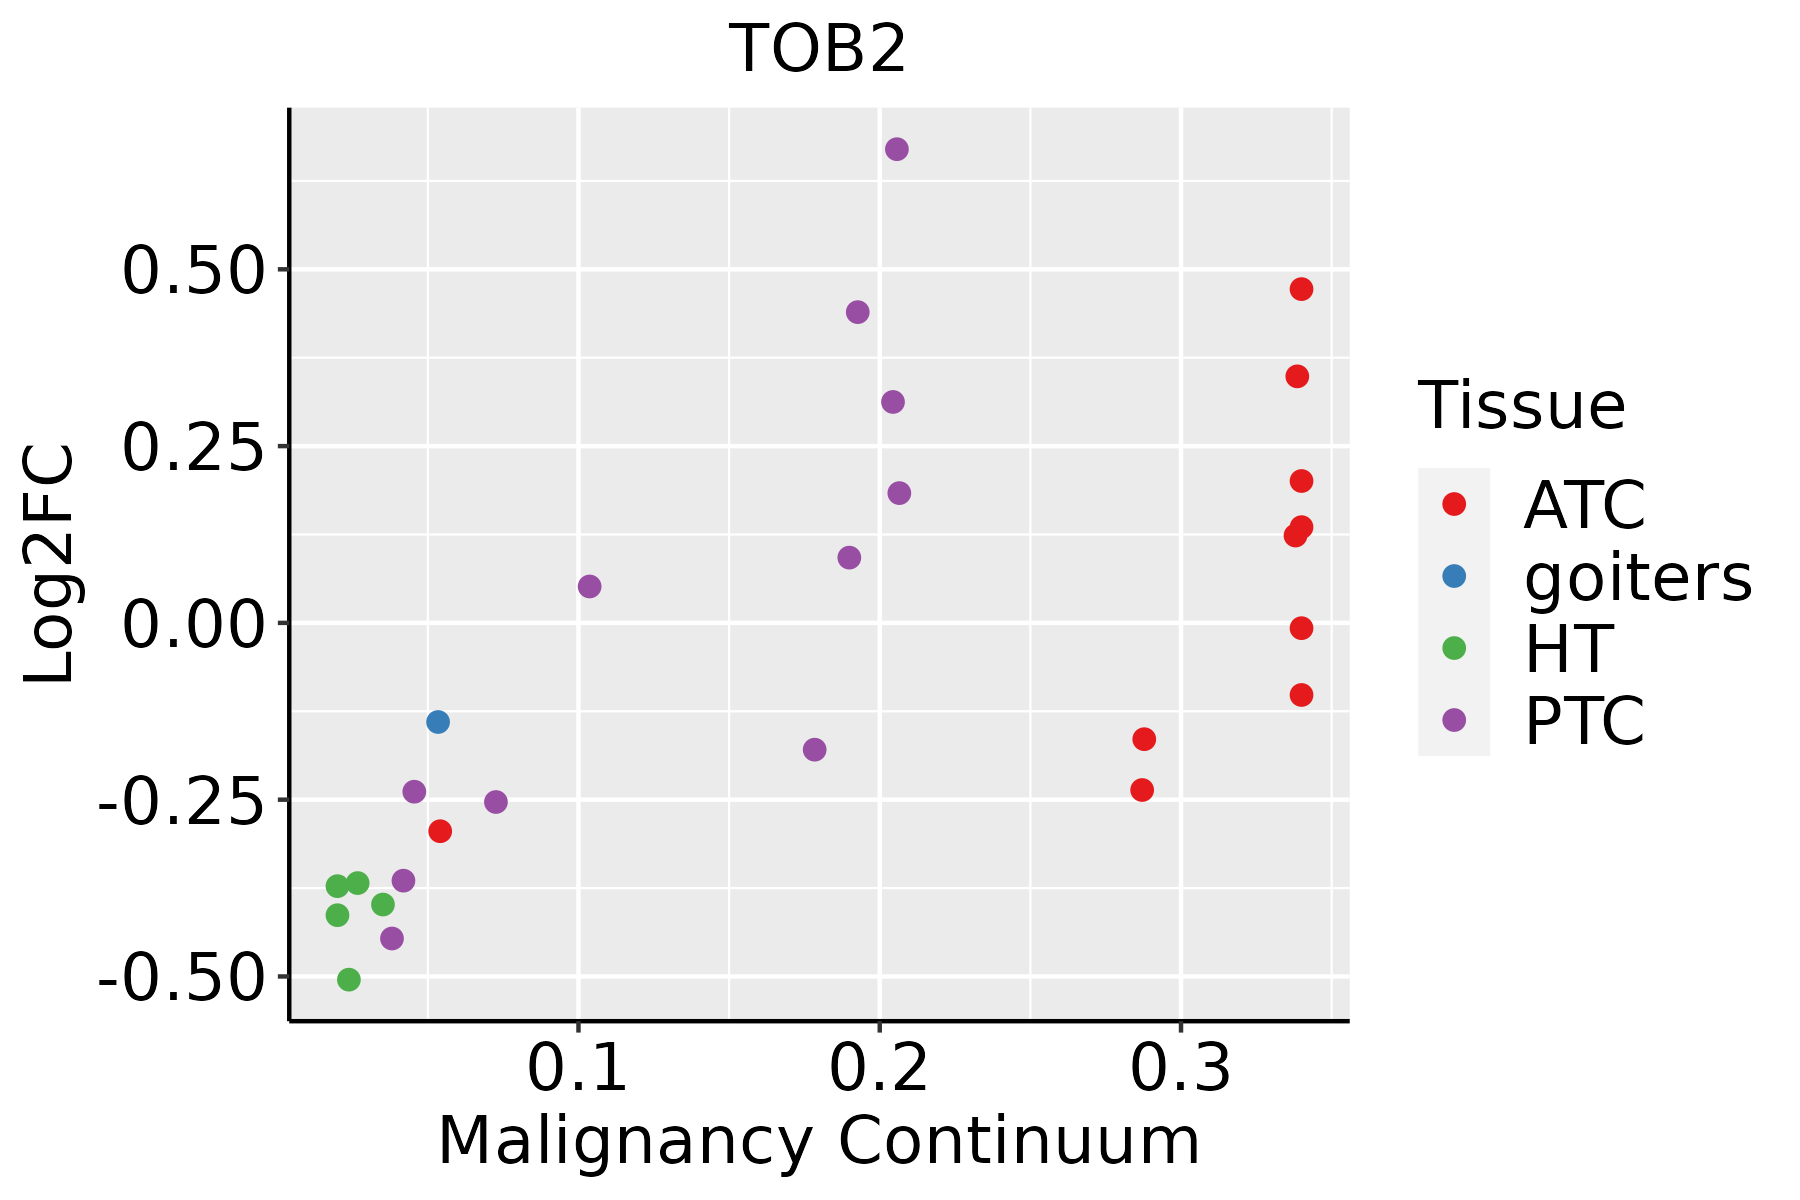 | ATC: Anaplastic thyroid cancer |
| HT: Hashimoto's thyroiditis | ||
| PTC: Papillary thyroid cancer |
| ∗log2FC in expression of this searched gene in stem-like cells from each diseased tissue sample relative to stem-like cells in normal samples in each tissue plotted against the malignancy continuum. Samples are colored based on if they are from different disease stage. |
Top |
Malignant transformation related pathway analysis |
| Find out the enriched GO biological processes and KEGG pathways involved in transition from healthy to precancer to cancer |
| Tissue | Disease Stage | Enriched GO biological Processes |
| Colorectum | AD |  |
| Colorectum | SER |  |
| Colorectum | MSS |  |
| Colorectum | MSI-H |  |
| Colorectum | FAP |  |
| ∗Top 15 enriched GO BP terms are showed in the bar plot of each disease state in each tissue. Each row represents a significant GO biological process which is colored according to the -log10(p.adjust). |
| Page: 1 2 3 4 5 6 7 8 9 |
| GO ID | Tissue | Disease Stage | Description | Gene Ratio | Bg Ratio | pvalue | p.adjust | Count |
| GO:000268316 | Esophagus | ESCC | negative regulation of immune system process | 231/8552 | 434/18723 | 8.48e-04 | 4.36e-03 | 231 |
| GO:0045637111 | Esophagus | ESCC | regulation of myeloid cell differentiation | 118/8552 | 210/18723 | 1.35e-03 | 6.43e-03 | 118 |
| GO:190210510 | Esophagus | ESCC | regulation of leukocyte differentiation | 152/8552 | 279/18723 | 1.82e-03 | 8.35e-03 | 152 |
| GO:000276115 | Esophagus | ESCC | regulation of myeloid leukocyte differentiation | 69/8552 | 120/18723 | 6.00e-03 | 2.21e-02 | 69 |
| GO:00303165 | Esophagus | ESCC | osteoclast differentiation | 54/8552 | 94/18723 | 1.43e-02 | 4.65e-02 | 54 |
| GO:003009912 | Liver | Cirrhotic | myeloid cell differentiation | 135/4634 | 381/18723 | 1.69e-06 | 3.22e-05 | 135 |
| GO:00015035 | Liver | Cirrhotic | ossification | 127/4634 | 408/18723 | 1.89e-03 | 1.19e-02 | 127 |
| GO:00025735 | Liver | Cirrhotic | myeloid leukocyte differentiation | 70/4634 | 208/18723 | 2.34e-03 | 1.42e-02 | 70 |
| GO:00456377 | Liver | Cirrhotic | regulation of myeloid cell differentiation | 68/4634 | 210/18723 | 7.40e-03 | 3.53e-02 | 68 |
| GO:003009922 | Liver | HCC | myeloid cell differentiation | 200/7958 | 381/18723 | 4.64e-05 | 4.49e-04 | 200 |
| GO:003009920 | Oral cavity | OSCC | myeloid cell differentiation | 213/7305 | 381/18723 | 1.24e-11 | 4.42e-10 | 213 |
| GO:000257310 | Oral cavity | OSCC | myeloid leukocyte differentiation | 119/7305 | 208/18723 | 7.29e-08 | 1.29e-06 | 119 |
| GO:000150310 | Oral cavity | OSCC | ossification | 203/7305 | 408/18723 | 5.54e-06 | 6.19e-05 | 203 |
| GO:190370618 | Oral cavity | OSCC | regulation of hemopoiesis | 180/7305 | 367/18723 | 5.16e-05 | 4.30e-04 | 180 |
| GO:000268310 | Oral cavity | OSCC | negative regulation of immune system process | 204/7305 | 434/18723 | 3.72e-04 | 2.27e-03 | 204 |
| GO:004563720 | Oral cavity | OSCC | regulation of myeloid cell differentiation | 106/7305 | 210/18723 | 4.58e-04 | 2.76e-03 | 106 |
| GO:19021059 | Oral cavity | OSCC | regulation of leukocyte differentiation | 136/7305 | 279/18723 | 5.53e-04 | 3.21e-03 | 136 |
| GO:00027616 | Oral cavity | OSCC | regulation of myeloid leukocyte differentiation | 61/7305 | 120/18723 | 5.52e-03 | 2.14e-02 | 61 |
| GO:00303164 | Oral cavity | OSCC | osteoclast differentiation | 48/7305 | 94/18723 | 1.16e-02 | 3.92e-02 | 48 |
| GO:0030099110 | Oral cavity | LP | myeloid cell differentiation | 130/4623 | 381/18723 | 1.94e-05 | 3.27e-04 | 130 |
| Page: 1 2 3 4 5 |
| Pathway ID | Tissue | Disease Stage | Description | Gene Ratio | Bg Ratio | pvalue | p.adjust | qvalue | Count |
| hsa0301810 | Esophagus | HGIN | RNA degradation | 27/1383 | 79/8465 | 7.73e-05 | 9.00e-04 | 7.15e-04 | 27 |
| hsa0301815 | Esophagus | HGIN | RNA degradation | 27/1383 | 79/8465 | 7.73e-05 | 9.00e-04 | 7.15e-04 | 27 |
| hsa0301824 | Esophagus | ESCC | RNA degradation | 62/4205 | 79/8465 | 1.18e-07 | 9.39e-07 | 4.81e-07 | 62 |
| hsa0301834 | Esophagus | ESCC | RNA degradation | 62/4205 | 79/8465 | 1.18e-07 | 9.39e-07 | 4.81e-07 | 62 |
| hsa03018 | Liver | Cirrhotic | RNA degradation | 44/2530 | 79/8465 | 1.43e-06 | 1.65e-05 | 1.02e-05 | 44 |
| hsa030181 | Liver | Cirrhotic | RNA degradation | 44/2530 | 79/8465 | 1.43e-06 | 1.65e-05 | 1.02e-05 | 44 |
| hsa030182 | Liver | HCC | RNA degradation | 58/4020 | 79/8465 | 2.29e-06 | 2.19e-05 | 1.22e-05 | 58 |
| hsa030183 | Liver | HCC | RNA degradation | 58/4020 | 79/8465 | 2.29e-06 | 2.19e-05 | 1.22e-05 | 58 |
| hsa030189 | Oral cavity | OSCC | RNA degradation | 59/3704 | 79/8465 | 2.05e-08 | 1.91e-07 | 9.70e-08 | 59 |
| hsa0301814 | Oral cavity | OSCC | RNA degradation | 59/3704 | 79/8465 | 2.05e-08 | 1.91e-07 | 9.70e-08 | 59 |
| hsa0301823 | Oral cavity | LP | RNA degradation | 39/2418 | 79/8465 | 6.98e-05 | 4.38e-04 | 2.83e-04 | 39 |
| hsa0301833 | Oral cavity | LP | RNA degradation | 39/2418 | 79/8465 | 6.98e-05 | 4.38e-04 | 2.83e-04 | 39 |
| hsa030188 | Prostate | BPH | RNA degradation | 29/1718 | 79/8465 | 5.17e-04 | 2.67e-03 | 1.65e-03 | 29 |
| hsa0301813 | Prostate | BPH | RNA degradation | 29/1718 | 79/8465 | 5.17e-04 | 2.67e-03 | 1.65e-03 | 29 |
| hsa0301822 | Prostate | Tumor | RNA degradation | 30/1791 | 79/8465 | 4.48e-04 | 2.35e-03 | 1.46e-03 | 30 |
| hsa0301832 | Prostate | Tumor | RNA degradation | 30/1791 | 79/8465 | 4.48e-04 | 2.35e-03 | 1.46e-03 | 30 |
| Page: 1 |
Top |
Cell-cell communication analysis |
| Identification of potential cell-cell interactions between two cell types and their ligand-receptor pairs for different disease states |
| Ligand | Receptor | LRpair | Pathway | Tissue | Disease Stage |
| Page: 1 |
Top |
Single-cell gene regulatory network inference analysis |
| Find out the significant the regulons (TFs) and the target genes of each regulon across cell types for different disease states |
| TF | Cell Type | Tissue | Disease Stage | Target Gene | RSS | Regulon Activity |
| TOB2 | M1MAC | Endometrium | ADJ | WARS2,TCAIM,BROX, etc. | 9.74e-02 |  |
| TOB2 | M1MAC | Endometrium | EEC | WARS2,TCAIM,BROX, etc. | 6.86e-02 |  |
| TOB2 | pDC | Oral cavity | OSCC | CEACAM4,INTS9,REV1, etc. | 1.59e-01 |  |
| ∗The dot plots of a searched regulon are shown for all cell subpopulations in each disease state of each tissue based on the regulon specific score inferred using pySCENIC and by calculating the average expression. |
| Page: 1 |
Top |
Somatic mutation of malignant transformation related genes |
| Annotation of somatic variants for genes involved in malignant transformation |
| Hugo Symbol | Variant Class | Variant Classification | dbSNP RS | HGVSc | HGVSp | HGVSp Short | SWISSPROT | BIOTYPE | SIFT | PolyPhen | Tumor Sample Barcode | Tissue | Histology | Sex | Age | Stage | Therapy Types | Drugs | Outcome |
| TOB2 | insertion | Frame_Shift_Ins | novel | c.17_18insTTTCGGAGCTGCCTTAAGAGTGAGACAGCCCAGCCCAGAGAAAGCC | p.Lys6AsnfsTer51 | p.K6Nfs*51 | Q14106 | protein_coding | TCGA-A2-A0CP-01 | Breast | breast invasive carcinoma | Female | <65 | I/II | Chemotherapy | cytoxan | SD | ||
| TOB2 | insertion | Frame_Shift_Ins | novel | c.354_355insA | p.Gly119ArgfsTer18 | p.G119Rfs*18 | Q14106 | protein_coding | TCGA-A2-A0EY-01 | Breast | breast invasive carcinoma | Female | <65 | I/II | Chemotherapy | adriamycin | SD | ||
| TOB2 | insertion | Frame_Shift_Ins | novel | c.352_353insGGCACTTGGCATCAGGGTCCCAATCACC | p.Glu118GlyfsTer28 | p.E118Gfs*28 | Q14106 | protein_coding | TCGA-A2-A0EY-01 | Breast | breast invasive carcinoma | Female | <65 | I/II | Chemotherapy | adriamycin | SD | ||
| TOB2 | insertion | Frame_Shift_Ins | novel | c.515_516insAGTGGTGGGG | p.Pro173ValfsTer21 | p.P173Vfs*21 | Q14106 | protein_coding | TCGA-B6-A0IE-01 | Breast | breast invasive carcinoma | Female | <65 | III/IV | Unknown | Unknown | PD | ||
| TOB2 | insertion | Frame_Shift_Ins | novel | c.513_514insAAGATGAAGAAGGGGGGCGGGGCAG | p.Gln172LysfsTer27 | p.Q172Kfs*27 | Q14106 | protein_coding | TCGA-B6-A0IE-01 | Breast | breast invasive carcinoma | Female | <65 | III/IV | Unknown | Unknown | PD | ||
| TOB2 | SNV | Missense_Mutation | c.817N>C | p.Asp273His | p.D273H | Q14106 | protein_coding | deleterious(0.02) | benign(0.288) | TCGA-EK-A3GK-01 | Cervix | cervical & endocervical cancer | Female | <65 | I/II | Unknown | Unknown | SD | |
| TOB2 | SNV | Missense_Mutation | c.139N>A | p.Glu47Lys | p.E47K | Q14106 | protein_coding | deleterious(0.01) | benign(0.045) | TCGA-EK-A3GK-01 | Cervix | cervical & endocervical cancer | Female | <65 | I/II | Unknown | Unknown | SD | |
| TOB2 | SNV | Missense_Mutation | novel | c.212N>T | p.Ala71Val | p.A71V | Q14106 | protein_coding | deleterious(0) | probably_damaging(0.981) | TCGA-5M-AAT6-01 | Colorectum | colon adenocarcinoma | Female | <65 | III/IV | Unknown | Unknown | PD |
| TOB2 | SNV | Missense_Mutation | c.878C>T | p.Thr293Ile | p.T293I | Q14106 | protein_coding | tolerated(0.38) | benign(0.01) | TCGA-A6-6653-01 | Colorectum | colon adenocarcinoma | Male | >=65 | I/II | Unknown | Unknown | SD | |
| TOB2 | SNV | Missense_Mutation | novel | c.334C>A | p.Leu112Met | p.L112M | Q14106 | protein_coding | deleterious(0) | probably_damaging(0.998) | TCGA-A5-A0G2-01 | Endometrium | uterine corpus endometrioid carcinoma | Female | <65 | III/IV | Unknown | Unknown | SD |
| Page: 1 2 3 |
Top |
Related drugs of malignant transformation related genes |
| Identification of chemicals and drugs interact with genes involved in malignant transfromation |
| (DGIdb 4.0) |
| Entrez ID | Symbol | Category | Interaction Types | Drug Claim Name | Drug Name | PMIDs |
| Page: 1 |

Copyright 2023-Present -The University of Texas Health Science Center at Houston |