
|
|||||
|
 | |
| |
| |
| |
| |
| |
|
Gene: TNFSF14 |
Gene summary for TNFSF14 |
| Gene information | Species | Human | Gene symbol | TNFSF14 | Gene ID | 8740 |
| Gene name | TNF superfamily member 14 | |
| Gene Alias | CD258 | |
| Cytomap | 19p13.3 | |
| Gene Type | protein-coding | GO ID | GO:0001775 | UniProtAcc | O43557 |
Top |
Malignant transformation analysis |
| Identification of the aberrant gene expression in precancerous and cancerous lesions by comparing the gene expression of stem-like cells in diseased tissues with normal stem cells |
| Entrez ID | Symbol | Replicates | Species | Organ | Tissue | Adj P-value | Log2FC | Malignancy |
| 8740 | TNFSF14 | NAFLD1 | Human | Liver | NAFLD | 1.85e-07 | 7.07e-01 | -0.04 |
| 8740 | TNFSF14 | S43 | Human | Liver | Cirrhotic | 1.30e-03 | -6.44e-02 | -0.0187 |
| 8740 | TNFSF14 | HCC2 | Human | Liver | HCC | 1.03e-07 | 1.57e+00 | 0.5341 |
| 8740 | TNFSF14 | HCC5 | Human | Liver | HCC | 4.08e-07 | 9.58e-01 | 0.4932 |
| Page: 1 |
| Tissue | Expression Dynamics | Abbreviation |
| Liver | 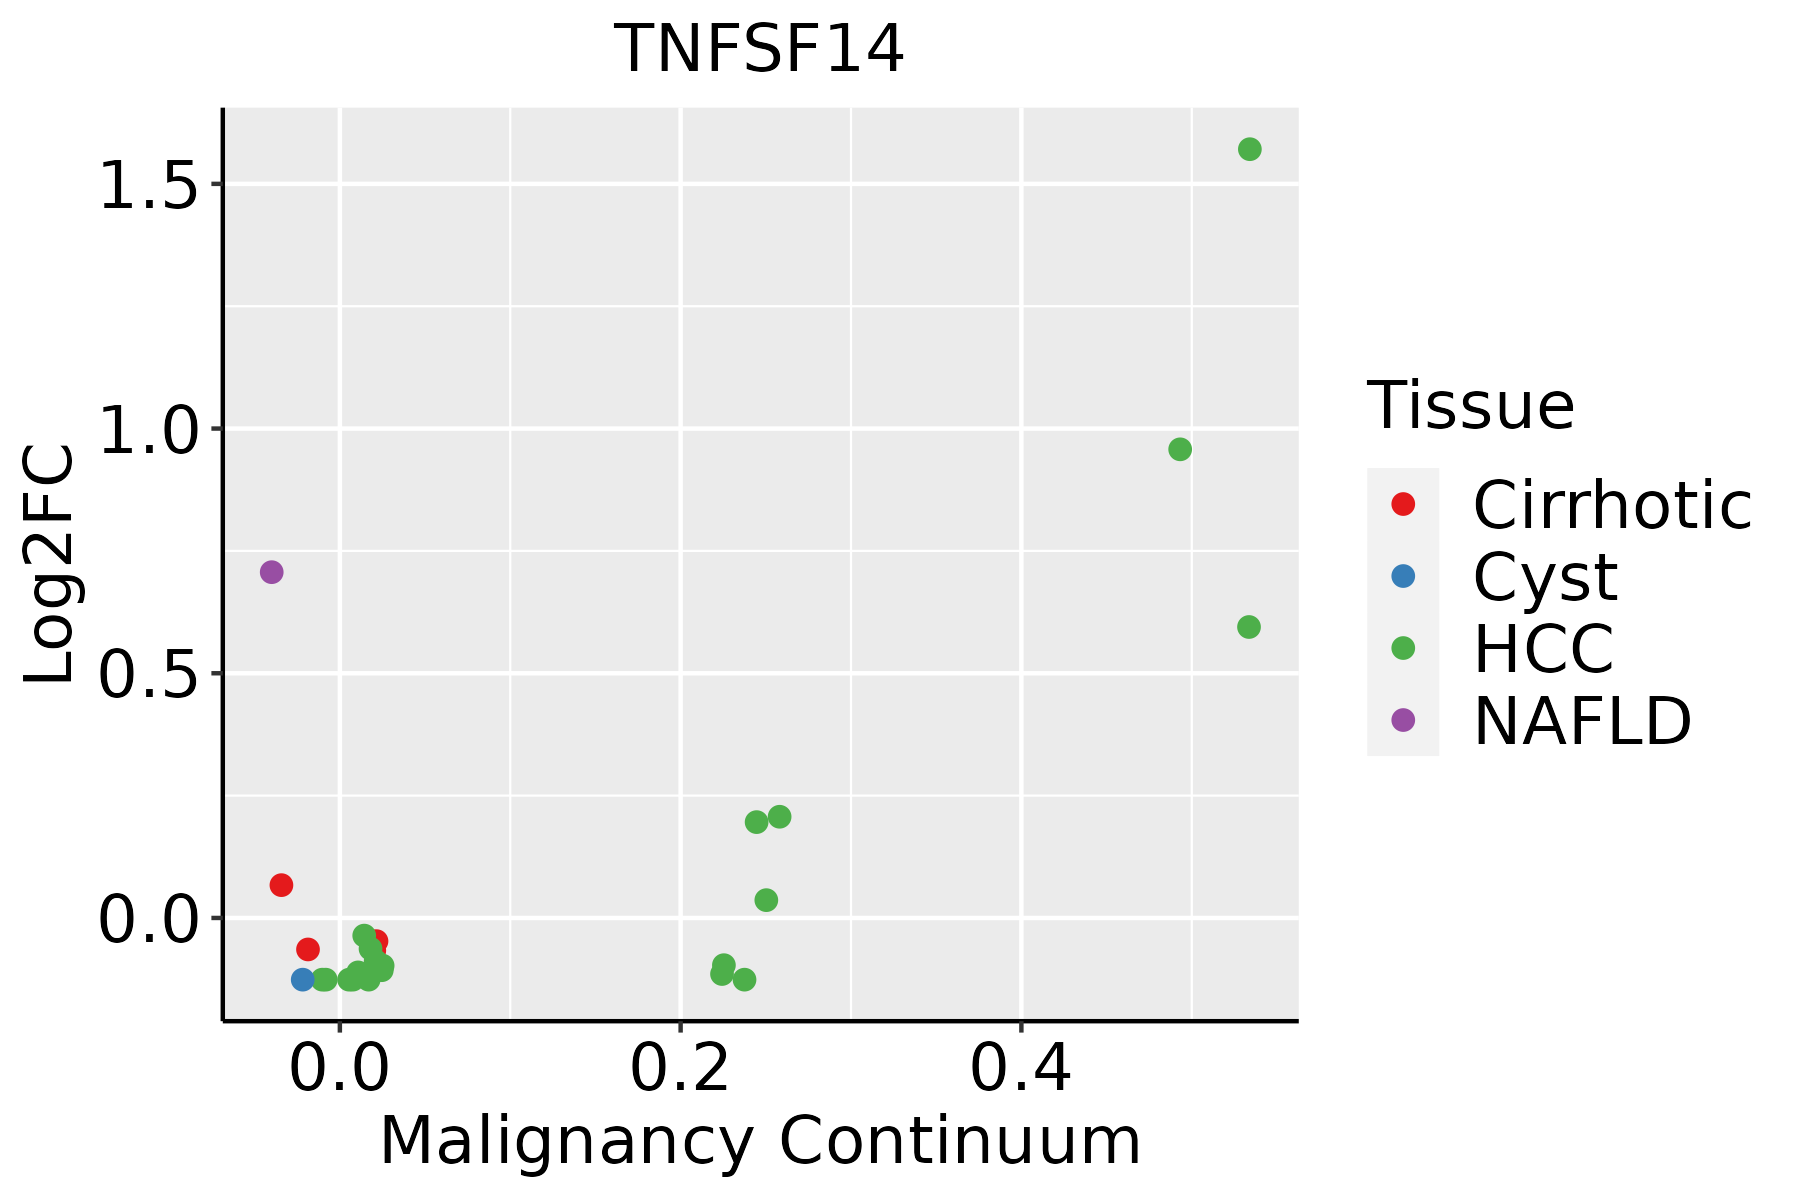 | HCC: Hepatocellular carcinoma |
| NAFLD: Non-alcoholic fatty liver disease |
| ∗log2FC in expression of this searched gene in stem-like cells from each diseased tissue sample relative to stem-like cells in normal samples in each tissue plotted against the malignancy continuum. Samples are colored based on if they are from different disease stage. |
Top |
Malignant transformation related pathway analysis |
| Find out the enriched GO biological processes and KEGG pathways involved in transition from healthy to precancer to cancer |
| Tissue | Disease Stage | Enriched GO biological Processes |
| Colorectum | AD |  |
| Colorectum | SER |  |
| Colorectum | MSS |  |
| Colorectum | MSI-H |  |
| Colorectum | FAP |  |
| ∗Top 15 enriched GO BP terms are showed in the bar plot of each disease state in each tissue. Each row represents a significant GO biological process which is colored according to the -log10(p.adjust). |
| Page: 1 2 3 4 5 6 7 8 9 |
| GO ID | Tissue | Disease Stage | Description | Gene Ratio | Bg Ratio | pvalue | p.adjust | Count |
| GO:001046612 | Liver | Cirrhotic | negative regulation of peptidase activity | 100/4634 | 262/18723 | 8.90e-07 | 1.84e-05 | 100 |
| GO:20001177 | Liver | Cirrhotic | negative regulation of cysteine-type endopeptidase activity | 42/4634 | 86/18723 | 1.14e-06 | 2.31e-05 | 42 |
| GO:007121411 | Liver | Cirrhotic | cellular response to abiotic stimulus | 115/4634 | 331/18723 | 2.62e-05 | 3.38e-04 | 115 |
| GO:010400411 | Liver | Cirrhotic | cellular response to environmental stimulus | 115/4634 | 331/18723 | 2.62e-05 | 3.38e-04 | 115 |
| GO:19012241 | Liver | Cirrhotic | positive regulation of NIK/NF-kappaB signaling | 33/4634 | 69/18723 | 2.70e-05 | 3.46e-04 | 33 |
| GO:1901222 | Liver | Cirrhotic | regulation of NIK/NF-kappaB signaling | 46/4634 | 112/18723 | 1.03e-04 | 1.06e-03 | 46 |
| GO:00457857 | Liver | Cirrhotic | positive regulation of cell adhesion | 141/4634 | 437/18723 | 2.05e-04 | 1.89e-03 | 141 |
| GO:0038061 | Liver | Cirrhotic | NIK/NF-kappaB signaling | 54/4634 | 143/18723 | 3.64e-04 | 3.07e-03 | 54 |
| GO:004887212 | Liver | Cirrhotic | homeostasis of number of cells | 89/4634 | 272/18723 | 1.76e-03 | 1.12e-02 | 89 |
| GO:0071260 | Liver | Cirrhotic | cellular response to mechanical stimulus | 32/4634 | 81/18723 | 2.34e-03 | 1.42e-02 | 32 |
| GO:007149622 | Liver | HCC | cellular response to external stimulus | 191/7958 | 320/18723 | 3.40e-10 | 1.13e-08 | 191 |
| GO:004328112 | Liver | HCC | regulation of cysteine-type endopeptidase activity involved in apoptotic process | 125/7958 | 209/18723 | 3.12e-07 | 5.42e-06 | 125 |
| GO:200011612 | Liver | HCC | regulation of cysteine-type endopeptidase activity | 137/7958 | 235/18723 | 6.91e-07 | 1.08e-05 | 137 |
| GO:005254722 | Liver | HCC | regulation of peptidase activity | 247/7958 | 461/18723 | 8.28e-07 | 1.27e-05 | 247 |
| GO:007121421 | Liver | HCC | cellular response to abiotic stimulus | 183/7958 | 331/18723 | 1.59e-06 | 2.26e-05 | 183 |
| GO:010400421 | Liver | HCC | cellular response to environmental stimulus | 183/7958 | 331/18723 | 1.59e-06 | 2.26e-05 | 183 |
| GO:004315412 | Liver | HCC | negative regulation of cysteine-type endopeptidase activity involved in apoptotic process | 54/7958 | 78/18723 | 1.61e-06 | 2.27e-05 | 54 |
| GO:005254822 | Liver | HCC | regulation of endopeptidase activity | 230/7958 | 432/18723 | 3.58e-06 | 4.68e-05 | 230 |
| GO:200011712 | Liver | HCC | negative regulation of cysteine-type endopeptidase activity | 57/7958 | 86/18723 | 7.14e-06 | 8.47e-05 | 57 |
| GO:004586122 | Liver | HCC | negative regulation of proteolysis | 186/7958 | 351/18723 | 4.19e-05 | 4.11e-04 | 186 |
| Page: 1 2 3 |
| Pathway ID | Tissue | Disease Stage | Description | Gene Ratio | Bg Ratio | pvalue | p.adjust | qvalue | Count |
| Page: 1 |
Top |
Cell-cell communication analysis |
| Identification of potential cell-cell interactions between two cell types and their ligand-receptor pairs for different disease states |
| Ligand | Receptor | LRpair | Pathway | Tissue | Disease Stage |
| TNFSF14 | LTBR | TNFSF14_LTBR | LIGHT | Breast | DCIS |
| TNFSF14 | TNFRSF14 | TNFSF14_TNFRSF14 | LIGHT | Breast | DCIS |
| TNFSF14 | LTBR | TNFSF14_LTBR | LIGHT | Cervix | CC |
| TNFSF14 | TNFRSF14 | TNFSF14_TNFRSF14 | LIGHT | Cervix | CC |
| TNFSF14 | LTBR | TNFSF14_LTBR | LIGHT | Cervix | Healthy |
| TNFSF14 | TNFRSF14 | TNFSF14_TNFRSF14 | LIGHT | Cervix | Healthy |
| TNFSF14 | LTBR | TNFSF14_LTBR | LIGHT | Cervix | Precancer |
| TNFSF14 | TNFRSF14 | TNFSF14_TNFRSF14 | LIGHT | Cervix | Precancer |
| TNFSF14 | TNFRSF14 | TNFSF14_TNFRSF14 | LIGHT | Endometrium | ADJ |
| TNFSF14 | TNFRSF14 | TNFSF14_TNFRSF14 | LIGHT | Endometrium | AEH |
| TNFSF14 | LTBR | TNFSF14_LTBR | LIGHT | Endometrium | Healthy |
| TNFSF14 | TNFRSF14 | TNFSF14_TNFRSF14 | LIGHT | Endometrium | Healthy |
| TNFSF14 | LTBR | TNFSF14_LTBR | LIGHT | Esophagus | ESCC |
| TNFSF14 | TNFRSF14 | TNFSF14_TNFRSF14 | LIGHT | Esophagus | ESCC |
| TNFSF14 | LTBR | TNFSF14_LTBR | LIGHT | HNSCC | ADJ |
| TNFSF14 | TNFRSF14 | TNFSF14_TNFRSF14 | LIGHT | HNSCC | ADJ |
| TNFSF14 | LTBR | TNFSF14_LTBR | LIGHT | HNSCC | OSCC |
| TNFSF14 | TNFRSF14 | TNFSF14_TNFRSF14 | LIGHT | HNSCC | OSCC |
| TNFSF14 | LTBR | TNFSF14_LTBR | LIGHT | Liver | Healthy |
| TNFSF14 | TNFRSF14 | TNFSF14_TNFRSF14 | LIGHT | Liver | Healthy |
| Page: 1 2 |
Top |
Single-cell gene regulatory network inference analysis |
| Find out the significant the regulons (TFs) and the target genes of each regulon across cell types for different disease states |
| TF | Cell Type | Tissue | Disease Stage | Target Gene | RSS | Regulon Activity |
| ∗The dot plots of a searched regulon are shown for all cell subpopulations in each disease state of each tissue based on the regulon specific score inferred using pySCENIC and by calculating the average expression. |
| Page: 1 |
Top |
Somatic mutation of malignant transformation related genes |
| Annotation of somatic variants for genes involved in malignant transformation |
| Hugo Symbol | Variant Class | Variant Classification | dbSNP RS | HGVSc | HGVSp | HGVSp Short | SWISSPROT | BIOTYPE | SIFT | PolyPhen | Tumor Sample Barcode | Tissue | Histology | Sex | Age | Stage | Therapy Types | Drugs | Outcome |
| TNFSF14 | SNV | Missense_Mutation | novel | c.438G>C | p.Lys146Asn | p.K146N | O43557 | protein_coding | deleterious(0) | probably_damaging(0.97) | TCGA-AC-A2BK-01 | Breast | breast invasive carcinoma | Female | >=65 | III/IV | Chemotherapy | cytoxan | CR |
| TNFSF14 | SNV | Missense_Mutation | c.188N>T | p.Trp63Leu | p.W63L | O43557 | protein_coding | tolerated(0.14) | benign(0.156) | TCGA-BH-A1EO-01 | Breast | breast invasive carcinoma | Female | >=65 | I/II | Unknown | Unknown | SD | |
| TNFSF14 | deletion | Frame_Shift_Del | novel | c.145delN | p.Ala49ProfsTer17 | p.A49Pfs*17 | O43557 | protein_coding | TCGA-D8-A27V-01 | Breast | breast invasive carcinoma | Female | <65 | I/II | Hormone Therapy | tamoxiphen | SD | ||
| TNFSF14 | SNV | Missense_Mutation | rs758345856 | c.652N>T | p.Arg218Cys | p.R218C | O43557 | protein_coding | deleterious(0) | probably_damaging(0.997) | TCGA-VS-A8EK-01 | Cervix | cervical & endocervical cancer | Female | >=65 | I/II | Chemotherapy | cisplatin | PD |
| TNFSF14 | SNV | Missense_Mutation | novel | c.98N>A | p.Cys33Tyr | p.C33Y | O43557 | protein_coding | deleterious(0.03) | probably_damaging(0.996) | TCGA-5M-AATE-01 | Colorectum | colon adenocarcinoma | Male | >=65 | I/II | Unknown | Unknown | PD |
| TNFSF14 | SNV | Missense_Mutation | rs772753769 | c.667N>T | p.Arg223Cys | p.R223C | O43557 | protein_coding | deleterious(0) | possibly_damaging(0.902) | TCGA-AA-3875-01 | Colorectum | colon adenocarcinoma | Female | >=65 | I/II | Unknown | Unknown | SD |
| TNFSF14 | SNV | Missense_Mutation | novel | c.110G>A | p.Arg37Gln | p.R37Q | O43557 | protein_coding | tolerated(0.88) | benign(0) | TCGA-AA-3949-01 | Colorectum | colon adenocarcinoma | Female | >=65 | III/IV | Unknown | Unknown | SD |
| TNFSF14 | SNV | Missense_Mutation | rs746091221 | c.505C>T | p.Arg169Cys | p.R169C | O43557 | protein_coding | deleterious(0) | probably_damaging(0.999) | TCGA-AA-3984-01 | Colorectum | colon adenocarcinoma | Female | <65 | I/II | Unknown | Unknown | SD |
| TNFSF14 | SNV | Missense_Mutation | c.602G>A | p.Ser201Asn | p.S201N | O43557 | protein_coding | deleterious(0) | probably_damaging(0.994) | TCGA-AA-A00N-01 | Colorectum | colon adenocarcinoma | Male | >=65 | I/II | Unknown | Unknown | PD | |
| TNFSF14 | SNV | Missense_Mutation | c.85N>T | p.Arg29Trp | p.R29W | O43557 | protein_coding | deleterious(0) | possibly_damaging(0.65) | TCGA-AM-5821-01 | Colorectum | colon adenocarcinoma | Female | >=65 | I/II | Unknown | Unknown | SD |
| Page: 1 2 3 4 |
Top |
Related drugs of malignant transformation related genes |
| Identification of chemicals and drugs interact with genes involved in malignant transfromation |
| (DGIdb 4.0) |
| Entrez ID | Symbol | Category | Interaction Types | Drug Claim Name | Drug Name | PMIDs |
| 8740 | TNFSF14 | DRUGGABLE GENOME | inhibitor | CHEMBL1742988 | BAMINERCEPT | |
| 8740 | TNFSF14 | DRUGGABLE GENOME | BAMINERCEPT | BAMINERCEPT |
| Page: 1 |

Copyright 2023-Present -The University of Texas Health Science Center at Houston |