Schematic overview of the cellular and molecular mechanisms involved in the cancer progression, including the proposed cellular and molecular mechanisms in cancer cells trajectory. AT1: alveolar type 1 cells; AT2: alveolar type 2 cells; AAH: atypical adenomatous hyperplasia; AIS: adenocarcinoma in situ; MIA: minimally invasive adenocarcinoma; IA: invasive adenocarcinoma; EMT: epithelial-mesenchymal transition

Home

Download

Statistics

Help

Contact

Center for Computational Systems Medicine
leaf

Gene summary

leaf

Malignant transformation analysis

leaf

Malignant transformation related pathway analysis

leaf

Cell-cell communication analysis

leaf

Single-cell gene regulatory network inference analysis

leaf

Somatic mutation of malignant transformation related genes

leaf

Related drugs of malignant transformation related genes

Gene: TMEM2

Gene summary for TMEM2

check button Gene summary.

Gene informationSpeciesHuman
Gene symbol

TMEM2

Gene ID

23670

Gene namecell migration inducing hyaluronidase 2
Gene AliasTMEM2
Cytomap9q21.13
Gene Typeprotein-coding
GO ID

GO:0001525

UniProtAcc

Q9UHN6


Top

Malignant transformation analysis

check button Identification of the aberrant gene expression in precancerous and cancerous lesions by comparing the gene expression of stem-like cells in diseased tissues with normal stem cells
check button Malignant transformation involving gene list.
Entrez IDSymbolReplicatesSpeciesOrganTissueAdj P-valueLog2FCMalignancy
23670TMEM2HTA11_99999970781_79442HumanColorectumMSS1.43e-1091.73e+000.294
23670TMEM2HTA11_99999965062_69753HumanColorectumMSI-H8.49e-222.28e+000.3487
23670TMEM2HTA11_99999965104_69814HumanColorectumMSS6.31e-461.34e+000.281
23670TMEM2HTA11_99999971662_82457HumanColorectumMSS1.36e-601.41e+000.3859
23670TMEM2HTA11_99999973899_84307HumanColorectumMSS1.05e-124.83e-010.2585
23670TMEM2HTA11_99999974143_84620HumanColorectumMSS6.03e-386.47e-010.3005
23670TMEM2LZE24THumanEsophagusESCC4.31e-02-2.27e-010.0596
23670TMEM2P2T-EHumanEsophagusESCC5.65e-142.10e-010.1177
23670TMEM2P4T-EHumanEsophagusESCC9.36e-051.99e-010.1323
23670TMEM2P8T-EHumanEsophagusESCC1.14e-101.86e-010.0889
23670TMEM2P9T-EHumanEsophagusESCC9.44e-093.50e-010.1131
23670TMEM2P10T-EHumanEsophagusESCC2.19e-161.88e-010.116
23670TMEM2P11T-EHumanEsophagusESCC7.26e-131.02e+000.1426
23670TMEM2P12T-EHumanEsophagusESCC2.48e-155.31e-010.1122
23670TMEM2P15T-EHumanEsophagusESCC2.92e-287.56e-010.1149
23670TMEM2P16T-EHumanEsophagusESCC9.05e-123.04e-010.1153
23670TMEM2P20T-EHumanEsophagusESCC9.08e-04-1.91e-020.1124
23670TMEM2P21T-EHumanEsophagusESCC1.24e-101.05e-010.1617
23670TMEM2P22T-EHumanEsophagusESCC1.20e-087.13e-020.1236
23670TMEM2P23T-EHumanEsophagusESCC3.37e-073.44e-010.108
Page: 1 2 3 4 5 

check button Transcriptomic changes along malignancy continuum.
TissueExpression DynamicsAbbreviation
Colorectum (GSE201348)The image shows the transcriptomic changes along malignancy continuum.log2FC in expression of this searched gene in stem-like cells from each diseased tissue sample relative to stem-like cells in normal samples in each tissue plotted against the malignancy continuum. Samples are colored based on if they are from different disease stage.FAP: Familial adenomatous polyposis
CRC: Colorectal cancer
Colorectum (HTA11)The image shows the transcriptomic changes along malignancy continuum.log2FC in expression of this searched gene in stem-like cells from each diseased tissue sample relative to stem-like cells in normal samples in each tissue plotted against the malignancy continuum. Samples are colored based on if they are from different disease stage.AD: Adenomas
SER: Sessile serrated lesions
MSI-H: Microsatellite-high colorectal cancer
MSS: Microsatellite stable colorectal cancer
EsophagusThe image shows the transcriptomic changes along malignancy continuum.log2FC in expression of this searched gene in stem-like cells from each diseased tissue sample relative to stem-like cells in normal samples in each tissue plotted against the malignancy continuum. Samples are colored based on if they are from different disease stage.
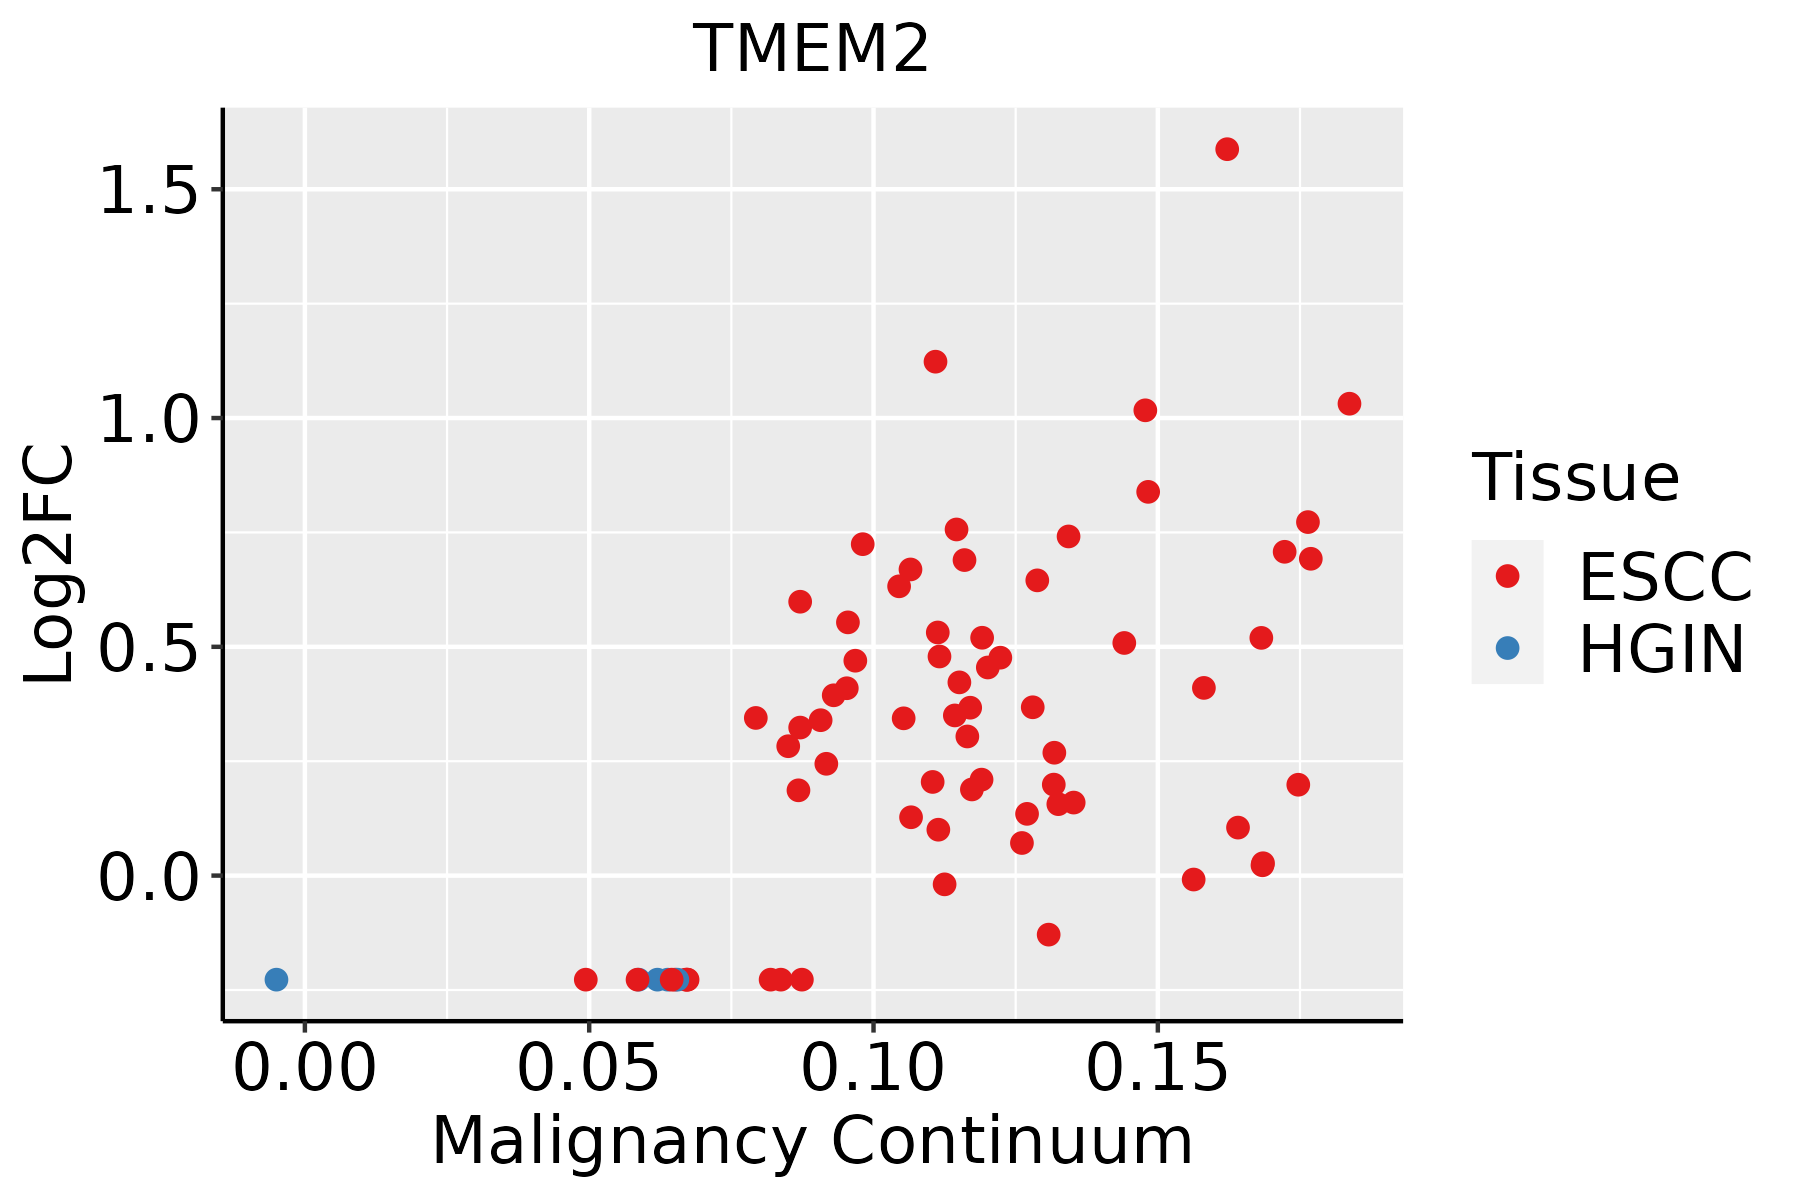
ESCC: Esophageal squamous cell carcinoma
HGIN: High-grade intraepithelial neoplasias
LGIN: Low-grade intraepithelial neoplasias
LiverThe image shows the transcriptomic changes along malignancy continuum.log2FC in expression of this searched gene in stem-like cells from each diseased tissue sample relative to stem-like cells in normal samples in each tissue plotted against the malignancy continuum. Samples are colored based on if they are from different disease stage.HCC: Hepatocellular carcinoma
NAFLD: Non-alcoholic fatty liver disease
Oral CavityThe image shows the transcriptomic changes along malignancy continuum.log2FC in expression of this searched gene in stem-like cells from each diseased tissue sample relative to stem-like cells in normal samples in each tissue plotted against the malignancy continuum. Samples are colored based on if they are from different disease stage.
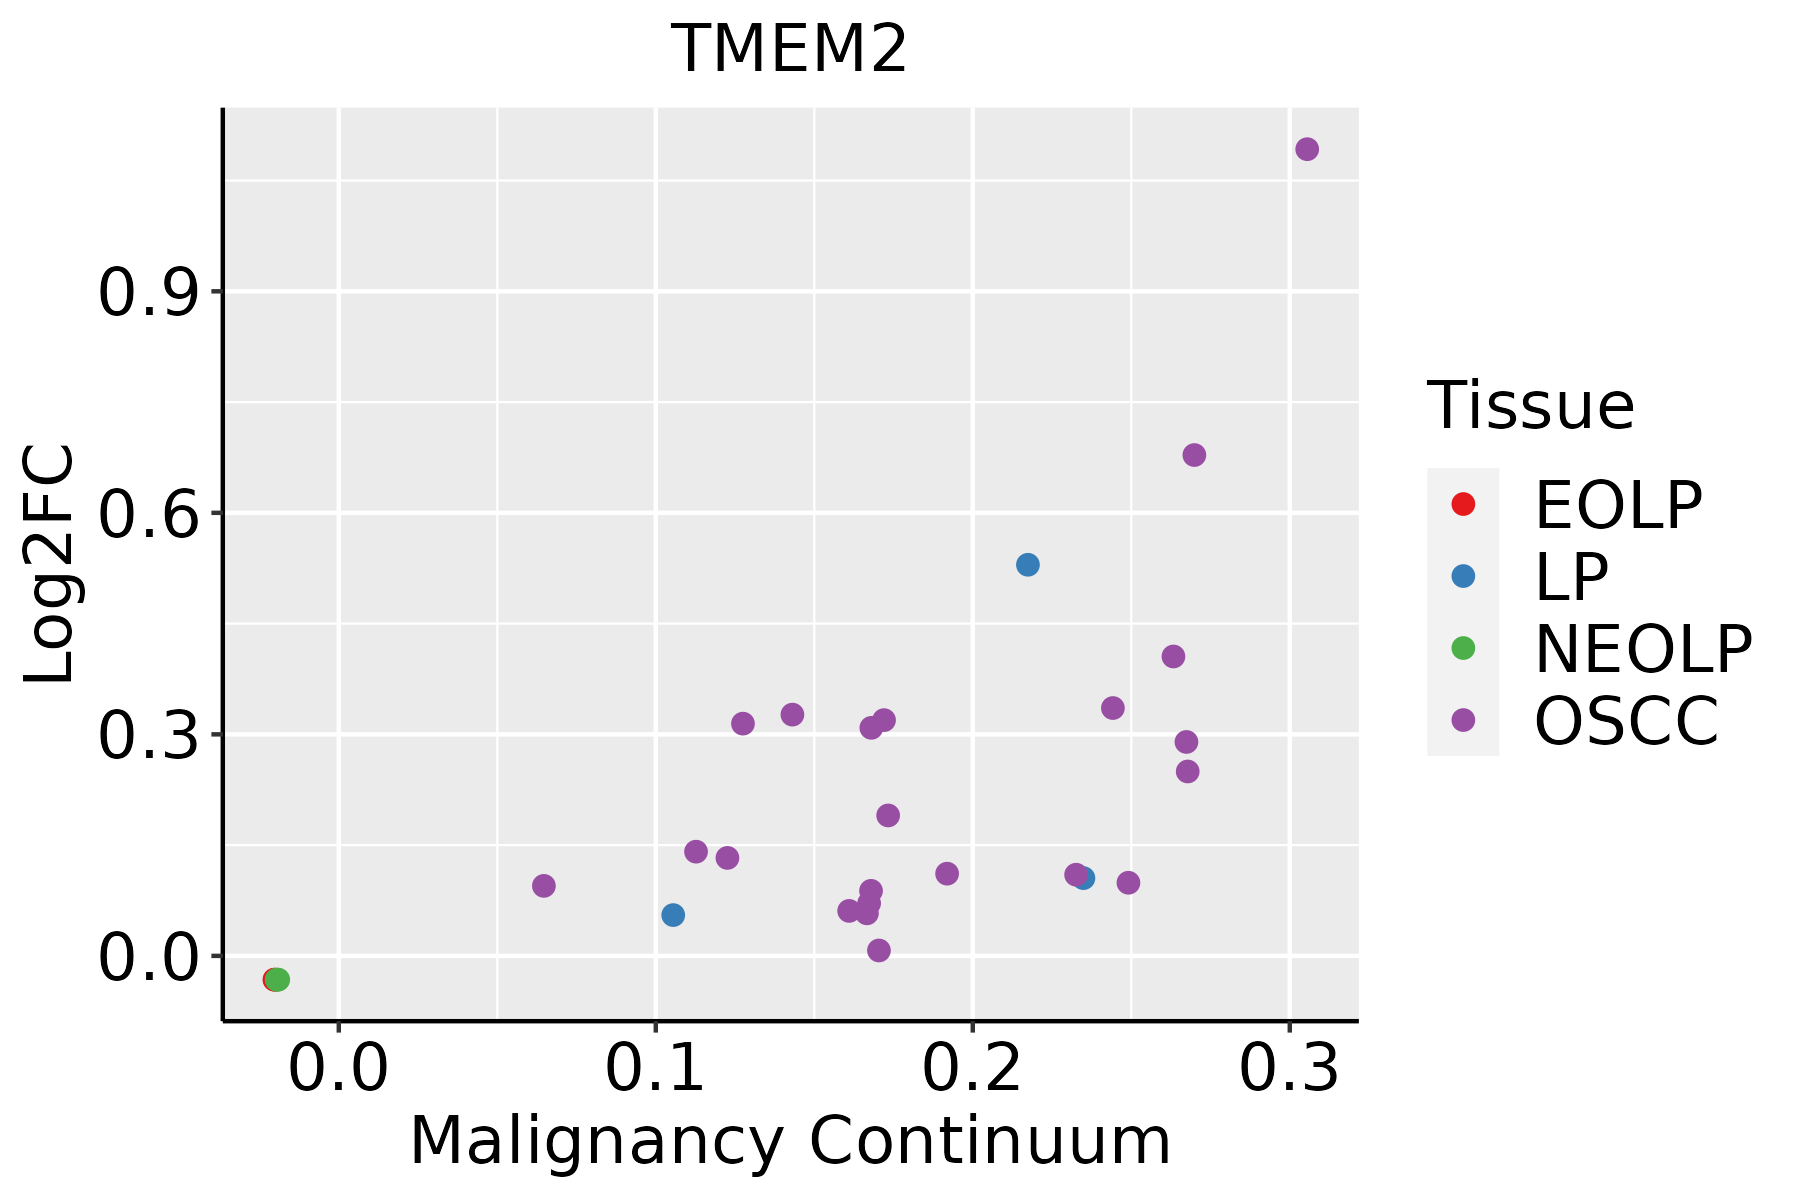
EOLP: Erosive Oral lichen planus
LP: leukoplakia
NEOLP: Non-erosive oral lichen planus
OSCC: Oral squamous cell carcinoma
ProstateThe image shows the transcriptomic changes along malignancy continuum.log2FC in expression of this searched gene in stem-like cells from each diseased tissue sample relative to stem-like cells in normal samples in each tissue plotted against the malignancy continuum. Samples are colored based on if they are from different disease stage.BPH: Benign Prostatic Hyperplasia
∗log2FC in expression of this searched gene in stem-like cells from each diseased tissue sample relative to stem-like cells in normal samples in each tissue plotted against the malignancy continuum. Samples are colored based on if they are from different disease stage.

Top

Malignant transformation related pathway analysis

check buttonFind out the enriched GO biological processes and KEGG pathways involved in transition from healthy to precancer to cancer
check button Figure of enriched GO biological processes.
TissueDisease StageEnriched GO biological Processes
ColorectumADGO analysis - Figure of enriched GO biological processes: Top 15 enriched GO BP terms are showed in the bar plot of each disease state in each tissue. Each row represents a significant GO biological process which is colored according to the -log10(p.adjust).
ColorectumSERGO analysis - Figure of enriched GO biological processes: Top 15 enriched GO BP terms are showed in the bar plot of each disease state in each tissue. Each row represents a significant GO biological process which is colored according to the -log10(p.adjust).
ColorectumMSSGO analysis - Figure of enriched GO biological processes: Top 15 enriched GO BP terms are showed in the bar plot of each disease state in each tissue. Each row represents a significant GO biological process which is colored according to the -log10(p.adjust).
ColorectumMSI-HGO analysis - Figure of enriched GO biological processes: Top 15 enriched GO BP terms are showed in the bar plot of each disease state in each tissue. Each row represents a significant GO biological process which is colored according to the -log10(p.adjust).
ColorectumFAPGO analysis - Figure of enriched GO biological processes: Top 15 enriched GO BP terms are showed in the bar plot of each disease state in each tissue. Each row represents a significant GO biological process which is colored according to the -log10(p.adjust).
∗Top 15 enriched GO BP terms are showed in the bar plot of each disease state in each tissue. Each row represents a significant GO biological process which is colored according to the -log10(p.adjust).
Page: 1 2 3 4 5 6 7 8 9 

check button Enriched GO biological processes.
GO IDTissueDisease StageDescriptionGene RatioBg Ratiopvaluep.adjustCount
GO:00164852ColorectumMSSprotein processing57/3467225/187236.60e-034.38e-0257
GO:00516568EndometriumAEHestablishment of organelle localization77/2100390/187234.89e-071.94e-0577
GO:00516507EndometriumAEHestablishment of vesicle localization32/2100161/187238.99e-048.24e-0332
GO:00516487EndometriumAEHvesicle localization32/2100177/187234.33e-032.86e-0232
GO:00484891EndometriumAEHsynaptic vesicle transport11/210042/187235.45e-033.37e-0211
GO:005165613EndometriumEECestablishment of organelle localization75/2168390/187236.23e-061.49e-0475
GO:005165013EndometriumEECestablishment of vesicle localization31/2168161/187232.99e-032.10e-0231
GO:004217627EsophagusHGINregulation of protein catabolic process119/2587391/187238.09e-182.43e-15119
GO:001049826EsophagusHGINproteasomal protein catabolic process139/2587490/187231.20e-173.41e-15139
GO:004586227EsophagusHGINpositive regulation of proteolysis107/2587372/187232.61e-144.60e-12107
GO:190336227EsophagusHGINregulation of cellular protein catabolic process81/2587255/187231.16e-131.93e-1181
GO:003497625EsophagusHGINresponse to endoplasmic reticulum stress81/2587256/187231.47e-132.32e-1181
GO:000989626EsophagusHGINpositive regulation of catabolic process126/2587492/187231.46e-122.09e-10126
GO:003133126EsophagusHGINpositive regulation of cellular catabolic process112/2587427/187235.15e-126.72e-10112
GO:190305027EsophagusHGINregulation of proteolysis involved in cellular protein catabolic process70/2587221/187236.21e-127.76e-1070
GO:006113627EsophagusHGINregulation of proteasomal protein catabolic process60/2587187/187231.10e-101.12e-0860
GO:004573227EsophagusHGINpositive regulation of protein catabolic process69/2587231/187231.66e-101.64e-0869
GO:190336427EsophagusHGINpositive regulation of cellular protein catabolic process51/2587155/187231.01e-098.15e-0851
GO:190180020EsophagusHGINpositive regulation of proteasomal protein catabolic process41/2587114/187232.25e-091.67e-0741
GO:190305219EsophagusHGINpositive regulation of proteolysis involved in cellular protein catabolic process45/2587133/187233.55e-092.53e-0745
Page: 1 2 3 4 5 6 7 8 9 10 11 12 13 14 15 16 17 18 

check button Enriched KEGG pathways.
Pathway IDTissueDisease StageDescriptionGene RatioBg Ratiopvaluep.adjustqvalueCount
Page: 1 

Top

Cell-cell communication analysis

check buttonIdentification of potential cell-cell interactions between two cell types and their ligand-receptor pairs for different disease states
LigandReceptorLRpairPathwayTissueDisease Stage
Page: 1 

Top

Single-cell gene regulatory network inference analysis

check buttonFind out the significant the regulons (TFs) and the target genes of each regulon across cell types for different disease states
TFCell TypeTissueDisease StageTarget GeneRSSRegulon Activity
∗The dot plots of a searched regulon are shown for all cell subpopulations in each disease state of each tissue based on the regulon specific score inferred using pySCENIC and by calculating the average expression.
Page: 1 

Top

Somatic mutation of malignant transformation related genes

check buttonAnnotation of somatic variants for genes involved in malignant transformation
Hugo SymbolVariant ClassVariant ClassificationdbSNP RSHGVScHGVSpHGVSp ShortSWISSPROTBIOTYPESIFTPolyPhenTumor Sample BarcodeTissueHistologySexAgeStageTherapy TypesDrugsOutcome
TMEM2SNVMissense_Mutationnovelc.3527G>Ap.Arg1176Lysp.R1176KQ9UHN6protein_codingtolerated(0.66)benign(0)TCGA-A8-A06Q-01Breastbreast invasive carcinomaFemale<65III/IVUnknownUnknownSD
TMEM2SNVMissense_Mutationnovelc.3357N>Ap.Phe1119Leup.F1119LQ9UHN6protein_codingdeleterious(0.03)possibly_damaging(0.49)TCGA-AN-A046-01Breastbreast invasive carcinomaFemale>=65I/IIUnknownUnknownSD
TMEM2SNVMissense_Mutationc.1139N>Gp.Gln380Argp.Q380RQ9UHN6protein_codingtolerated(0.68)benign(0.001)TCGA-AR-A0TX-01Breastbreast invasive carcinomaFemale<65I/IIUnknownUnknownSD
TMEM2insertionNonsense_Mutationnovelc.922_923insCTGAATCTGTGGGATCTACTAAAGTTTAp.Arg308ProfsTer10p.R308Pfs*10Q9UHN6protein_codingTCGA-AO-A0JF-01Breastbreast invasive carcinomaFemale>=65I/IIChemotherapydoxorubicinSD
TMEM2SNVMissense_Mutationnovelc.3854N>Tp.Ser1285Phep.S1285FQ9UHN6protein_codingdeleterious(0.01)probably_damaging(0.996)TCGA-2W-A8YY-01Cervixcervical & endocervical cancerFemale<65I/IIChemotherapycisplatinCR
TMEM2SNVMissense_Mutationrs772803934c.1469N>Ap.Arg490Glnp.R490QQ9UHN6protein_codingdeleterious(0.03)benign(0.264)TCGA-2W-A8YY-01Cervixcervical & endocervical cancerFemale<65I/IIChemotherapycisplatinCR
TMEM2SNVMissense_Mutationc.415N>Tp.Asp139Tyrp.D139YQ9UHN6protein_codingtolerated(0.07)possibly_damaging(0.87)TCGA-2W-A8YY-01Cervixcervical & endocervical cancerFemale<65I/IIChemotherapycisplatinCR
TMEM2SNVMissense_Mutationnovelc.1885N>Gp.Thr629Alap.T629AQ9UHN6protein_codingdeleterious(0.05)benign(0.083)TCGA-EA-A410-01Cervixcervical & endocervical cancerFemale<65I/IIUnknownUnknownSD
TMEM2SNVMissense_Mutationrs776808520c.314C>Tp.Ser105Leup.S105LQ9UHN6protein_codingdeleterious(0)benign(0.03)TCGA-FU-A3HY-01Cervixcervical & endocervical cancerFemale<65I/IIChemotherapycisplatinCR
TMEM2SNVMissense_Mutationc.2635C>Tp.His879Tyrp.H879YQ9UHN6protein_codingtolerated(1)benign(0.171)TCGA-JW-A5VL-01Cervixcervical & endocervical cancerFemale<65I/IIUnknownUnknownSD
Page: 1 2 3 4 5 6 7 8 9 10 11 12 13 14 15 16 

Top

Related drugs of malignant transformation related genes

check buttonIdentification of chemicals and drugs interact with genes involved in malignant transfromation
(DGIdb 4.0)
Entrez IDSymbolCategoryInteraction TypesDrug Claim NameDrug NamePMIDs
Page: 1