
|
|||||
|
 | |
| |
| |
| |
| |
| |
|
Gene: TMEM165 |
Gene summary for TMEM165 |
| Gene information | Species | Human | Gene symbol | TMEM165 | Gene ID | 55858 |
| Gene name | transmembrane protein 165 | |
| Gene Alias | CDG2K | |
| Cytomap | 4q12 | |
| Gene Type | protein-coding | GO ID | GO:0000041 | UniProtAcc | Q9HC07 |
Top |
Malignant transformation analysis |
| Identification of the aberrant gene expression in precancerous and cancerous lesions by comparing the gene expression of stem-like cells in diseased tissues with normal stem cells |
| Entrez ID | Symbol | Replicates | Species | Organ | Tissue | Adj P-value | Log2FC | Malignancy |
| 55858 | TMEM165 | GSM4909281 | Human | Breast | IDC | 2.64e-05 | -2.41e-01 | 0.21 |
| 55858 | TMEM165 | GSM4909285 | Human | Breast | IDC | 3.55e-07 | -8.23e-02 | 0.21 |
| 55858 | TMEM165 | GSM4909286 | Human | Breast | IDC | 2.95e-20 | -4.77e-01 | 0.1081 |
| 55858 | TMEM165 | GSM4909287 | Human | Breast | IDC | 1.61e-09 | -3.78e-01 | 0.2057 |
| 55858 | TMEM165 | GSM4909288 | Human | Breast | IDC | 1.91e-09 | -6.60e-01 | 0.0988 |
| 55858 | TMEM165 | GSM4909290 | Human | Breast | IDC | 2.28e-04 | -2.72e-01 | 0.2096 |
| 55858 | TMEM165 | GSM4909293 | Human | Breast | IDC | 1.08e-11 | -2.53e-01 | 0.1581 |
| 55858 | TMEM165 | GSM4909294 | Human | Breast | IDC | 8.48e-26 | -6.58e-01 | 0.2022 |
| 55858 | TMEM165 | GSM4909296 | Human | Breast | IDC | 2.75e-21 | -6.28e-01 | 0.1524 |
| 55858 | TMEM165 | GSM4909297 | Human | Breast | IDC | 2.51e-20 | -5.23e-01 | 0.1517 |
| 55858 | TMEM165 | GSM4909298 | Human | Breast | IDC | 1.23e-13 | -2.94e-01 | 0.1551 |
| 55858 | TMEM165 | GSM4909299 | Human | Breast | IDC | 1.48e-04 | -2.81e-01 | 0.035 |
| 55858 | TMEM165 | GSM4909301 | Human | Breast | IDC | 3.01e-25 | -6.74e-01 | 0.1577 |
| 55858 | TMEM165 | GSM4909302 | Human | Breast | IDC | 2.47e-11 | -4.32e-01 | 0.1545 |
| 55858 | TMEM165 | GSM4909304 | Human | Breast | IDC | 6.67e-07 | -2.82e-01 | 0.1636 |
| 55858 | TMEM165 | GSM4909305 | Human | Breast | IDC | 2.73e-04 | -1.67e-01 | 0.0436 |
| 55858 | TMEM165 | GSM4909306 | Human | Breast | IDC | 6.08e-05 | -2.56e-01 | 0.1564 |
| 55858 | TMEM165 | GSM4909307 | Human | Breast | IDC | 4.43e-20 | -6.06e-01 | 0.1569 |
| 55858 | TMEM165 | GSM4909308 | Human | Breast | IDC | 3.01e-15 | -4.52e-01 | 0.158 |
| 55858 | TMEM165 | GSM4909309 | Human | Breast | IDC | 5.98e-13 | -4.80e-01 | 0.0483 |
| Page: 1 2 3 4 5 6 7 8 9 10 11 12 |
| Tissue | Expression Dynamics | Abbreviation |
| Breast | 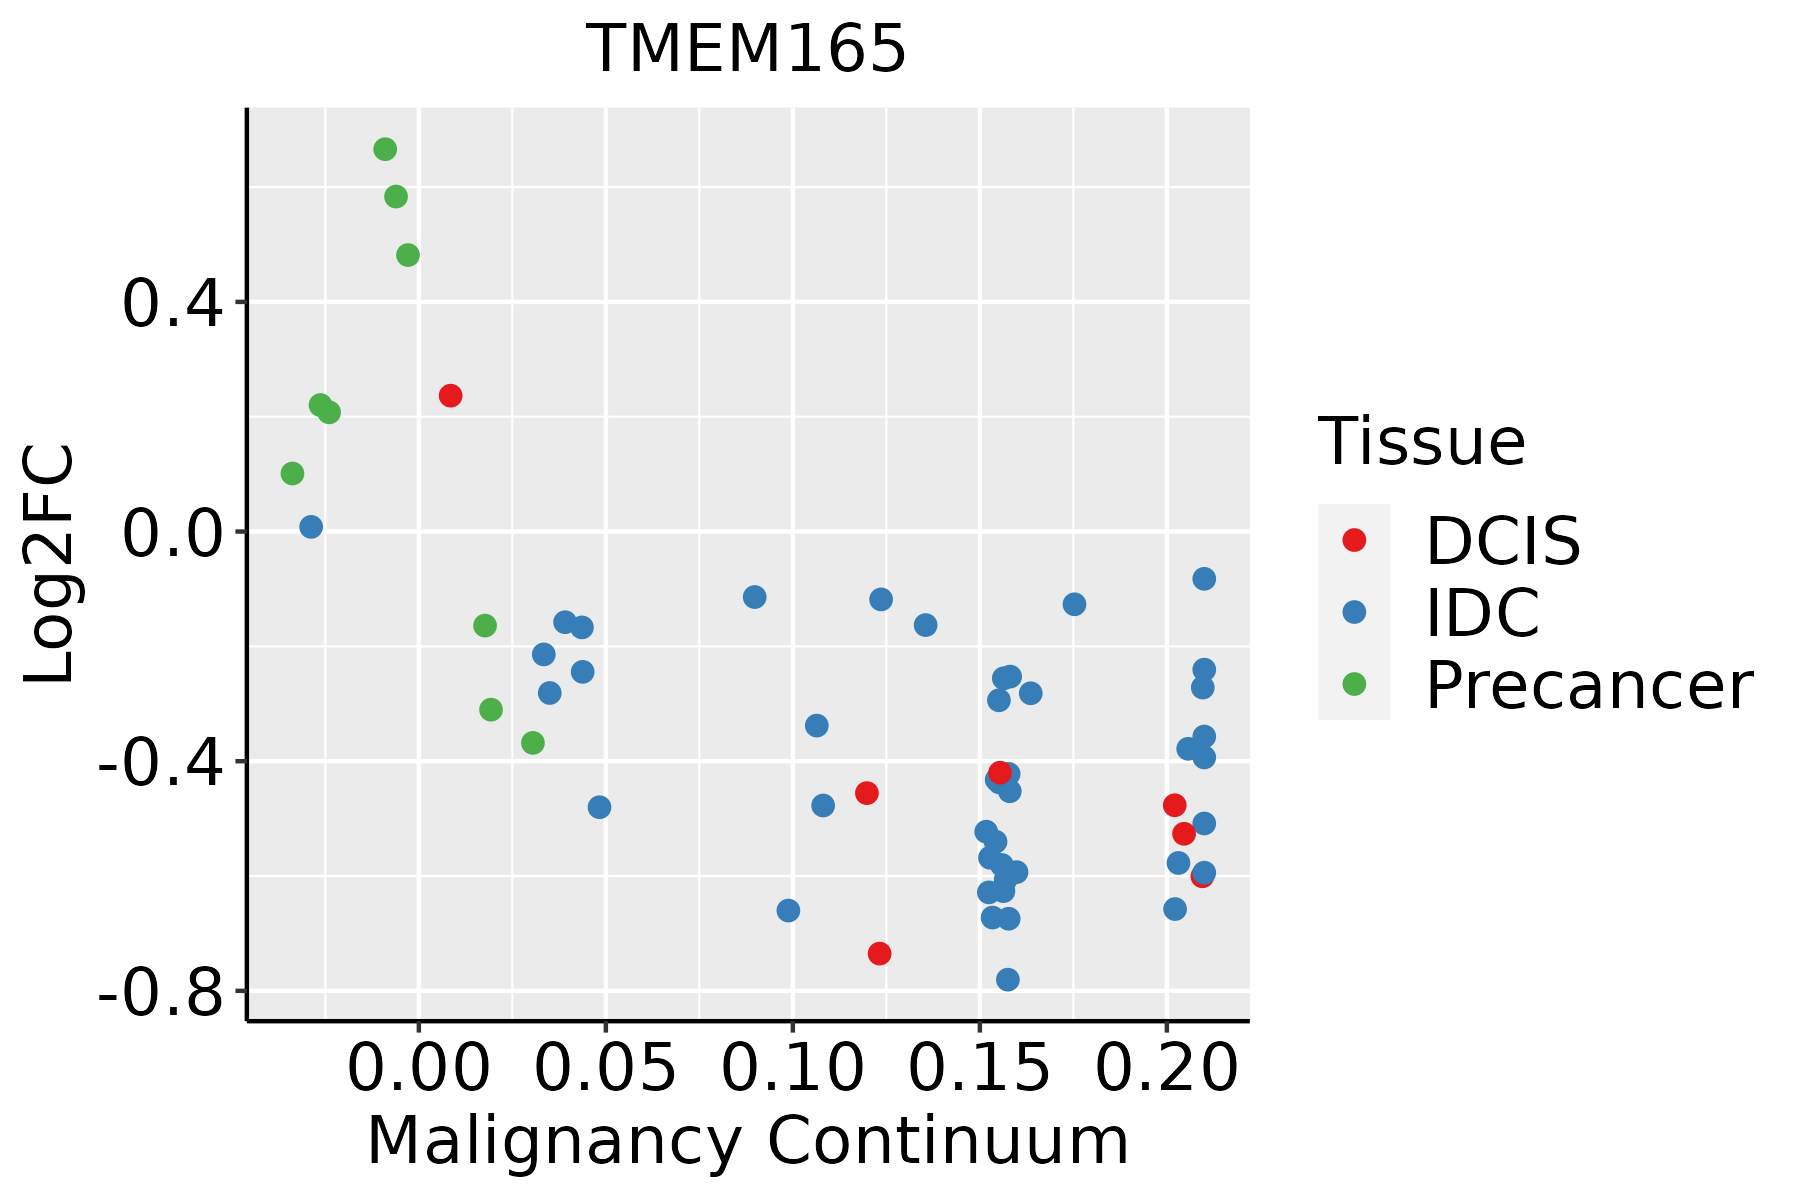 | IDC: Invasive ductal carcinoma |
| DCIS: Ductal carcinoma in situ | ||
| Precancer(BRCA1-mut): Precancerous lesion from BRCA1 mutation carriers | ||
| Cervix |  | CC: Cervix cancer |
| HSIL_HPV: HPV-infected high-grade squamous intraepithelial lesions | ||
| N_HPV: HPV-infected normal cervix | ||
| Esophagus | 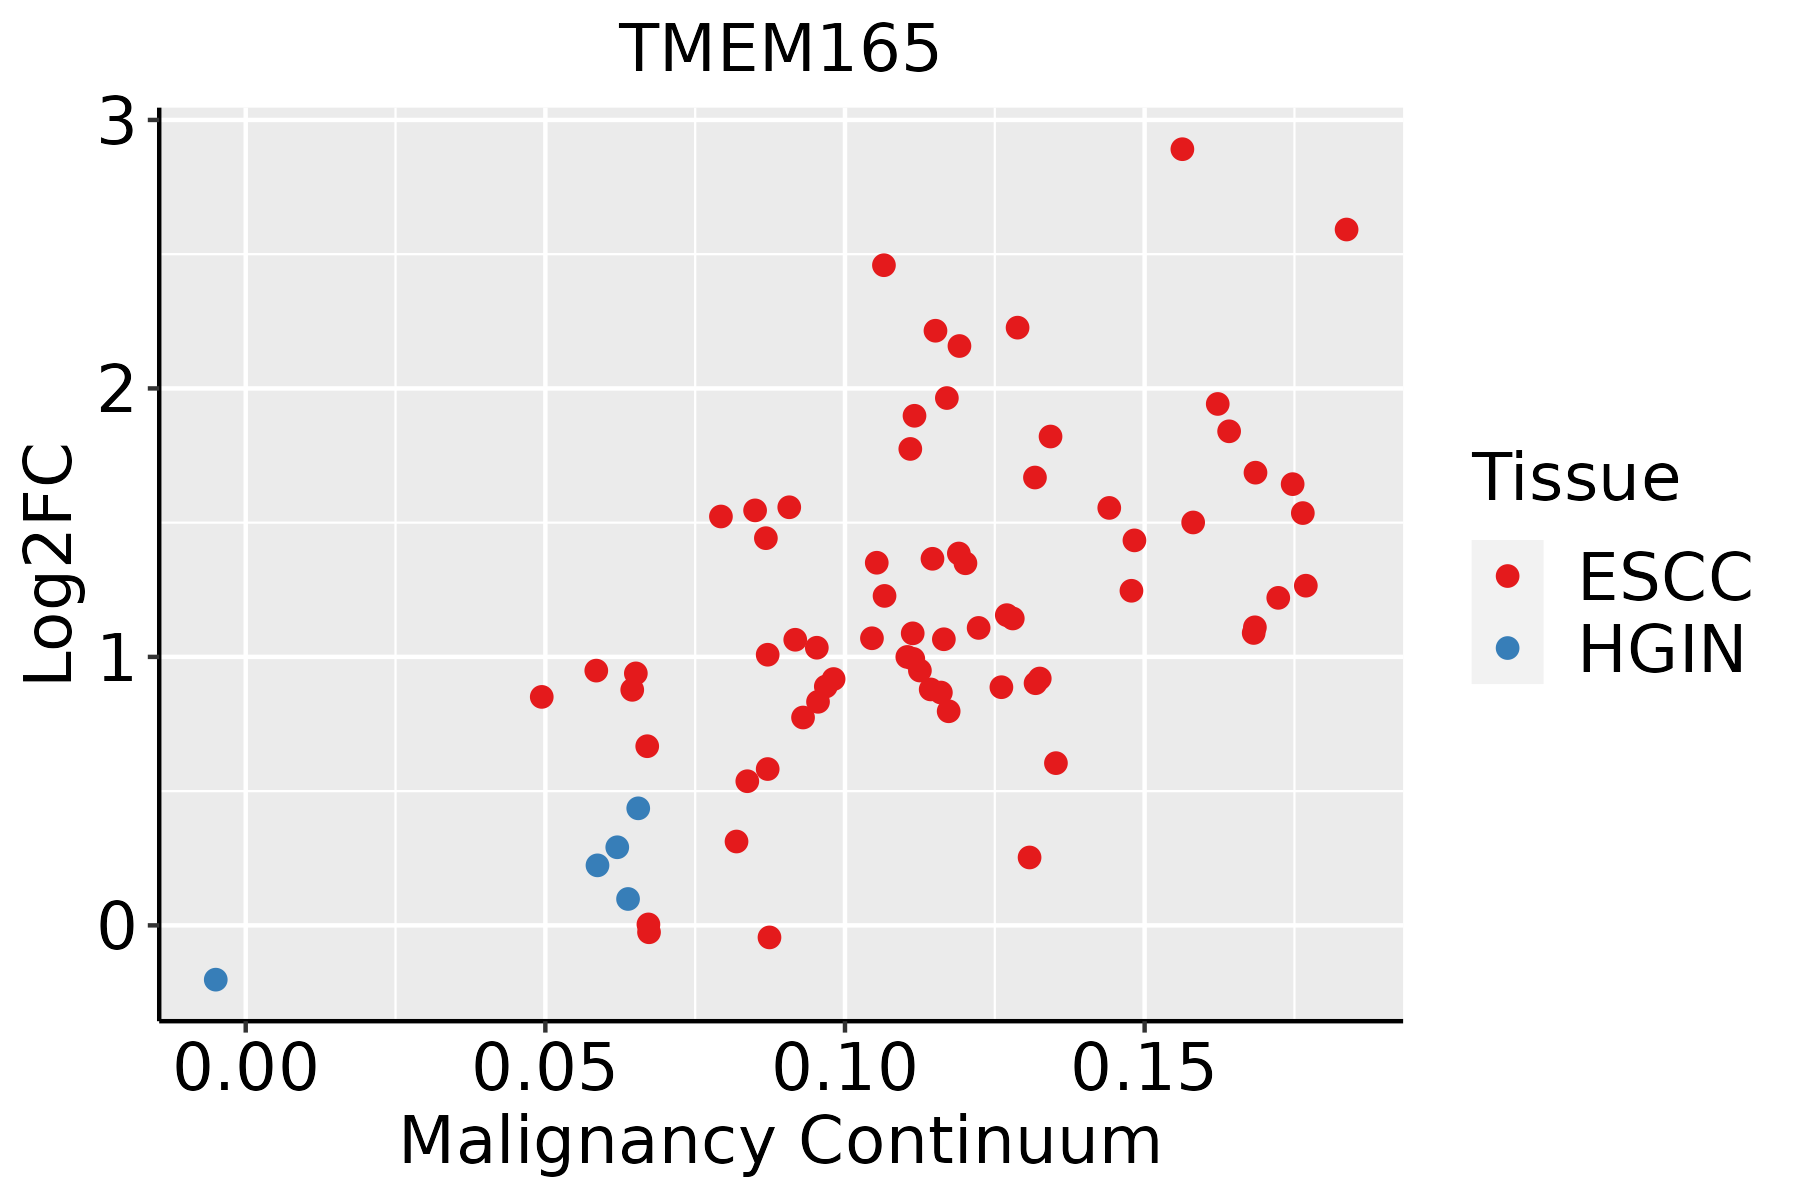 | ESCC: Esophageal squamous cell carcinoma |
| HGIN: High-grade intraepithelial neoplasias | ||
| LGIN: Low-grade intraepithelial neoplasias | ||
| Liver | 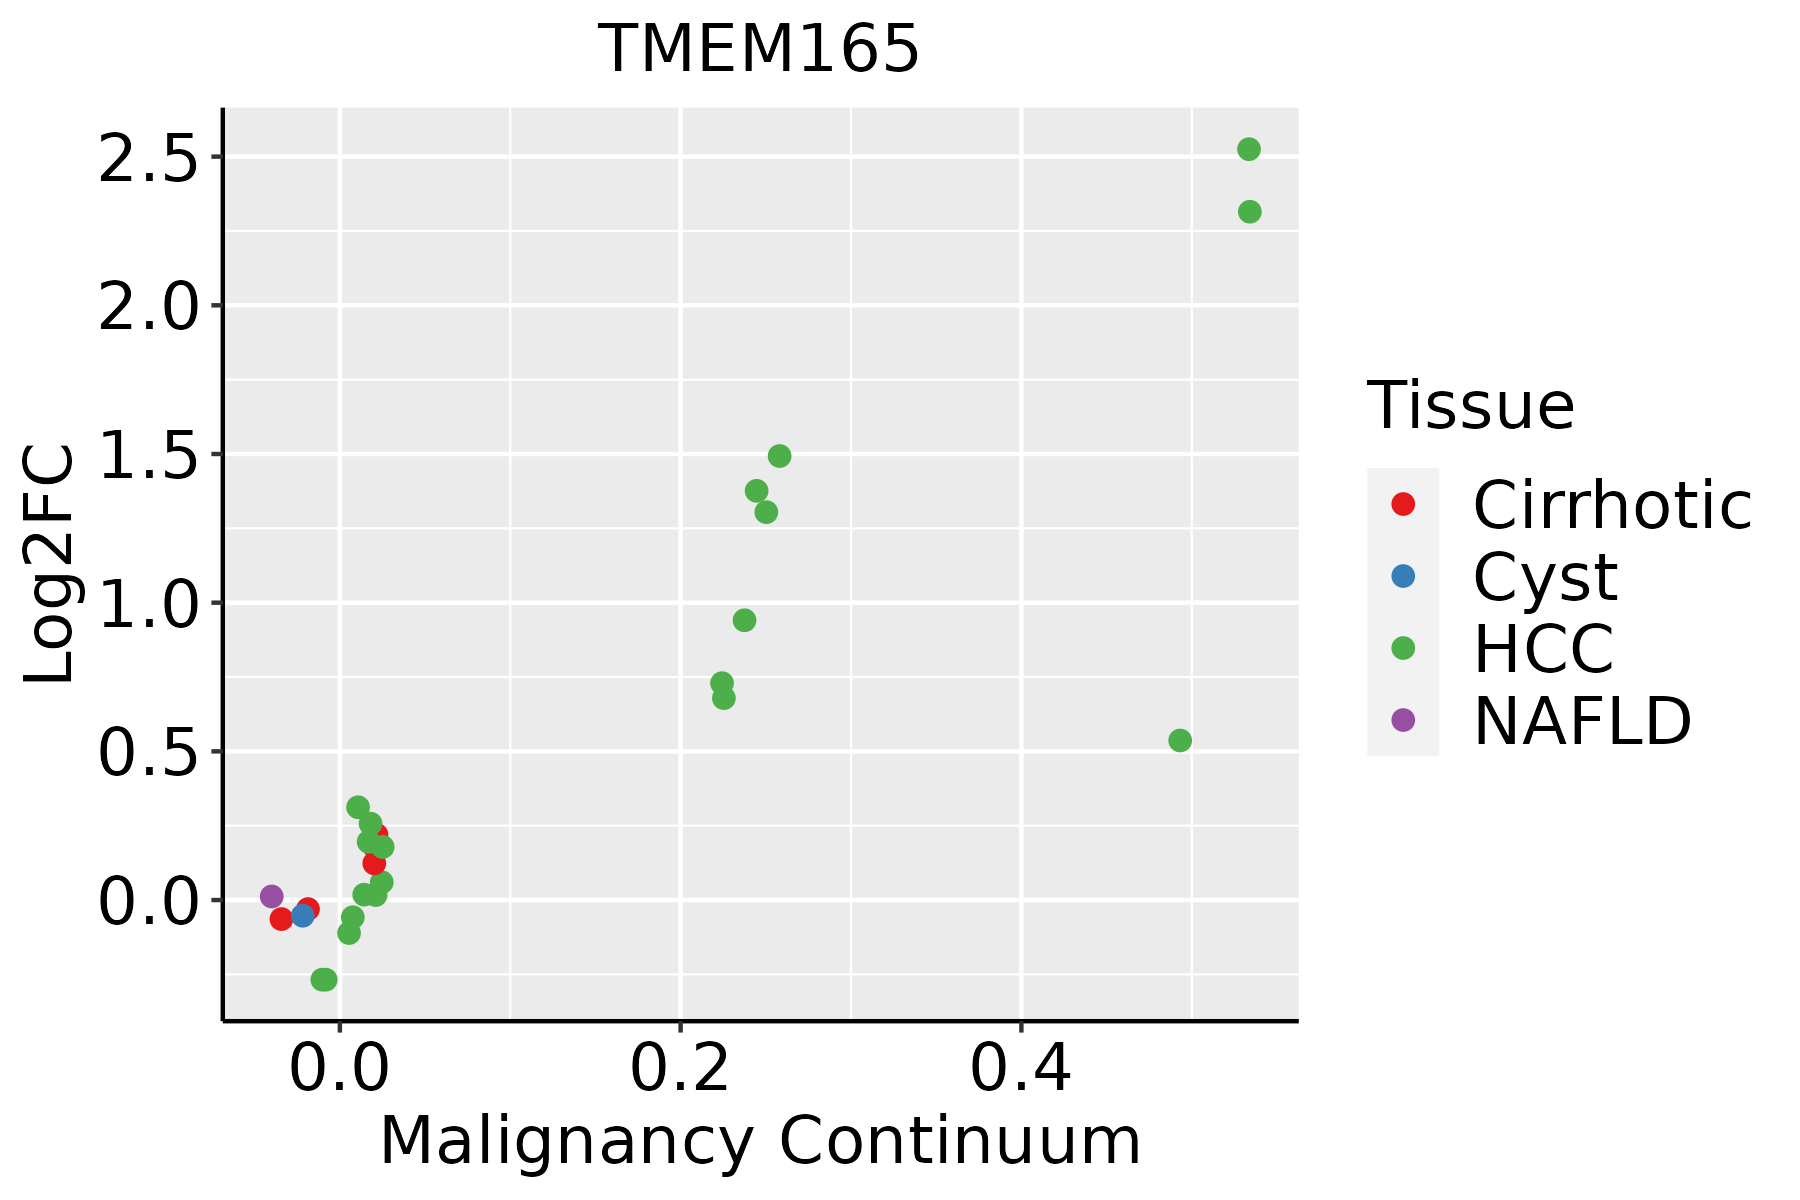 | HCC: Hepatocellular carcinoma |
| NAFLD: Non-alcoholic fatty liver disease | ||
| Lung |  | AAH: Atypical adenomatous hyperplasia |
| AIS: Adenocarcinoma in situ | ||
| IAC: Invasive lung adenocarcinoma | ||
| MIA: Minimally invasive adenocarcinoma | ||
| Oral Cavity | 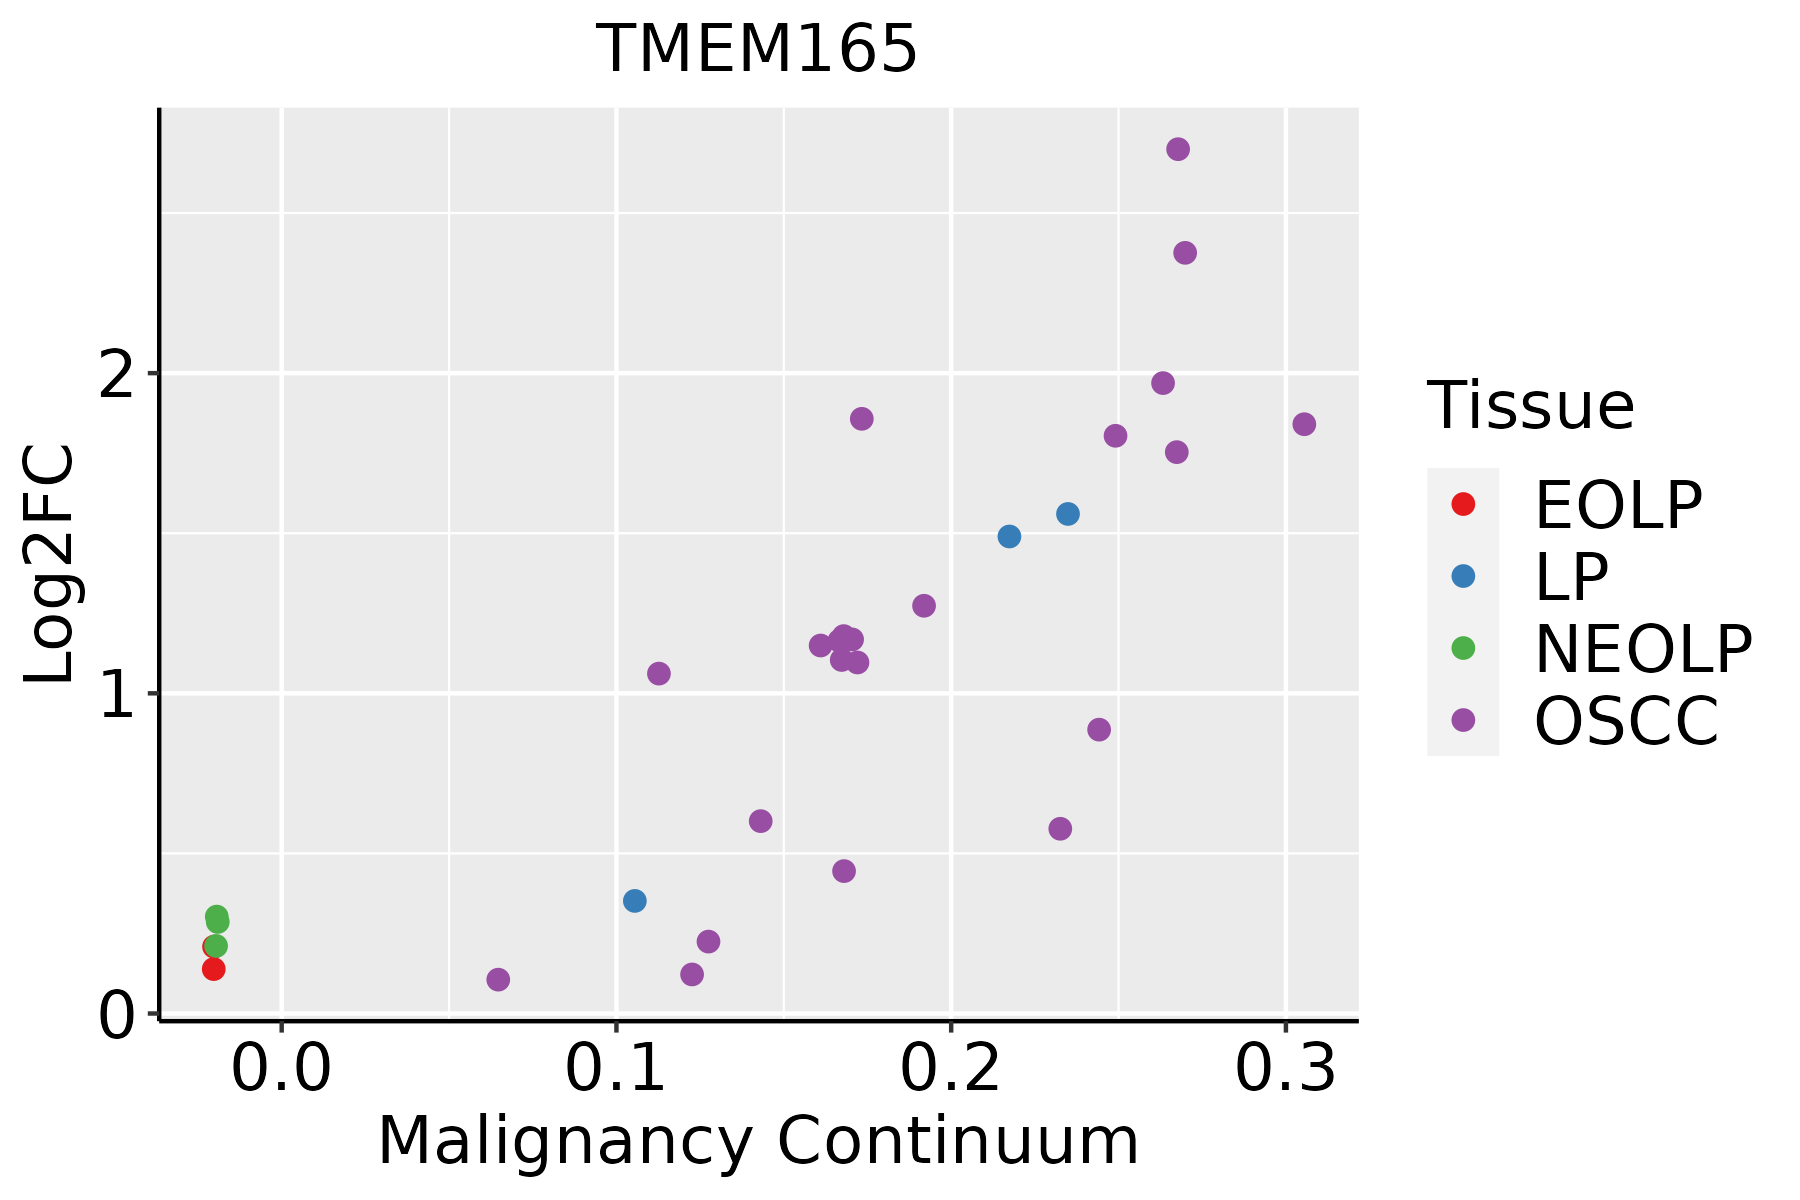 | EOLP: Erosive Oral lichen planus |
| LP: leukoplakia | ||
| NEOLP: Non-erosive oral lichen planus | ||
| OSCC: Oral squamous cell carcinoma | ||
| Prostate | 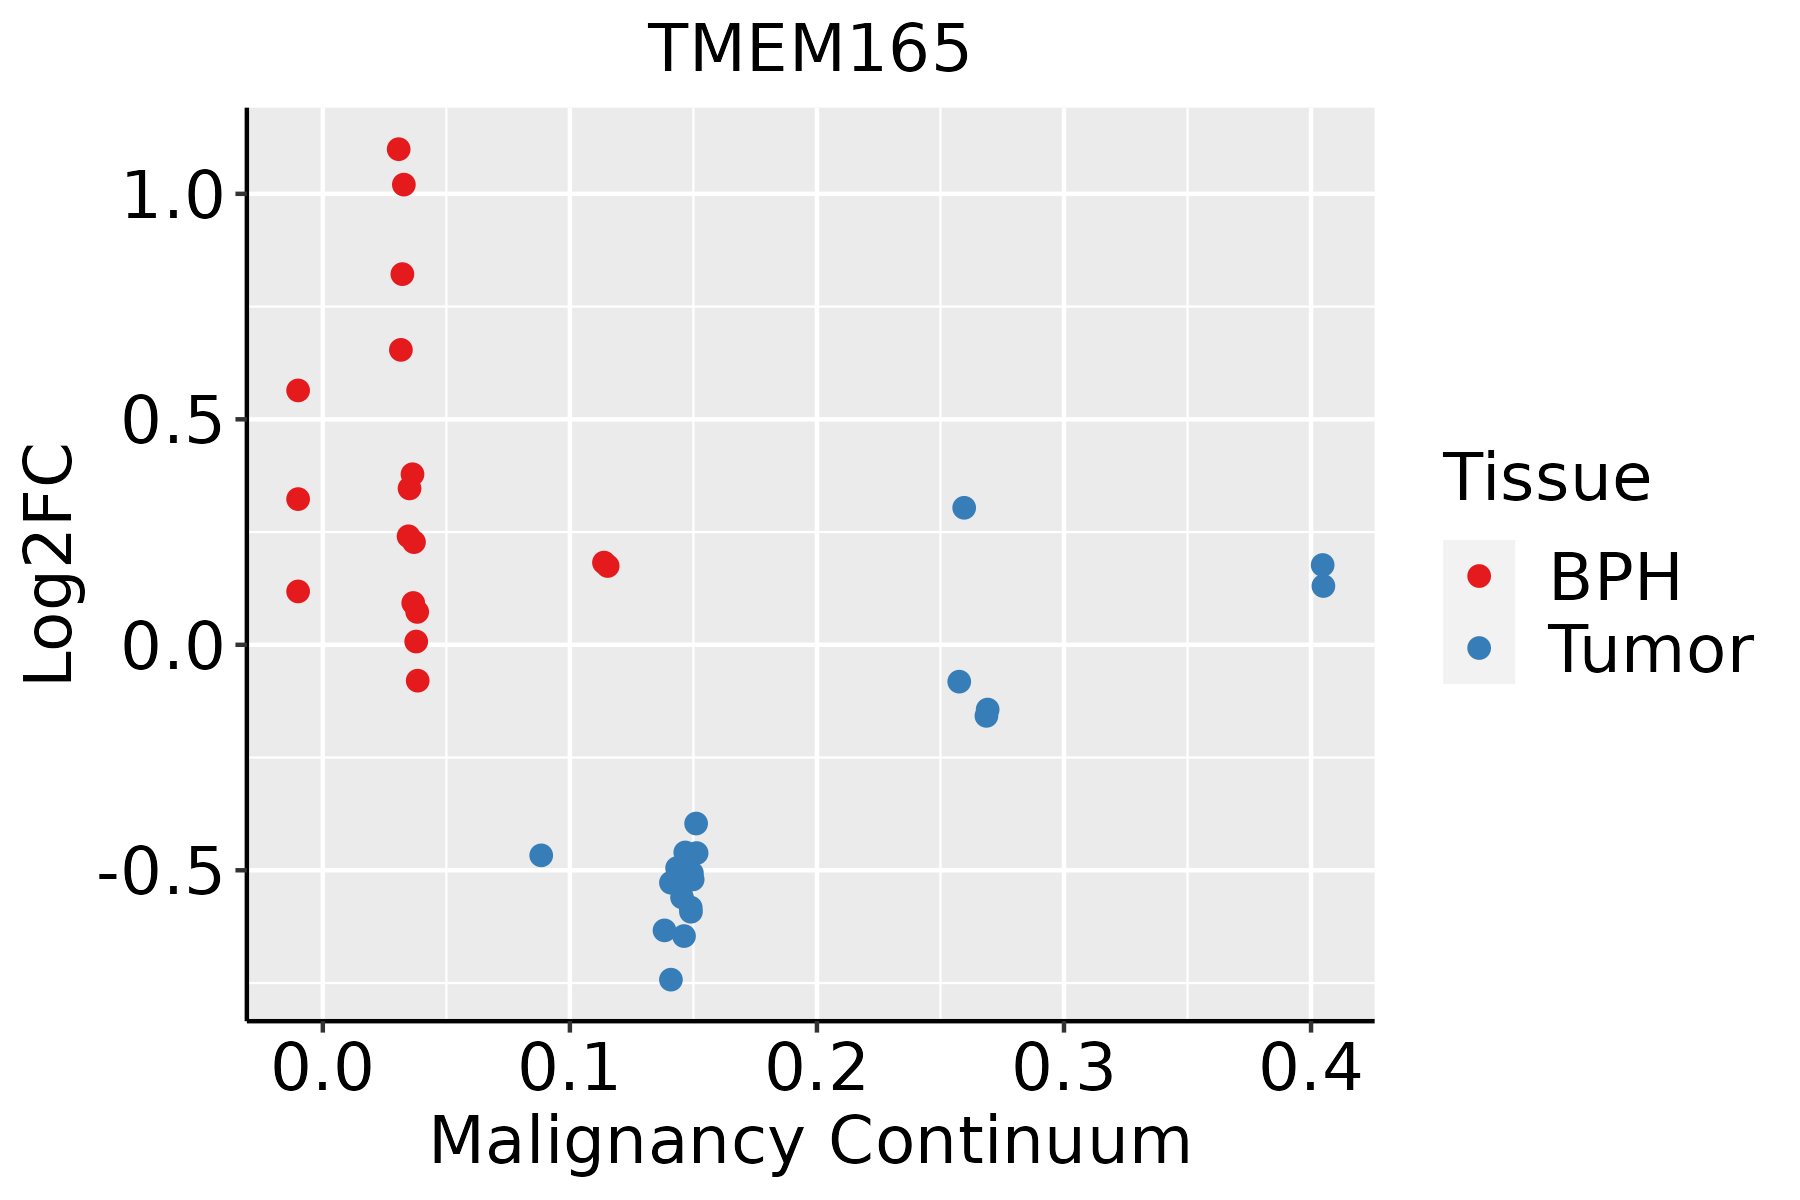 | BPH: Benign Prostatic Hyperplasia |
| Skin | 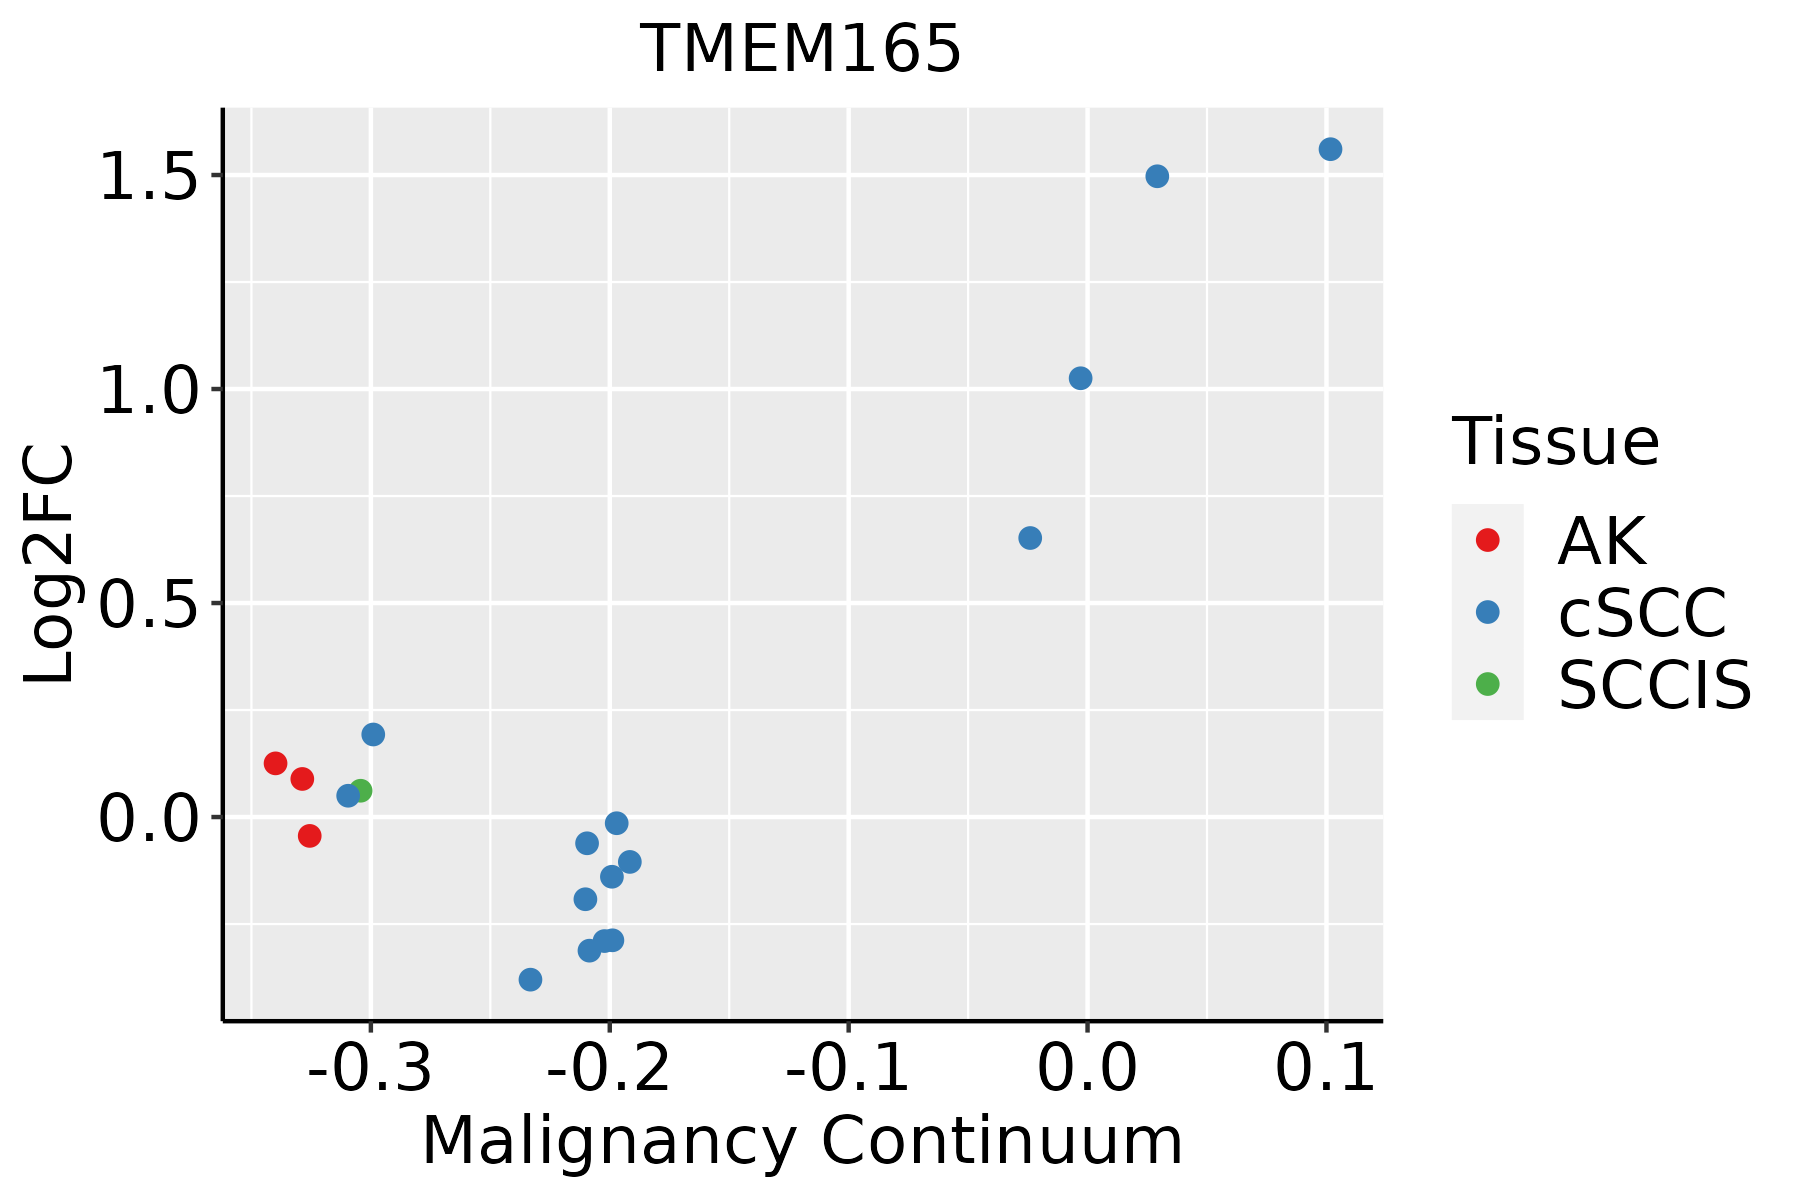 | AK: Actinic keratosis |
| cSCC: Cutaneous squamous cell carcinoma | ||
| SCCIS:squamous cell carcinoma in situ | ||
| Thyroid |  | ATC: Anaplastic thyroid cancer |
| HT: Hashimoto's thyroiditis | ||
| PTC: Papillary thyroid cancer |
| ∗log2FC in expression of this searched gene in stem-like cells from each diseased tissue sample relative to stem-like cells in normal samples in each tissue plotted against the malignancy continuum. Samples are colored based on if they are from different disease stage. |
Top |
Malignant transformation related pathway analysis |
| Find out the enriched GO biological processes and KEGG pathways involved in transition from healthy to precancer to cancer |
| Tissue | Disease Stage | Enriched GO biological Processes |
| Colorectum | AD |  |
| Colorectum | SER |  |
| Colorectum | MSS |  |
| Colorectum | MSI-H |  |
| Colorectum | FAP |  |
| ∗Top 15 enriched GO BP terms are showed in the bar plot of each disease state in each tissue. Each row represents a significant GO biological process which is colored according to the -log10(p.adjust). |
| Page: 1 2 3 4 5 6 7 8 9 |
| GO ID | Tissue | Disease Stage | Description | Gene Ratio | Bg Ratio | pvalue | p.adjust | Count |
| GO:000703311 | Liver | HCC | vacuole organization | 119/7958 | 180/18723 | 1.22e-10 | 4.25e-09 | 119 |
| GO:000648711 | Liver | HCC | protein N-linked glycosylation | 48/7958 | 65/18723 | 2.85e-07 | 5.00e-06 | 48 |
| GO:00070401 | Liver | HCC | lysosome organization | 47/7958 | 74/18723 | 2.13e-04 | 1.63e-03 | 47 |
| GO:00801711 | Liver | HCC | lytic vacuole organization | 47/7958 | 74/18723 | 2.13e-04 | 1.63e-03 | 47 |
| GO:00064862 | Liver | HCC | protein glycosylation | 122/7958 | 226/18723 | 3.11e-04 | 2.21e-03 | 122 |
| GO:00434132 | Liver | HCC | macromolecule glycosylation | 122/7958 | 226/18723 | 3.11e-04 | 2.21e-03 | 122 |
| GO:00700852 | Liver | HCC | glycosylation | 128/7958 | 240/18723 | 4.35e-04 | 2.92e-03 | 128 |
| GO:0009100 | Liver | HCC | glycoprotein metabolic process | 193/7958 | 387/18723 | 1.89e-03 | 9.62e-03 | 193 |
| GO:00000411 | Liver | HCC | transition metal ion transport | 59/7958 | 105/18723 | 3.18e-03 | 1.47e-02 | 59 |
| GO:00064863 | Lung | AIS | protein glycosylation | 35/1849 | 226/18723 | 4.93e-03 | 4.27e-02 | 35 |
| GO:00434133 | Lung | AIS | macromolecule glycosylation | 35/1849 | 226/18723 | 4.93e-03 | 4.27e-02 | 35 |
| GO:00070333 | Lung | AIS | vacuole organization | 29/1849 | 180/18723 | 5.70e-03 | 4.80e-02 | 29 |
| GO:0006816 | Lung | AIS | calcium ion transport | 58/1849 | 422/18723 | 6.08e-03 | 4.98e-02 | 58 |
| GO:00070335 | Oral cavity | OSCC | vacuole organization | 115/7305 | 180/18723 | 1.11e-11 | 4.00e-10 | 115 |
| GO:00070402 | Oral cavity | OSCC | lysosome organization | 51/7305 | 74/18723 | 1.77e-07 | 2.87e-06 | 51 |
| GO:00801712 | Oral cavity | OSCC | lytic vacuole organization | 51/7305 | 74/18723 | 1.77e-07 | 2.87e-06 | 51 |
| GO:00064875 | Oral cavity | OSCC | protein N-linked glycosylation | 44/7305 | 65/18723 | 2.63e-06 | 3.26e-05 | 44 |
| GO:00357512 | Oral cavity | OSCC | regulation of lysosomal lumen pH | 14/7305 | 16/18723 | 9.15e-05 | 6.93e-04 | 14 |
| GO:00091001 | Oral cavity | OSCC | glycoprotein metabolic process | 185/7305 | 387/18723 | 2.37e-04 | 1.54e-03 | 185 |
| GO:00091011 | Oral cavity | OSCC | glycoprotein biosynthetic process | 151/7305 | 317/18723 | 1.01e-03 | 5.26e-03 | 151 |
| Page: 1 2 3 4 |
| Pathway ID | Tissue | Disease Stage | Description | Gene Ratio | Bg Ratio | pvalue | p.adjust | qvalue | Count |
| Page: 1 |
Top |
Cell-cell communication analysis |
| Identification of potential cell-cell interactions between two cell types and their ligand-receptor pairs for different disease states |
| Ligand | Receptor | LRpair | Pathway | Tissue | Disease Stage |
| Page: 1 |
Top |
Single-cell gene regulatory network inference analysis |
| Find out the significant the regulons (TFs) and the target genes of each regulon across cell types for different disease states |
| TF | Cell Type | Tissue | Disease Stage | Target Gene | RSS | Regulon Activity |
| ∗The dot plots of a searched regulon are shown for all cell subpopulations in each disease state of each tissue based on the regulon specific score inferred using pySCENIC and by calculating the average expression. |
| Page: 1 |
Top |
Somatic mutation of malignant transformation related genes |
| Annotation of somatic variants for genes involved in malignant transformation |
| Hugo Symbol | Variant Class | Variant Classification | dbSNP RS | HGVSc | HGVSp | HGVSp Short | SWISSPROT | BIOTYPE | SIFT | PolyPhen | Tumor Sample Barcode | Tissue | Histology | Sex | Age | Stage | Therapy Types | Drugs | Outcome |
| TMEM165 | SNV | Missense_Mutation | novel | c.965N>G | p.Ser322Cys | p.S322C | Q9HC07 | protein_coding | deleterious(0.01) | benign(0.436) | TCGA-AC-A23H-01 | Breast | breast invasive carcinoma | Female | >=65 | I/II | Unknown | Unknown | PD |
| TMEM165 | deletion | Frame_Shift_Del | novel | c.896delN | p.Thr299MetfsTer2 | p.T299Mfs*2 | Q9HC07 | protein_coding | TCGA-D8-A27V-01 | Breast | breast invasive carcinoma | Female | <65 | I/II | Hormone Therapy | tamoxiphen | SD | ||
| TMEM165 | SNV | Missense_Mutation | c.235C>T | p.His79Tyr | p.H79Y | Q9HC07 | protein_coding | tolerated(0.05) | benign(0.089) | TCGA-EK-A2RJ-01 | Cervix | cervical & endocervical cancer | Female | <65 | I/II | Unknown | Unknown | SD | |
| TMEM165 | SNV | Missense_Mutation | novel | c.421N>G | p.Thr141Ala | p.T141A | Q9HC07 | protein_coding | deleterious(0) | probably_damaging(0.999) | TCGA-AA-3715-01 | Colorectum | colon adenocarcinoma | Male | >=65 | I/II | Unknown | Unknown | PD |
| TMEM165 | SNV | Missense_Mutation | c.842C>T | p.Thr281Met | p.T281M | Q9HC07 | protein_coding | deleterious(0) | probably_damaging(0.999) | TCGA-AA-3821-01 | Colorectum | colon adenocarcinoma | Female | >=65 | I/II | Unknown | Unknown | SD | |
| TMEM165 | SNV | Missense_Mutation | rs752610788 | c.919N>A | p.Val307Ile | p.V307I | Q9HC07 | protein_coding | deleterious(0.01) | probably_damaging(0.939) | TCGA-CA-6717-01 | Colorectum | colon adenocarcinoma | Male | <65 | I/II | Chemotherapy | oxaliplatin | CR |
| TMEM165 | SNV | Missense_Mutation | rs200205156 | c.617G>A | p.Arg206Gln | p.R206Q | Q9HC07 | protein_coding | tolerated(0.08) | possibly_damaging(0.467) | TCGA-EI-6917-01 | Colorectum | rectum adenocarcinoma | Male | <65 | III/IV | Chemotherapy | 5fluorouracil+oxaciplatina+l-folinian | SD |
| TMEM165 | insertion | Frame_Shift_Ins | novel | c.505_506insT | p.Gly171TrpfsTer3 | p.G171Wfs*3 | Q9HC07 | protein_coding | TCGA-G4-6302-01 | Colorectum | colon adenocarcinoma | Female | >=65 | I/II | Unknown | Unknown | SD | ||
| TMEM165 | SNV | Missense_Mutation | novel | c.316N>A | p.Val106Ile | p.V106I | Q9HC07 | protein_coding | tolerated(0.1) | possibly_damaging(0.705) | TCGA-A5-A1OF-01 | Endometrium | uterine corpus endometrioid carcinoma | Female | <65 | I/II | Unknown | Unknown | SD |
| TMEM165 | SNV | Missense_Mutation | novel | c.643N>T | p.Asp215Tyr | p.D215Y | Q9HC07 | protein_coding | deleterious(0) | probably_damaging(0.99) | TCGA-AP-A1DV-01 | Endometrium | uterine corpus endometrioid carcinoma | Female | <65 | I/II | Unknown | Unknown | SD |
| Page: 1 2 3 |
Top |
Related drugs of malignant transformation related genes |
| Identification of chemicals and drugs interact with genes involved in malignant transfromation |
| (DGIdb 4.0) |
| Entrez ID | Symbol | Category | Interaction Types | Drug Claim Name | Drug Name | PMIDs |
| Page: 1 |

Copyright 2023-Present -The University of Texas Health Science Center at Houston |