
|
|||||
|
 | |
| |
| |
| |
| |
| |
|
Gene: TMBIM1 |
Gene summary for TMBIM1 |
| Gene information | Species | Human | Gene symbol | TMBIM1 | Gene ID | 64114 |
| Gene name | transmembrane BAX inhibitor motif containing 1 | |
| Gene Alias | LFG3 | |
| Cytomap | 2q35 | |
| Gene Type | protein-coding | GO ID | GO:0001974 | UniProtAcc | A0A024R472 |
Top |
Malignant transformation analysis |
| Identification of the aberrant gene expression in precancerous and cancerous lesions by comparing the gene expression of stem-like cells in diseased tissues with normal stem cells |
| Entrez ID | Symbol | Replicates | Species | Organ | Tissue | Adj P-value | Log2FC | Malignancy |
| 64114 | TMBIM1 | HTA11_3410_2000001011 | Human | Colorectum | AD | 2.60e-02 | 1.74e-01 | 0.0155 |
| 64114 | TMBIM1 | HTA11_2487_2000001011 | Human | Colorectum | SER | 2.91e-32 | 1.54e+00 | -0.1808 |
| 64114 | TMBIM1 | HTA11_1938_2000001011 | Human | Colorectum | AD | 1.44e-29 | 1.07e+00 | -0.0811 |
| 64114 | TMBIM1 | HTA11_78_2000001011 | Human | Colorectum | AD | 9.68e-15 | 6.37e-01 | -0.1088 |
| 64114 | TMBIM1 | HTA11_347_2000001011 | Human | Colorectum | AD | 1.92e-42 | 1.05e+00 | -0.1954 |
| 64114 | TMBIM1 | HTA11_411_2000001011 | Human | Colorectum | SER | 2.07e-16 | 2.20e+00 | -0.2602 |
| 64114 | TMBIM1 | HTA11_2112_2000001011 | Human | Colorectum | SER | 3.75e-18 | 1.69e+00 | -0.2196 |
| 64114 | TMBIM1 | HTA11_3361_2000001011 | Human | Colorectum | AD | 2.58e-09 | 6.51e-01 | -0.1207 |
| 64114 | TMBIM1 | HTA11_83_2000001011 | Human | Colorectum | SER | 2.74e-13 | 6.94e-01 | -0.1526 |
| 64114 | TMBIM1 | HTA11_696_2000001011 | Human | Colorectum | AD | 1.78e-30 | 8.14e-01 | -0.1464 |
| 64114 | TMBIM1 | HTA11_866_2000001011 | Human | Colorectum | AD | 9.90e-17 | 5.90e-01 | -0.1001 |
| 64114 | TMBIM1 | HTA11_1391_2000001011 | Human | Colorectum | AD | 9.03e-21 | 9.70e-01 | -0.059 |
| 64114 | TMBIM1 | HTA11_2992_2000001011 | Human | Colorectum | SER | 3.15e-10 | 9.01e-01 | -0.1706 |
| 64114 | TMBIM1 | HTA11_5212_2000001011 | Human | Colorectum | AD | 9.61e-16 | 1.29e+00 | -0.2061 |
| 64114 | TMBIM1 | HTA11_5216_2000001011 | Human | Colorectum | SER | 5.05e-04 | 5.60e-01 | -0.1462 |
| 64114 | TMBIM1 | HTA11_546_2000001011 | Human | Colorectum | AD | 2.23e-05 | 4.77e-01 | -0.0842 |
| 64114 | TMBIM1 | HTA11_866_3004761011 | Human | Colorectum | AD | 7.42e-07 | 3.45e-01 | 0.096 |
| 64114 | TMBIM1 | HTA11_8622_2000001021 | Human | Colorectum | SER | 1.36e-05 | 6.04e-01 | 0.0528 |
| 64114 | TMBIM1 | HTA11_7663_2000001011 | Human | Colorectum | SER | 3.15e-04 | 4.71e-01 | 0.0131 |
| 64114 | TMBIM1 | HTA11_10711_2000001011 | Human | Colorectum | AD | 2.92e-05 | 4.82e-01 | 0.0338 |
| Page: 1 2 3 4 5 6 7 8 9 10 |
| Tissue | Expression Dynamics | Abbreviation |
| Colorectum (GSE201348) |  | FAP: Familial adenomatous polyposis |
| CRC: Colorectal cancer | ||
| Colorectum (HTA11) |  | AD: Adenomas |
| SER: Sessile serrated lesions | ||
| MSI-H: Microsatellite-high colorectal cancer | ||
| MSS: Microsatellite stable colorectal cancer | ||
| Esophagus | 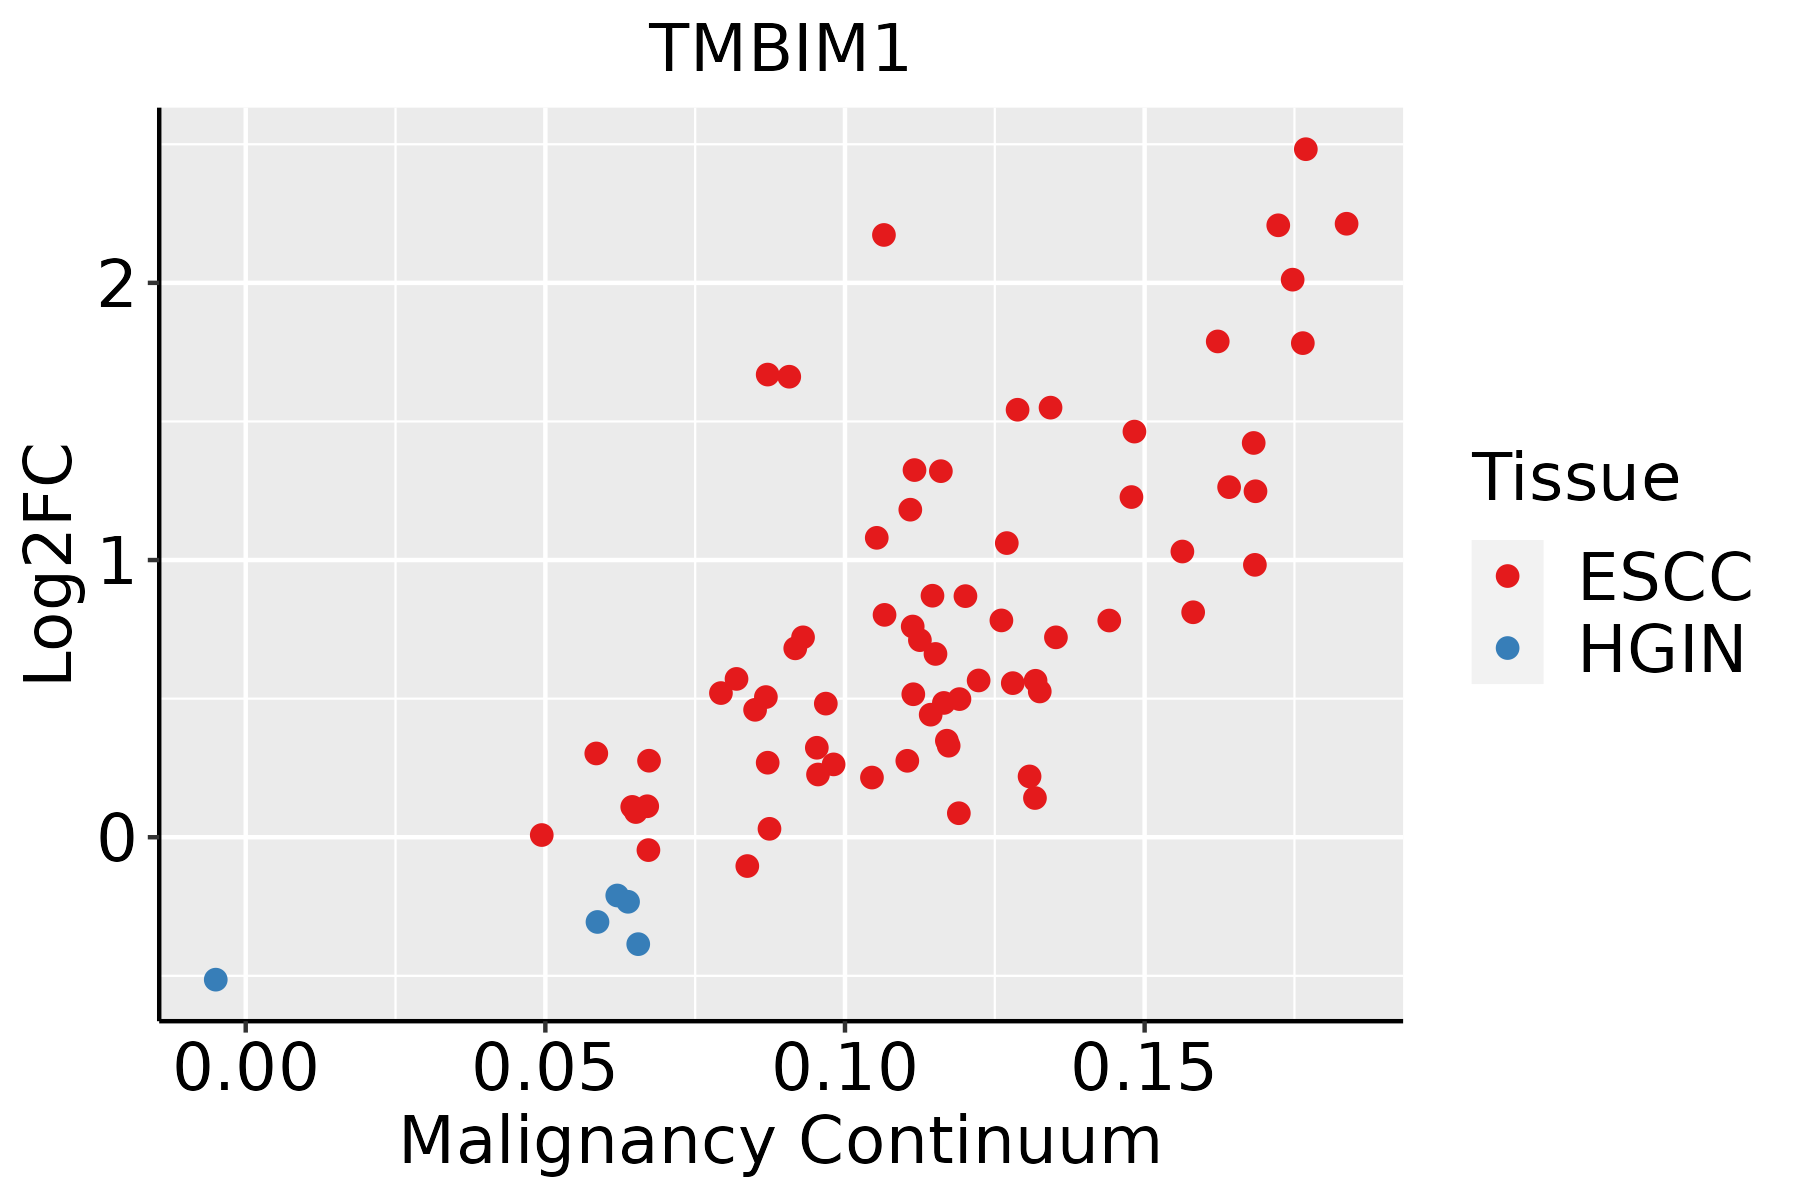 | ESCC: Esophageal squamous cell carcinoma |
| HGIN: High-grade intraepithelial neoplasias | ||
| LGIN: Low-grade intraepithelial neoplasias | ||
| GC |  | CAG: Chronic atrophic gastritis |
| CAG with IM: Chronic atrophic gastritis with intestinal metaplasia | ||
| CSG: Chronic superficial gastritis | ||
| GC: Gastric cancer | ||
| SIM: Severe intestinal metaplasia | ||
| WIM: Wild intestinal metaplasia | ||
| Liver | 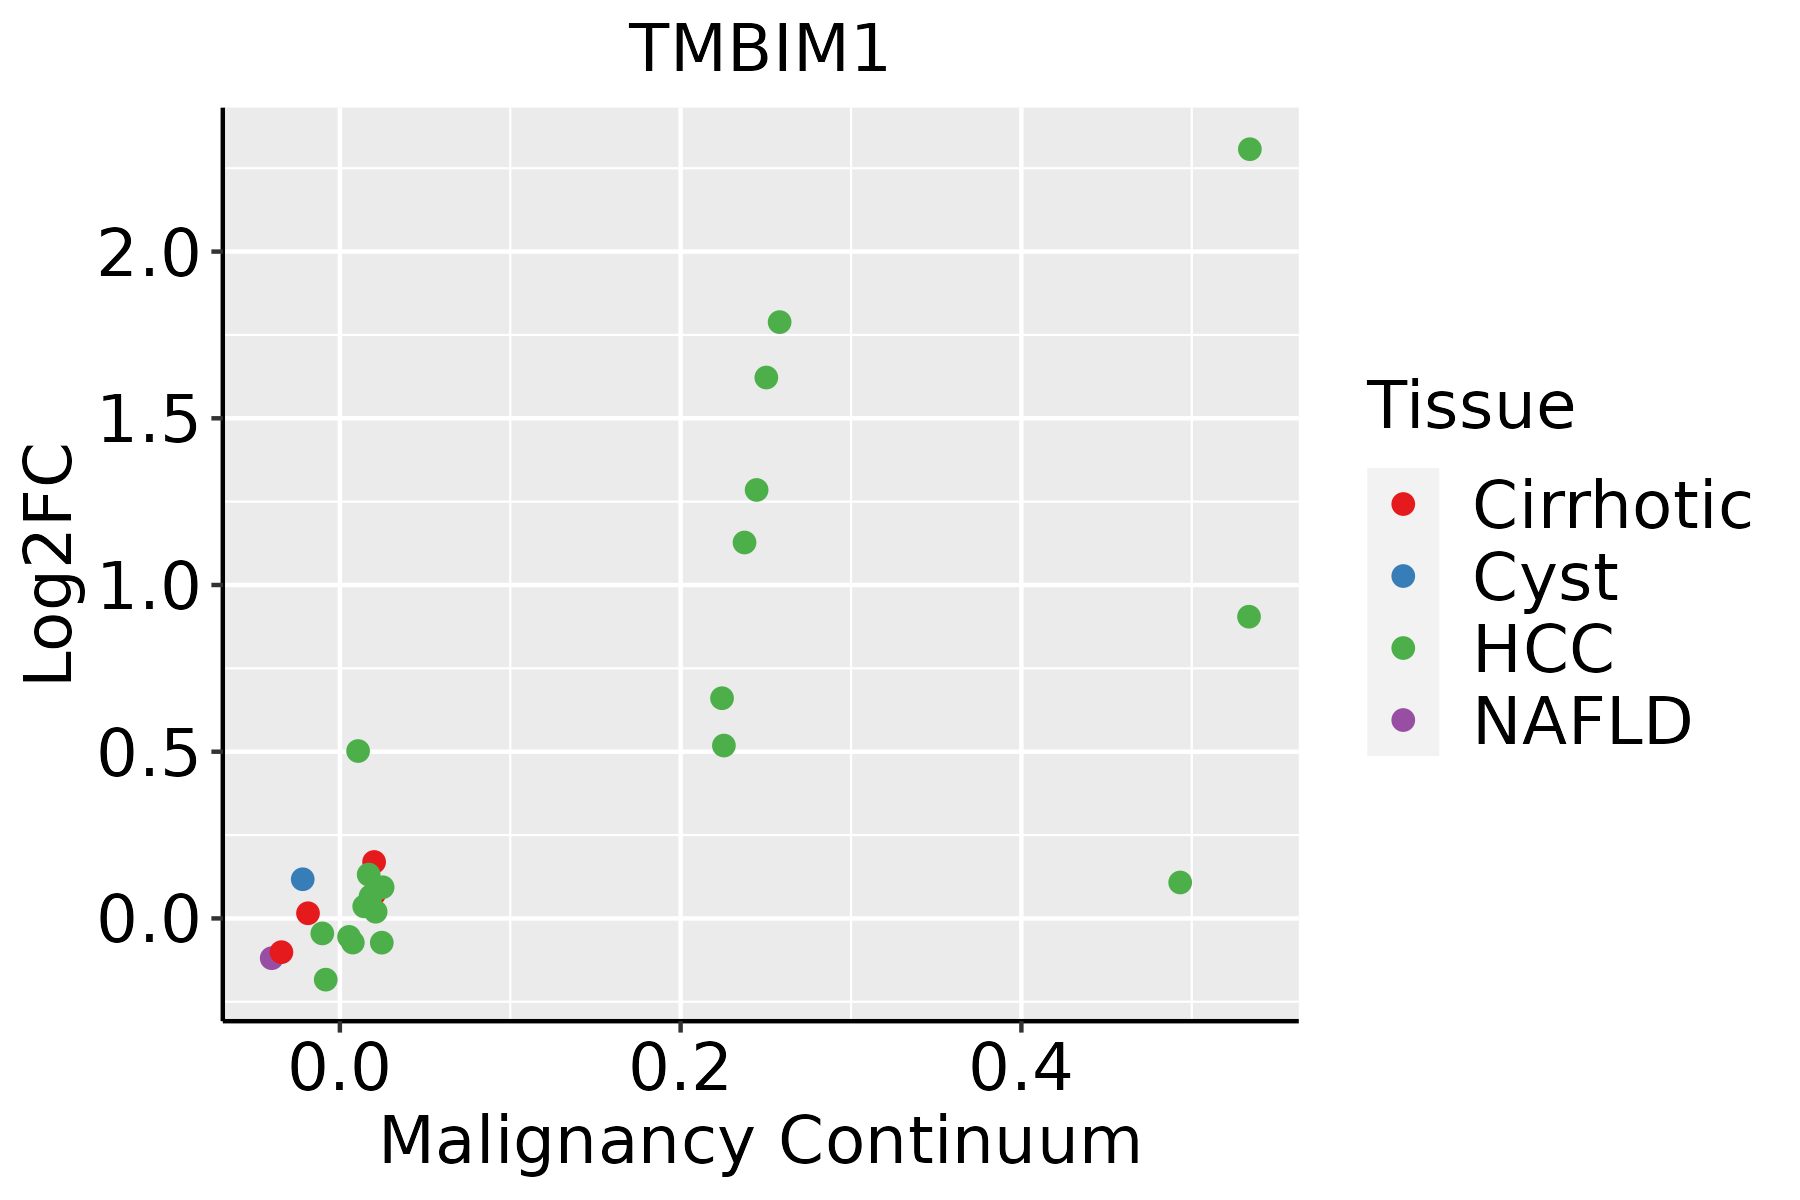 | HCC: Hepatocellular carcinoma |
| NAFLD: Non-alcoholic fatty liver disease | ||
| Oral Cavity | 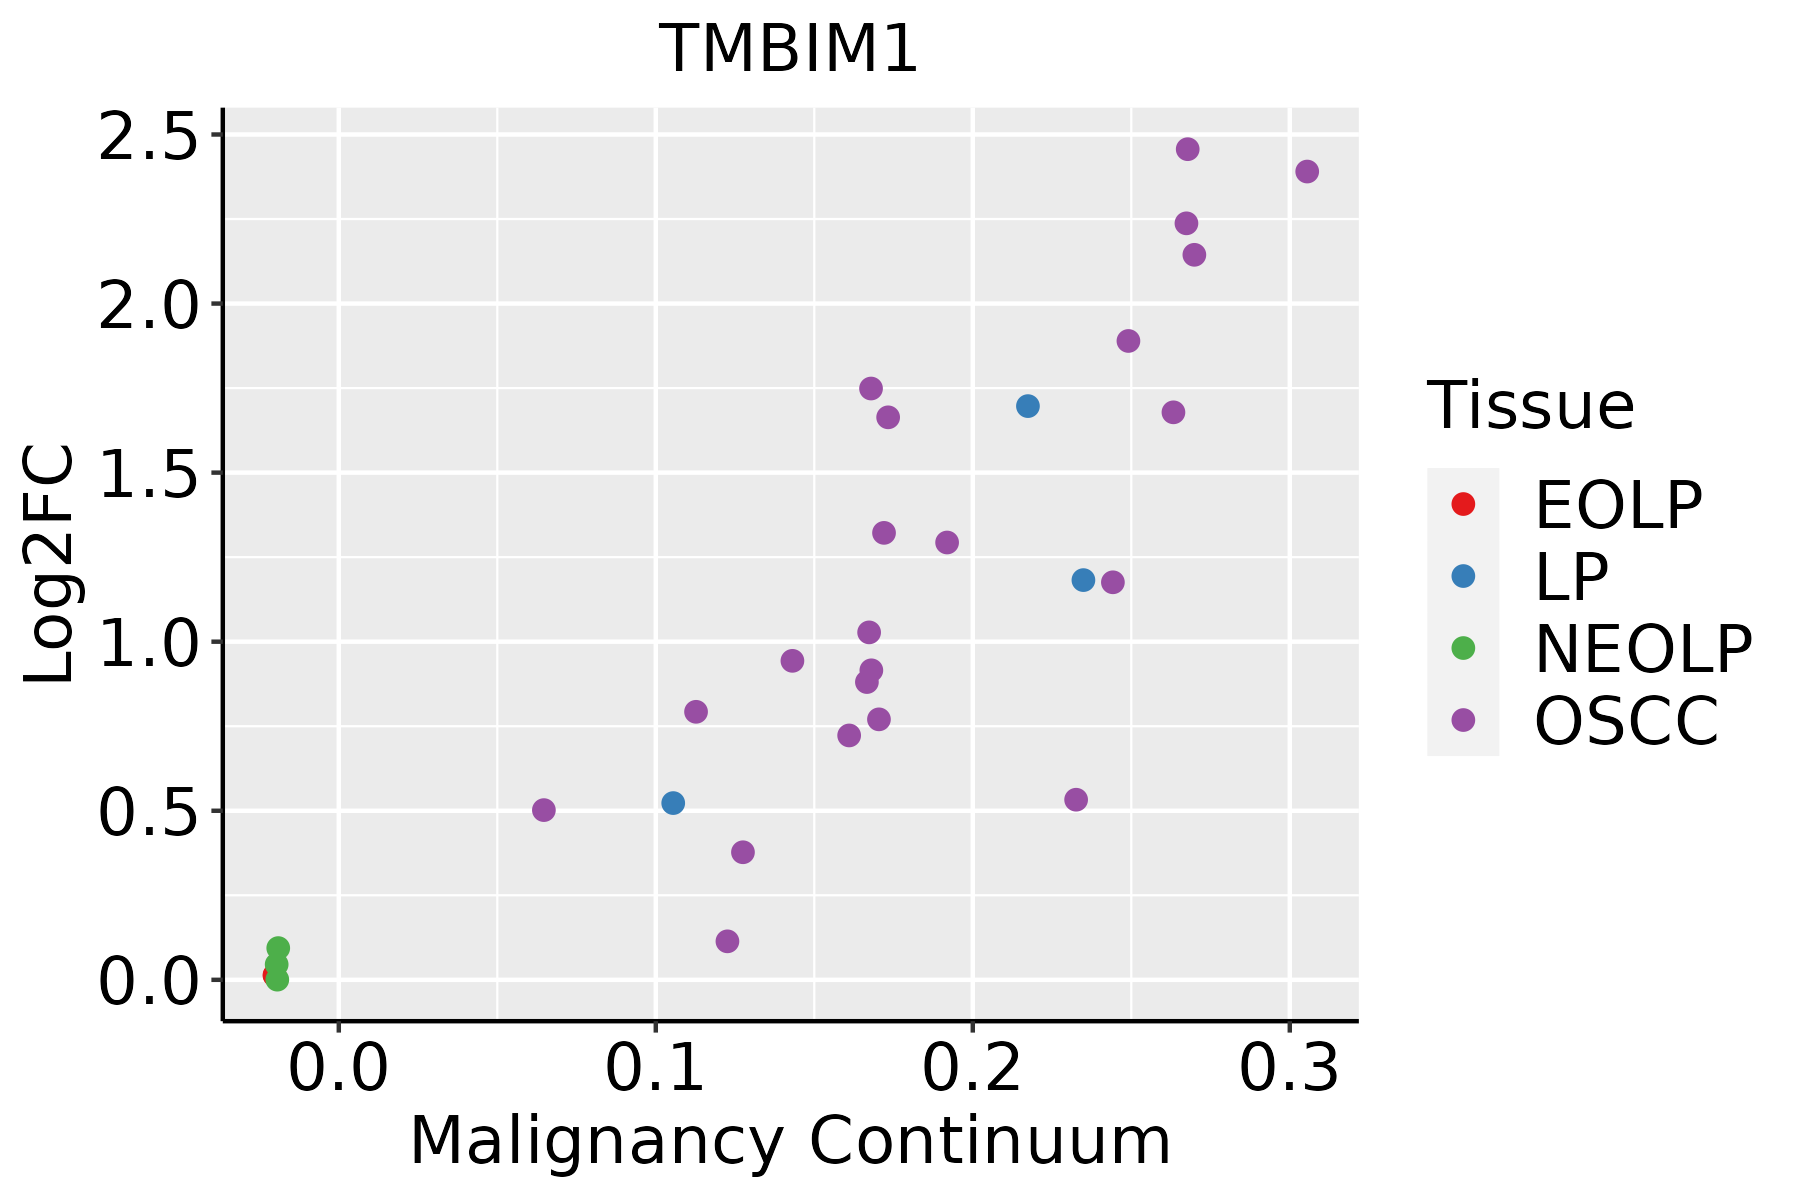 | EOLP: Erosive Oral lichen planus |
| LP: leukoplakia | ||
| NEOLP: Non-erosive oral lichen planus | ||
| OSCC: Oral squamous cell carcinoma | ||
| Skin | 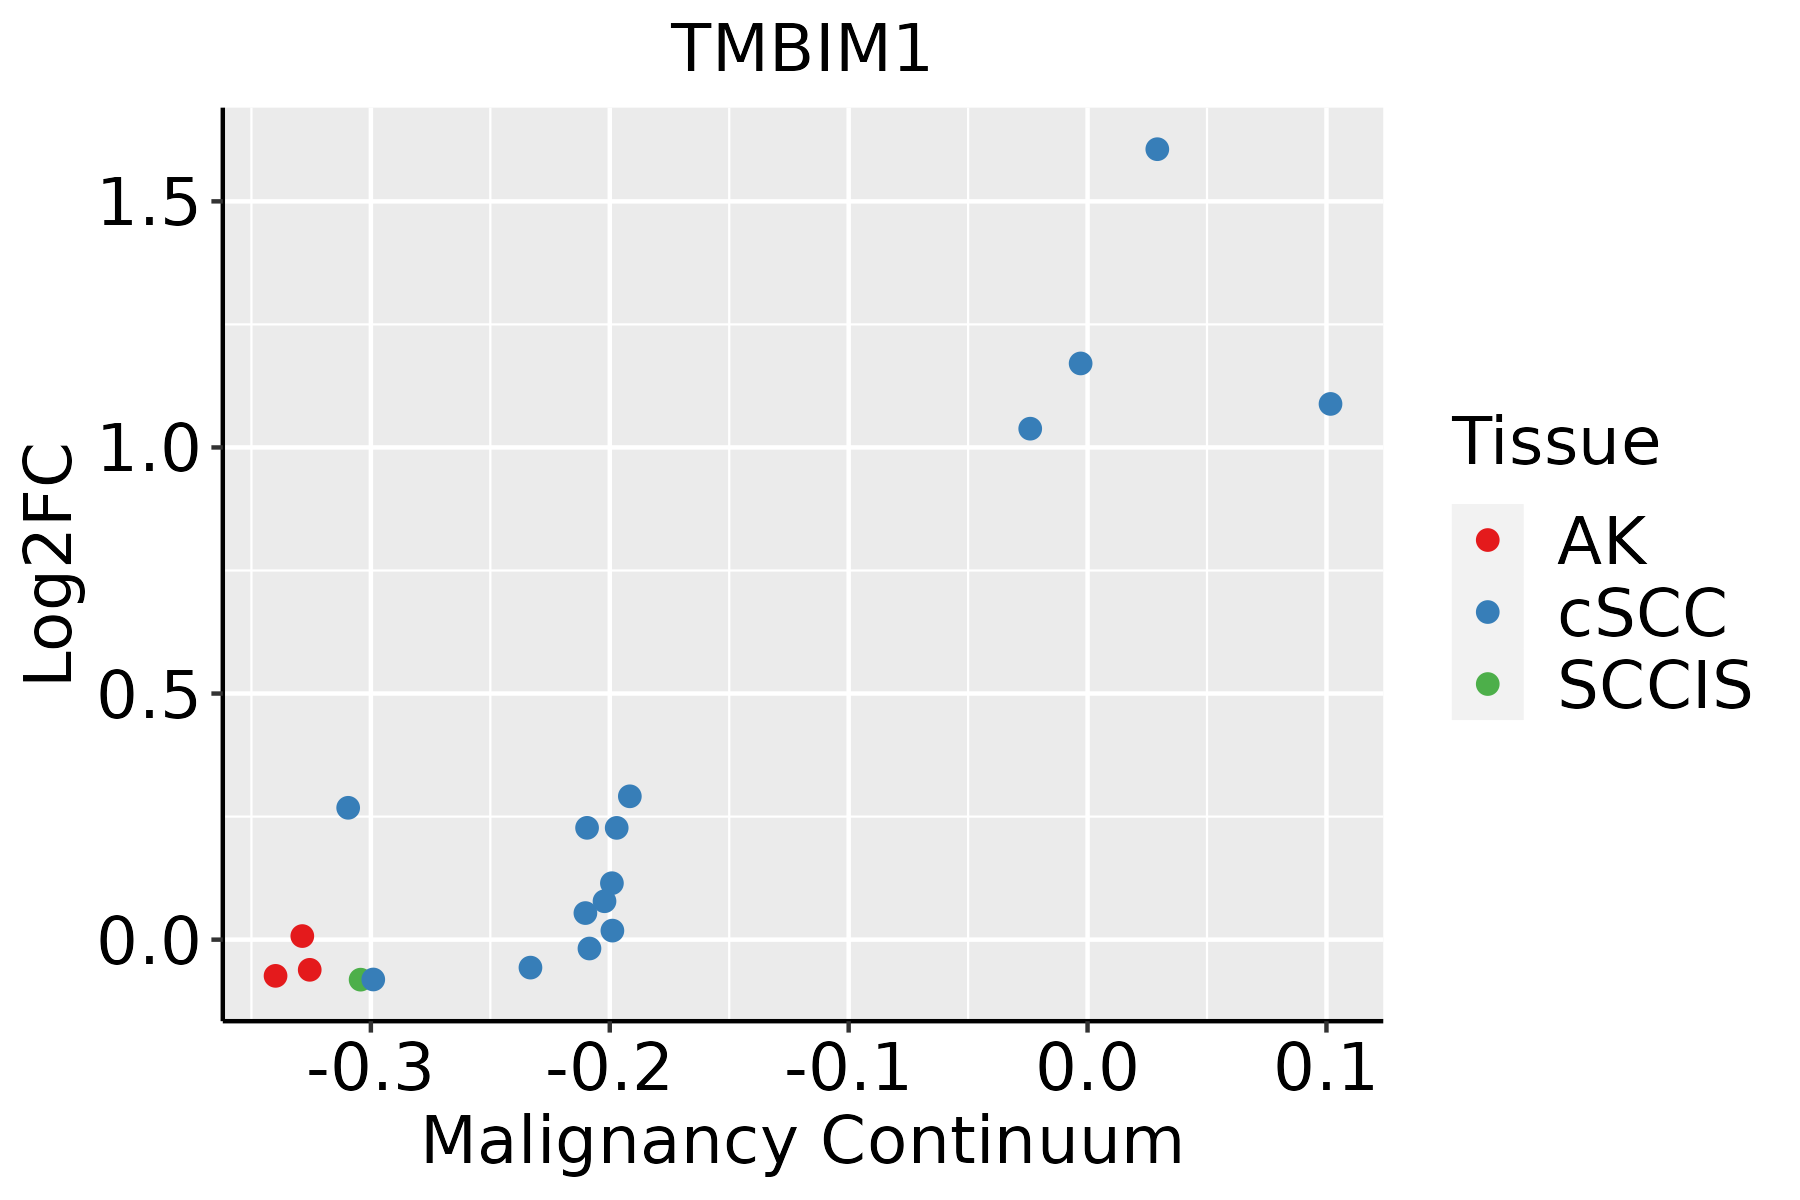 | AK: Actinic keratosis |
| cSCC: Cutaneous squamous cell carcinoma | ||
| SCCIS:squamous cell carcinoma in situ | ||
| Thyroid | 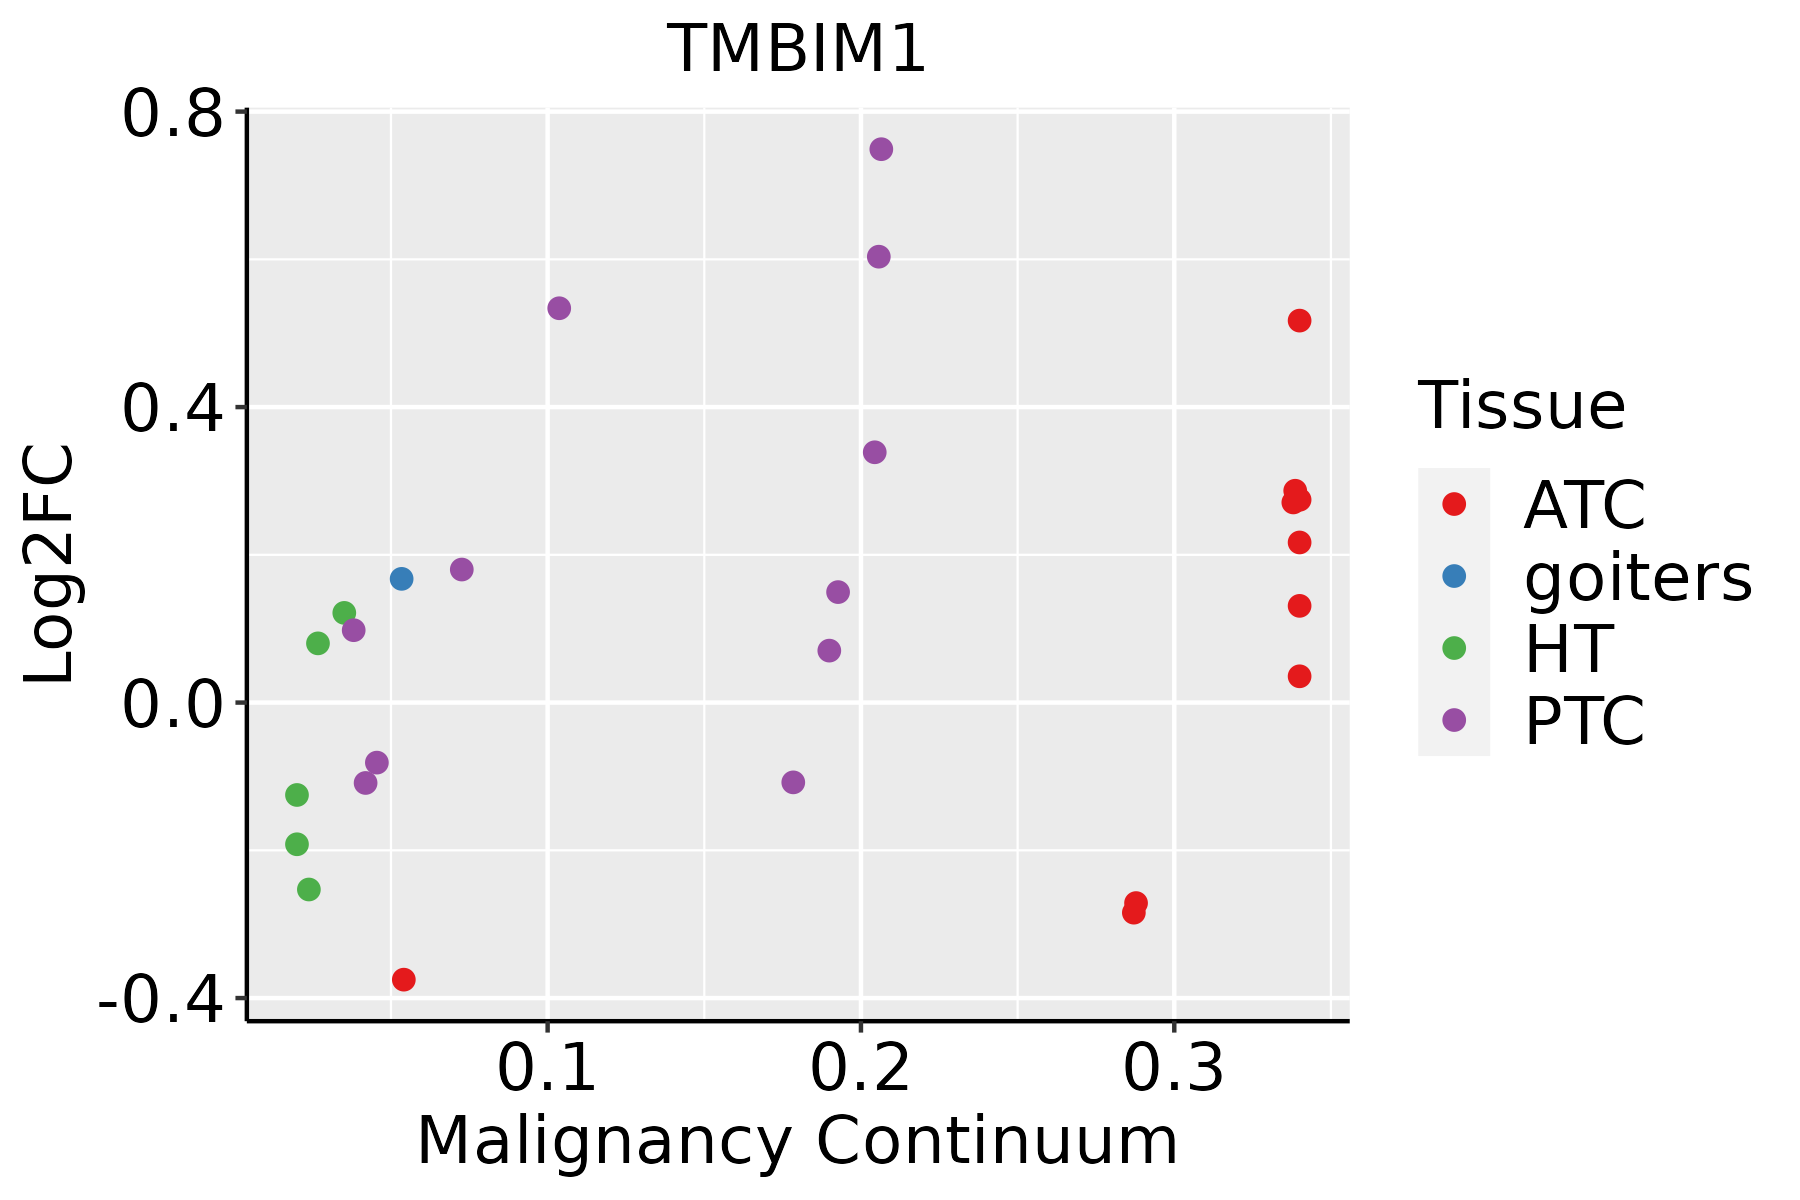 | ATC: Anaplastic thyroid cancer |
| HT: Hashimoto's thyroiditis | ||
| PTC: Papillary thyroid cancer |
| ∗log2FC in expression of this searched gene in stem-like cells from each diseased tissue sample relative to stem-like cells in normal samples in each tissue plotted against the malignancy continuum. Samples are colored based on if they are from different disease stage. |
Top |
Malignant transformation related pathway analysis |
| Find out the enriched GO biological processes and KEGG pathways involved in transition from healthy to precancer to cancer |
| Tissue | Disease Stage | Enriched GO biological Processes |
| Colorectum | AD |  |
| Colorectum | SER |  |
| Colorectum | MSS |  |
| Colorectum | MSI-H |  |
| Colorectum | FAP |  |
| ∗Top 15 enriched GO BP terms are showed in the bar plot of each disease state in each tissue. Each row represents a significant GO biological process which is colored according to the -log10(p.adjust). |
| Page: 1 2 3 4 5 6 7 8 9 |
| GO ID | Tissue | Disease Stage | Description | Gene Ratio | Bg Ratio | pvalue | p.adjust | Count |
| GO:2001237 | Colorectum | SER | negative regulation of extrinsic apoptotic signaling pathway | 27/2897 | 97/18723 | 1.31e-03 | 1.45e-02 | 27 |
| GO:19038281 | Colorectum | SER | negative regulation of cellular protein localization | 30/2897 | 117/18723 | 2.96e-03 | 2.62e-02 | 30 |
| GO:19030771 | Colorectum | SER | negative regulation of protein localization to plasma membrane | 9/2897 | 24/18723 | 7.19e-03 | 4.99e-02 | 9 |
| GO:00726592 | Colorectum | MSS | protein localization to plasma membrane | 113/3467 | 284/18723 | 3.23e-17 | 1.55e-14 | 113 |
| GO:19907782 | Colorectum | MSS | protein localization to cell periphery | 120/3467 | 333/18723 | 2.02e-14 | 5.47e-12 | 120 |
| GO:20012332 | Colorectum | MSS | regulation of apoptotic signaling pathway | 116/3467 | 356/18723 | 1.02e-10 | 1.06e-08 | 116 |
| GO:19054752 | Colorectum | MSS | regulation of protein localization to membrane | 68/3467 | 175/18723 | 2.16e-10 | 2.09e-08 | 68 |
| GO:19030762 | Colorectum | MSS | regulation of protein localization to plasma membrane | 45/3467 | 104/18723 | 4.82e-09 | 3.17e-07 | 45 |
| GO:19043752 | Colorectum | MSS | regulation of protein localization to cell periphery | 51/3467 | 125/18723 | 5.46e-09 | 3.55e-07 | 51 |
| GO:20012342 | Colorectum | MSS | negative regulation of apoptotic signaling pathway | 72/3467 | 224/18723 | 6.17e-07 | 2.29e-05 | 72 |
| GO:19030772 | Colorectum | MSS | negative regulation of protein localization to plasma membrane | 13/3467 | 24/18723 | 9.44e-05 | 1.49e-03 | 13 |
| GO:00971912 | Colorectum | MSS | extrinsic apoptotic signaling pathway | 63/3467 | 219/18723 | 1.34e-04 | 2.03e-03 | 63 |
| GO:19043761 | Colorectum | MSS | negative regulation of protein localization to cell periphery | 13/3467 | 26/18723 | 2.71e-04 | 3.63e-03 | 13 |
| GO:19038282 | Colorectum | MSS | negative regulation of cellular protein localization | 36/3467 | 117/18723 | 9.19e-04 | 9.34e-03 | 36 |
| GO:20012371 | Colorectum | MSS | negative regulation of extrinsic apoptotic signaling pathway | 30/3467 | 97/18723 | 2.15e-03 | 1.80e-02 | 30 |
| GO:1905476 | Colorectum | MSS | negative regulation of protein localization to membrane | 13/3467 | 32/18723 | 3.00e-03 | 2.30e-02 | 13 |
| GO:20012361 | Colorectum | MSS | regulation of extrinsic apoptotic signaling pathway | 42/3467 | 151/18723 | 3.23e-03 | 2.45e-02 | 42 |
| GO:2001233111 | Esophagus | ESCC | regulation of apoptotic signaling pathway | 256/8552 | 356/18723 | 4.11e-24 | 1.04e-21 | 256 |
| GO:0097191111 | Esophagus | ESCC | extrinsic apoptotic signaling pathway | 159/8552 | 219/18723 | 4.12e-16 | 2.94e-14 | 159 |
| GO:2001234111 | Esophagus | ESCC | negative regulation of apoptotic signaling pathway | 161/8552 | 224/18723 | 1.24e-15 | 8.09e-14 | 161 |
| Page: 1 2 3 4 5 6 7 8 9 10 11 |
| Pathway ID | Tissue | Disease Stage | Description | Gene Ratio | Bg Ratio | pvalue | p.adjust | qvalue | Count |
| Page: 1 |
Top |
Cell-cell communication analysis |
| Identification of potential cell-cell interactions between two cell types and their ligand-receptor pairs for different disease states |
| Ligand | Receptor | LRpair | Pathway | Tissue | Disease Stage |
| Page: 1 |
Top |
Single-cell gene regulatory network inference analysis |
| Find out the significant the regulons (TFs) and the target genes of each regulon across cell types for different disease states |
| TF | Cell Type | Tissue | Disease Stage | Target Gene | RSS | Regulon Activity |
| ∗The dot plots of a searched regulon are shown for all cell subpopulations in each disease state of each tissue based on the regulon specific score inferred using pySCENIC and by calculating the average expression. |
| Page: 1 |
Top |
Somatic mutation of malignant transformation related genes |
| Annotation of somatic variants for genes involved in malignant transformation |
| Hugo Symbol | Variant Class | Variant Classification | dbSNP RS | HGVSc | HGVSp | HGVSp Short | SWISSPROT | BIOTYPE | SIFT | PolyPhen | Tumor Sample Barcode | Tissue | Histology | Sex | Age | Stage | Therapy Types | Drugs | Outcome |
| TMBIM1 | SNV | Missense_Mutation | novel | c.792N>A | p.Phe264Leu | p.F264L | Q969X1 | protein_coding | deleterious(0) | probably_damaging(0.994) | TCGA-A2-A25A-01 | Breast | breast invasive carcinoma | Female | <65 | I/II | Unspecific | Cytoxan | SD |
| TMBIM1 | SNV | Missense_Mutation | novel | c.806N>T | p.Thr269Ile | p.T269I | Q969X1 | protein_coding | deleterious(0) | probably_damaging(0.996) | TCGA-AC-A3QQ-01 | Breast | breast invasive carcinoma | Female | <65 | I/II | Unknown | Unknown | SD |
| TMBIM1 | SNV | Missense_Mutation | c.523N>G | p.Met175Val | p.M175V | Q969X1 | protein_coding | deleterious(0) | benign(0.217) | TCGA-EW-A1OZ-01 | Breast | breast invasive carcinoma | Female | <65 | I/II | Targeted Molecular therapy | trastuzumab | SD | |
| TMBIM1 | insertion | Frame_Shift_Ins | novel | c.803_804insTGTGGTGT | p.Thr269ValfsTer41 | p.T269Vfs*41 | Q969X1 | protein_coding | TCGA-AC-A3QQ-01 | Breast | breast invasive carcinoma | Female | <65 | I/II | Unknown | Unknown | SD | ||
| TMBIM1 | deletion | Frame_Shift_Del | novel | c.534delN | p.Met178IlefsTer18 | p.M178Ifs*18 | Q969X1 | protein_coding | TCGA-EW-A2FV-01 | Breast | breast invasive carcinoma | Female | <65 | III/IV | Chemotherapy | docetaxel | SD | ||
| TMBIM1 | SNV | Missense_Mutation | novel | c.260G>C | p.Gly87Ala | p.G87A | Q969X1 | protein_coding | tolerated(0.62) | benign(0.012) | TCGA-EA-A43B-01 | Cervix | cervical & endocervical cancer | Female | <65 | I/II | Chemotherapy | cisplatin | CR |
| TMBIM1 | SNV | Missense_Mutation | rs143173370 | c.929G>A | p.Arg310His | p.R310H | Q969X1 | protein_coding | tolerated(0.06) | benign(0.018) | TCGA-AA-3663-01 | Colorectum | colon adenocarcinoma | Male | <65 | I/II | Unknown | Unknown | SD |
| TMBIM1 | SNV | Missense_Mutation | novel | c.707T>C | p.Val236Ala | p.V236A | Q969X1 | protein_coding | deleterious(0.05) | benign(0.012) | TCGA-AA-A00N-01 | Colorectum | colon adenocarcinoma | Male | >=65 | I/II | Unknown | Unknown | PD |
| TMBIM1 | SNV | Missense_Mutation | c.682A>G | p.Ile228Val | p.I228V | Q969X1 | protein_coding | tolerated(0.38) | benign(0.086) | TCGA-AD-5900-01 | Colorectum | colon adenocarcinoma | Male | >=65 | I/II | Unknown | Unknown | SD | |
| TMBIM1 | SNV | Missense_Mutation | novel | c.767N>C | p.Leu256Pro | p.L256P | Q969X1 | protein_coding | deleterious(0) | probably_damaging(0.969) | TCGA-D5-6928-01 | Colorectum | colon adenocarcinoma | Male | >=65 | I/II | Unknown | Unknown | SD |
| Page: 1 2 3 |
Top |
Related drugs of malignant transformation related genes |
| Identification of chemicals and drugs interact with genes involved in malignant transfromation |
| (DGIdb 4.0) |
| Entrez ID | Symbol | Category | Interaction Types | Drug Claim Name | Drug Name | PMIDs |
| Page: 1 |

Copyright 2023-Present -The University of Texas Health Science Center at Houston |