
|
|||||
|
 | |
| |
| |
| |
| |
| |
|
Gene: TICAM1 |
Gene summary for TICAM1 |
| Gene information | Species | Human | Gene symbol | TICAM1 | Gene ID | 148022 |
| Gene name | toll like receptor adaptor molecule 1 | |
| Gene Alias | IIAE6 | |
| Cytomap | 19p13.3 | |
| Gene Type | protein-coding | GO ID | GO:0001775 | UniProtAcc | Q8IUC6 |
Top |
Malignant transformation analysis |
| Identification of the aberrant gene expression in precancerous and cancerous lesions by comparing the gene expression of stem-like cells in diseased tissues with normal stem cells |
| Entrez ID | Symbol | Replicates | Species | Organ | Tissue | Adj P-value | Log2FC | Malignancy |
| 148022 | TICAM1 | HTA11_2487_2000001011 | Human | Colorectum | SER | 4.50e-07 | 3.84e-01 | -0.1808 |
| 148022 | TICAM1 | HTA11_1938_2000001011 | Human | Colorectum | AD | 3.13e-06 | 4.09e-01 | -0.0811 |
| 148022 | TICAM1 | HTA11_347_2000001011 | Human | Colorectum | AD | 6.56e-03 | 2.11e-01 | -0.1954 |
| 148022 | TICAM1 | HTA11_411_2000001011 | Human | Colorectum | SER | 1.40e-06 | 1.12e+00 | -0.2602 |
| 148022 | TICAM1 | HTA11_2112_2000001011 | Human | Colorectum | SER | 3.73e-02 | 8.10e-01 | -0.2196 |
| 148022 | TICAM1 | HTA11_696_2000001011 | Human | Colorectum | AD | 1.87e-05 | 2.48e-01 | -0.1464 |
| 148022 | TICAM1 | HTA11_1391_2000001011 | Human | Colorectum | AD | 9.98e-11 | 5.02e-01 | -0.059 |
| 148022 | TICAM1 | HTA11_546_2000001011 | Human | Colorectum | AD | 3.12e-03 | 3.03e-01 | -0.0842 |
| 148022 | TICAM1 | HTA11_7696_3000711011 | Human | Colorectum | AD | 3.03e-07 | 3.15e-01 | 0.0674 |
| 148022 | TICAM1 | HTA11_99999971662_82457 | Human | Colorectum | MSS | 1.03e-02 | 2.55e-01 | 0.3859 |
| 148022 | TICAM1 | LZE4T | Human | Esophagus | ESCC | 2.68e-06 | 1.84e-01 | 0.0811 |
| 148022 | TICAM1 | LZE7T | Human | Esophagus | ESCC | 9.65e-07 | 2.50e-01 | 0.0667 |
| 148022 | TICAM1 | LZE8T | Human | Esophagus | ESCC | 5.10e-11 | 3.65e-01 | 0.067 |
| 148022 | TICAM1 | LZE20T | Human | Esophagus | ESCC | 3.64e-06 | 1.89e-01 | 0.0662 |
| 148022 | TICAM1 | LZE22T | Human | Esophagus | ESCC | 3.19e-02 | 5.83e-01 | 0.068 |
| 148022 | TICAM1 | LZE24T | Human | Esophagus | ESCC | 8.32e-34 | 1.13e+00 | 0.0596 |
| 148022 | TICAM1 | LZE21T | Human | Esophagus | ESCC | 2.04e-09 | 6.42e-01 | 0.0655 |
| 148022 | TICAM1 | P1T-E | Human | Esophagus | ESCC | 1.17e-05 | 9.20e-01 | 0.0875 |
| 148022 | TICAM1 | P2T-E | Human | Esophagus | ESCC | 5.11e-07 | 9.30e-02 | 0.1177 |
| 148022 | TICAM1 | P4T-E | Human | Esophagus | ESCC | 2.89e-11 | 2.70e-01 | 0.1323 |
| Page: 1 2 3 4 5 |
| Tissue | Expression Dynamics | Abbreviation |
| Colorectum (GSE201348) |  | FAP: Familial adenomatous polyposis |
| CRC: Colorectal cancer | ||
| Colorectum (HTA11) |  | AD: Adenomas |
| SER: Sessile serrated lesions | ||
| MSI-H: Microsatellite-high colorectal cancer | ||
| MSS: Microsatellite stable colorectal cancer | ||
| Esophagus | 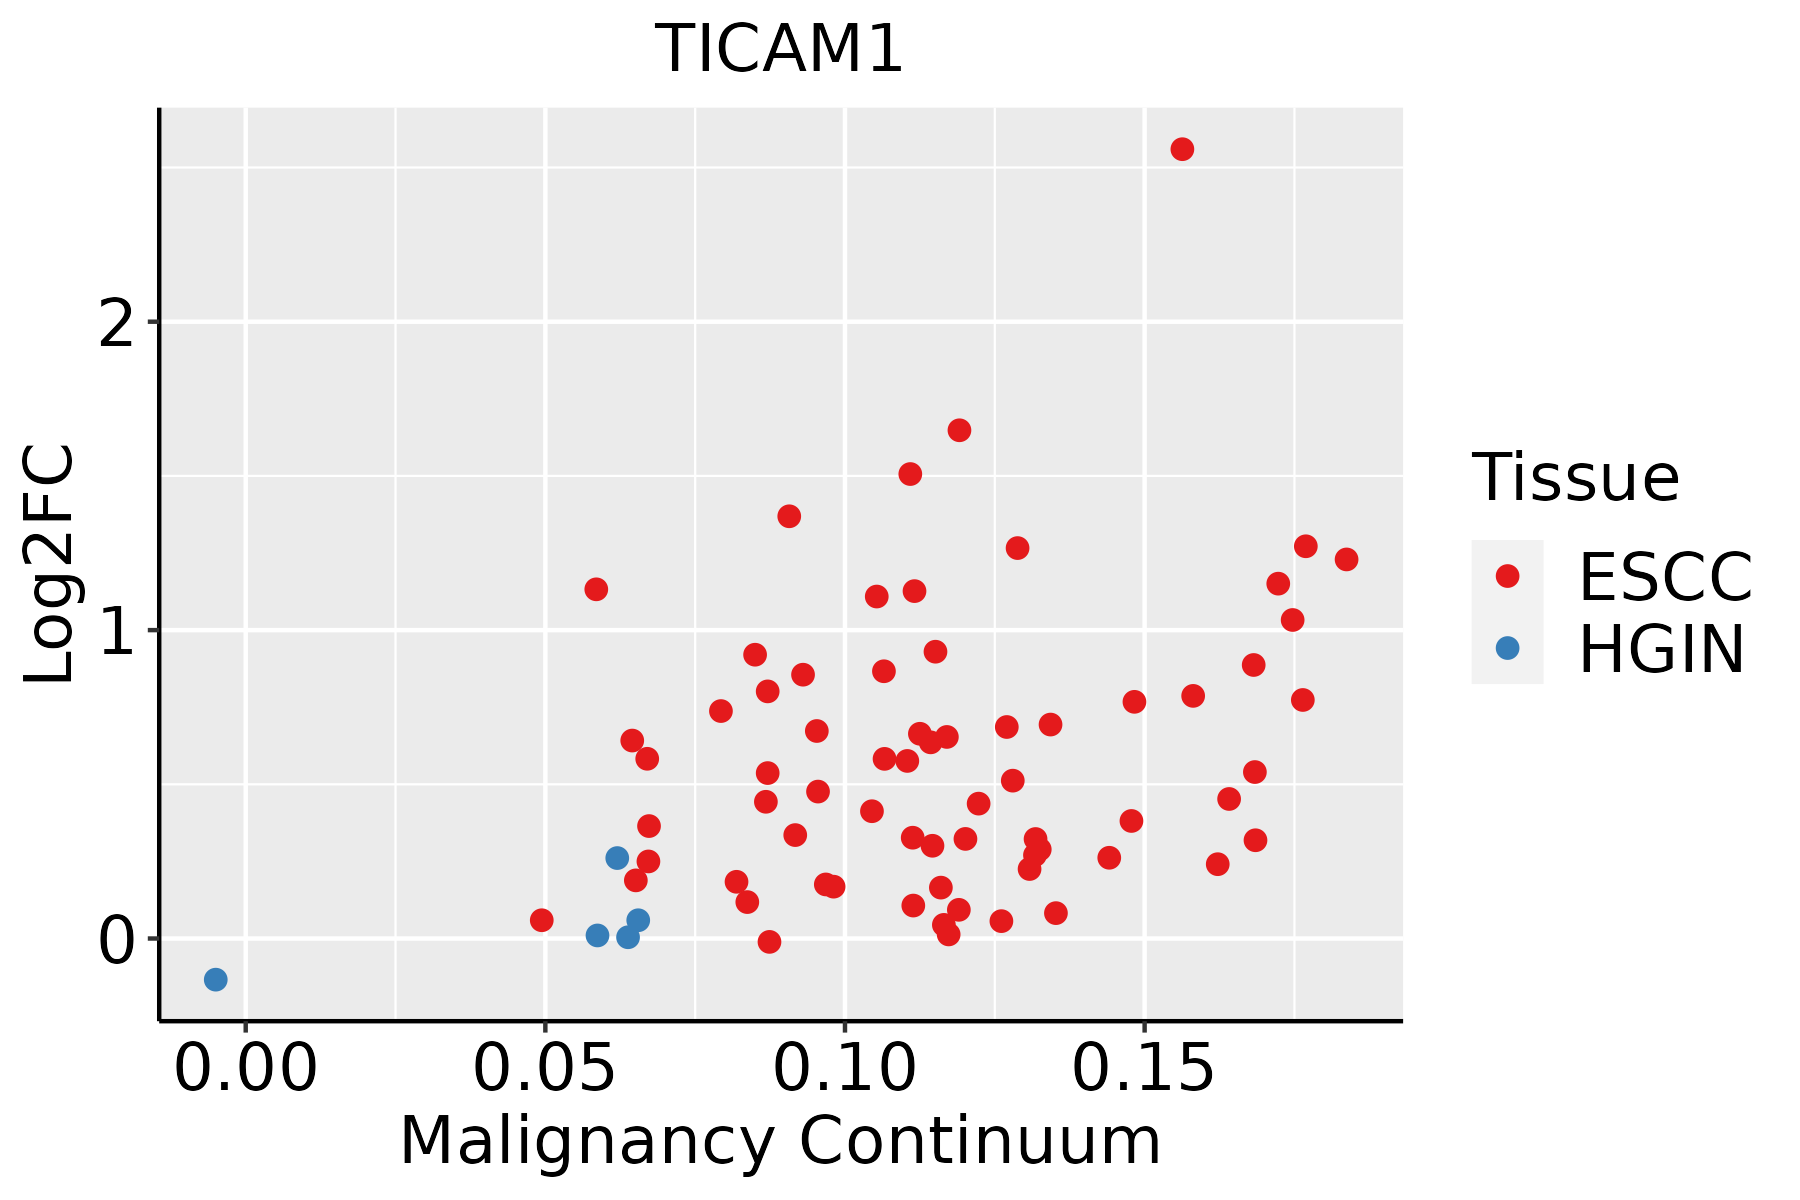 | ESCC: Esophageal squamous cell carcinoma |
| HGIN: High-grade intraepithelial neoplasias | ||
| LGIN: Low-grade intraepithelial neoplasias | ||
| Liver |  | HCC: Hepatocellular carcinoma |
| NAFLD: Non-alcoholic fatty liver disease | ||
| Oral Cavity |  | EOLP: Erosive Oral lichen planus |
| LP: leukoplakia | ||
| NEOLP: Non-erosive oral lichen planus | ||
| OSCC: Oral squamous cell carcinoma |
| ∗log2FC in expression of this searched gene in stem-like cells from each diseased tissue sample relative to stem-like cells in normal samples in each tissue plotted against the malignancy continuum. Samples are colored based on if they are from different disease stage. |
Top |
Malignant transformation related pathway analysis |
| Find out the enriched GO biological processes and KEGG pathways involved in transition from healthy to precancer to cancer |
| Tissue | Disease Stage | Enriched GO biological Processes |
| Colorectum | AD |  |
| Colorectum | SER |  |
| Colorectum | MSS |  |
| Colorectum | MSI-H |  |
| Colorectum | FAP |  |
| ∗Top 15 enriched GO BP terms are showed in the bar plot of each disease state in each tissue. Each row represents a significant GO biological process which is colored according to the -log10(p.adjust). |
| Page: 1 2 3 4 5 6 7 8 9 |
| GO ID | Tissue | Disease Stage | Description | Gene Ratio | Bg Ratio | pvalue | p.adjust | Count |
| GO:0051091 | Colorectum | AD | positive regulation of DNA-binding transcription factor activity | 73/3918 | 260/18723 | 3.52e-03 | 2.54e-02 | 73 |
| GO:0080164 | Colorectum | AD | regulation of nitric oxide metabolic process | 23/3918 | 64/18723 | 3.99e-03 | 2.80e-02 | 23 |
| GO:0045428 | Colorectum | AD | regulation of nitric oxide biosynthetic process | 22/3918 | 62/18723 | 5.72e-03 | 3.64e-02 | 22 |
| GO:00432541 | Colorectum | SER | regulation of protein-containing complex assembly | 119/2897 | 428/18723 | 3.34e-11 | 5.86e-09 | 119 |
| GO:00098961 | Colorectum | SER | positive regulation of catabolic process | 132/2897 | 492/18723 | 4.16e-11 | 6.72e-09 | 132 |
| GO:00313311 | Colorectum | SER | positive regulation of cellular catabolic process | 114/2897 | 427/18723 | 1.22e-09 | 1.27e-07 | 114 |
| GO:00510981 | Colorectum | SER | regulation of binding | 97/2897 | 363/18723 | 1.98e-08 | 1.43e-06 | 97 |
| GO:19033201 | Colorectum | SER | regulation of protein modification by small protein conjugation or removal | 70/2897 | 242/18723 | 6.84e-08 | 4.42e-06 | 70 |
| GO:00313961 | Colorectum | SER | regulation of protein ubiquitination | 62/2897 | 210/18723 | 1.69e-07 | 9.71e-06 | 62 |
| GO:00433931 | Colorectum | SER | regulation of protein binding | 54/2897 | 196/18723 | 1.00e-05 | 3.31e-04 | 54 |
| GO:00068091 | Colorectum | SER | nitric oxide biosynthetic process | 27/2897 | 76/18723 | 1.38e-05 | 4.28e-04 | 27 |
| GO:00462091 | Colorectum | SER | nitric oxide metabolic process | 28/2897 | 81/18723 | 1.73e-05 | 5.15e-04 | 28 |
| GO:20010571 | Colorectum | SER | reactive nitrogen species metabolic process | 28/2897 | 82/18723 | 2.24e-05 | 6.43e-04 | 28 |
| GO:00510991 | Colorectum | SER | positive regulation of binding | 46/2897 | 173/18723 | 1.12e-04 | 2.34e-03 | 46 |
| GO:00105061 | Colorectum | SER | regulation of autophagy | 74/2897 | 317/18723 | 1.39e-04 | 2.77e-03 | 74 |
| GO:00801641 | Colorectum | SER | regulation of nitric oxide metabolic process | 21/2897 | 64/18723 | 4.26e-04 | 6.26e-03 | 21 |
| GO:00454291 | Colorectum | SER | positive regulation of nitric oxide biosynthetic process | 15/2897 | 40/18723 | 5.71e-04 | 7.86e-03 | 15 |
| GO:00454281 | Colorectum | SER | regulation of nitric oxide biosynthetic process | 20/2897 | 62/18723 | 7.41e-04 | 9.64e-03 | 20 |
| GO:19044071 | Colorectum | SER | positive regulation of nitric oxide metabolic process | 15/2897 | 41/18723 | 7.73e-04 | 9.84e-03 | 15 |
| GO:1903322 | Colorectum | SER | positive regulation of protein modification by small protein conjugation or removal | 34/2897 | 138/18723 | 3.30e-03 | 2.83e-02 | 34 |
| Page: 1 2 3 4 5 6 7 8 9 10 11 |
| Pathway ID | Tissue | Disease Stage | Description | Gene Ratio | Bg Ratio | pvalue | p.adjust | qvalue | Count |
| hsa05135 | Colorectum | AD | Yersinia infection | 58/2092 | 137/8465 | 3.90e-06 | 4.35e-05 | 2.78e-05 | 58 |
| hsa05417 | Colorectum | AD | Lipid and atherosclerosis | 73/2092 | 215/8465 | 1.31e-03 | 8.27e-03 | 5.27e-03 | 73 |
| hsa05160 | Colorectum | AD | Hepatitis C | 54/2092 | 157/8465 | 3.87e-03 | 1.96e-02 | 1.25e-02 | 54 |
| hsa051351 | Colorectum | AD | Yersinia infection | 58/2092 | 137/8465 | 3.90e-06 | 4.35e-05 | 2.78e-05 | 58 |
| hsa054171 | Colorectum | AD | Lipid and atherosclerosis | 73/2092 | 215/8465 | 1.31e-03 | 8.27e-03 | 5.27e-03 | 73 |
| hsa051601 | Colorectum | AD | Hepatitis C | 54/2092 | 157/8465 | 3.87e-03 | 1.96e-02 | 1.25e-02 | 54 |
| hsa051352 | Colorectum | SER | Yersinia infection | 43/1580 | 137/8465 | 2.15e-04 | 2.10e-03 | 1.52e-03 | 43 |
| hsa04217 | Colorectum | SER | Necroptosis | 47/1580 | 159/8465 | 5.21e-04 | 4.44e-03 | 3.22e-03 | 47 |
| hsa054172 | Colorectum | SER | Lipid and atherosclerosis | 55/1580 | 215/8465 | 6.83e-03 | 3.77e-02 | 2.74e-02 | 55 |
| hsa051353 | Colorectum | SER | Yersinia infection | 43/1580 | 137/8465 | 2.15e-04 | 2.10e-03 | 1.52e-03 | 43 |
| hsa042171 | Colorectum | SER | Necroptosis | 47/1580 | 159/8465 | 5.21e-04 | 4.44e-03 | 3.22e-03 | 47 |
| hsa054173 | Colorectum | SER | Lipid and atherosclerosis | 55/1580 | 215/8465 | 6.83e-03 | 3.77e-02 | 2.74e-02 | 55 |
| hsa051354 | Colorectum | MSS | Yersinia infection | 53/1875 | 137/8465 | 7.73e-06 | 8.93e-05 | 5.47e-05 | 53 |
| hsa054174 | Colorectum | MSS | Lipid and atherosclerosis | 70/1875 | 215/8465 | 2.38e-04 | 1.81e-03 | 1.11e-03 | 70 |
| hsa051602 | Colorectum | MSS | Hepatitis C | 52/1875 | 157/8465 | 9.29e-04 | 5.58e-03 | 3.42e-03 | 52 |
| hsa05167 | Colorectum | MSS | Kaposi sarcoma-associated herpesvirus infection | 60/1875 | 194/8465 | 2.59e-03 | 1.27e-02 | 7.81e-03 | 60 |
| hsa05161 | Colorectum | MSS | Hepatitis B | 48/1875 | 162/8465 | 1.53e-02 | 4.93e-02 | 3.02e-02 | 48 |
| hsa051355 | Colorectum | MSS | Yersinia infection | 53/1875 | 137/8465 | 7.73e-06 | 8.93e-05 | 5.47e-05 | 53 |
| hsa054175 | Colorectum | MSS | Lipid and atherosclerosis | 70/1875 | 215/8465 | 2.38e-04 | 1.81e-03 | 1.11e-03 | 70 |
| hsa051603 | Colorectum | MSS | Hepatitis C | 52/1875 | 157/8465 | 9.29e-04 | 5.58e-03 | 3.42e-03 | 52 |
| Page: 1 2 3 4 5 6 |
Top |
Cell-cell communication analysis |
| Identification of potential cell-cell interactions between two cell types and their ligand-receptor pairs for different disease states |
| Ligand | Receptor | LRpair | Pathway | Tissue | Disease Stage |
| Page: 1 |
Top |
Single-cell gene regulatory network inference analysis |
| Find out the significant the regulons (TFs) and the target genes of each regulon across cell types for different disease states |
| TF | Cell Type | Tissue | Disease Stage | Target Gene | RSS | Regulon Activity |
| ∗The dot plots of a searched regulon are shown for all cell subpopulations in each disease state of each tissue based on the regulon specific score inferred using pySCENIC and by calculating the average expression. |
| Page: 1 |
Top |
Somatic mutation of malignant transformation related genes |
| Annotation of somatic variants for genes involved in malignant transformation |
| Hugo Symbol | Variant Class | Variant Classification | dbSNP RS | HGVSc | HGVSp | HGVSp Short | SWISSPROT | BIOTYPE | SIFT | PolyPhen | Tumor Sample Barcode | Tissue | Histology | Sex | Age | Stage | Therapy Types | Drugs | Outcome |
| TICAM1 | SNV | Missense_Mutation | c.1231N>T | p.Arg411Trp | p.R411W | Q8IUC6 | protein_coding | deleterious(0) | probably_damaging(0.995) | TCGA-A2-A0EQ-01 | Breast | breast invasive carcinoma | Female | <65 | I/II | Chemotherapy | adriamycin | SD | |
| TICAM1 | SNV | Missense_Mutation | c.1381N>C | p.Asp461His | p.D461H | Q8IUC6 | protein_coding | deleterious(0.01) | possibly_damaging(0.686) | TCGA-A8-A09G-01 | Breast | breast invasive carcinoma | Female | >=65 | III/IV | Unknown | Unknown | SD | |
| TICAM1 | SNV | Missense_Mutation | novel | c.868N>C | p.Thr290Pro | p.T290P | Q8IUC6 | protein_coding | tolerated(1) | benign(0) | TCGA-AR-A255-01 | Breast | breast invasive carcinoma | Female | <65 | I/II | Targeted Molecular therapy | trastuzumab | SD |
| TICAM1 | deletion | Frame_Shift_Del | novel | c.183_190delAGAGGCAT | p.Ala63GlyfsTer40 | p.A63Gfs*40 | Q8IUC6 | protein_coding | TCGA-AR-A2LR-01 | Breast | breast invasive carcinoma | Female | <65 | I/II | Chemotherapy | adriamycin | SD | ||
| TICAM1 | insertion | Frame_Shift_Ins | rs762126373 | c.1925_1926insC | p.Pro643ThrfsTer123 | p.P643Tfs*123 | Q8IUC6 | protein_coding | TCGA-BH-A0HF-01 | Breast | breast invasive carcinoma | Female | >=65 | I/II | Hormone Therapy | arimidex | SD | ||
| TICAM1 | deletion | Frame_Shift_Del | novel | c.455delN | p.Pro152GlnfsTer102 | p.P152Qfs*102 | Q8IUC6 | protein_coding | TCGA-D8-A27V-01 | Breast | breast invasive carcinoma | Female | <65 | I/II | Hormone Therapy | tamoxiphen | SD | ||
| TICAM1 | SNV | Missense_Mutation | novel | c.892N>G | p.Thr298Ala | p.T298A | Q8IUC6 | protein_coding | tolerated(0.53) | benign(0.006) | TCGA-2W-A8YY-01 | Cervix | cervical & endocervical cancer | Female | <65 | I/II | Chemotherapy | cisplatin | CR |
| TICAM1 | SNV | Missense_Mutation | rs757840131 | c.2008C>A | p.Pro670Thr | p.P670T | Q8IUC6 | protein_coding | tolerated(0.41) | benign(0.01) | TCGA-EA-A5ZF-01 | Cervix | cervical & endocervical cancer | Female | <65 | I/II | Unknown | Unknown | PD |
| TICAM1 | SNV | Missense_Mutation | rs780257437 | c.484C>G | p.Leu162Val | p.L162V | Q8IUC6 | protein_coding | tolerated(0.36) | benign(0.006) | TCGA-EK-A3GK-01 | Cervix | cervical & endocervical cancer | Female | <65 | I/II | Unknown | Unknown | SD |
| TICAM1 | SNV | Missense_Mutation | c.192G>C | p.Leu64Phe | p.L64F | Q8IUC6 | protein_coding | deleterious(0.01) | probably_damaging(0.999) | TCGA-JW-A5VL-01 | Cervix | cervical & endocervical cancer | Female | <65 | I/II | Unknown | Unknown | SD |
| Page: 1 2 3 4 5 6 7 8 9 10 |
Top |
Related drugs of malignant transformation related genes |
| Identification of chemicals and drugs interact with genes involved in malignant transfromation |
| (DGIdb 4.0) |
| Entrez ID | Symbol | Category | Interaction Types | Drug Claim Name | Drug Name | PMIDs |
| 148022 | TICAM1 | TRANSCRIPTION FACTOR | VACCINE | 18217948 |
| Page: 1 |

Copyright 2023-Present -The University of Texas Health Science Center at Houston |