
|
|||||
|
 | |
| |
| |
| |
| |
| |
|
Gene: TGFB1I1 |
Gene summary for TGFB1I1 |
| Gene information | Species | Human | Gene symbol | TGFB1I1 | Gene ID | 7041 |
| Gene name | transforming growth factor beta 1 induced transcript 1 | |
| Gene Alias | ARA55 | |
| Cytomap | 16p11.2 | |
| Gene Type | protein-coding | GO ID | GO:0001837 | UniProtAcc | O43294 |
Top |
Malignant transformation analysis |
| Identification of the aberrant gene expression in precancerous and cancerous lesions by comparing the gene expression of stem-like cells in diseased tissues with normal stem cells |
| Entrez ID | Symbol | Replicates | Species | Organ | Tissue | Adj P-value | Log2FC | Malignancy |
| 7041 | TGFB1I1 | LZE4T | Human | Esophagus | ESCC | 1.54e-06 | 1.41e-01 | 0.0811 |
| 7041 | TGFB1I1 | LZE8T | Human | Esophagus | ESCC | 2.91e-02 | 6.81e-02 | 0.067 |
| 7041 | TGFB1I1 | LZE24T | Human | Esophagus | ESCC | 2.84e-02 | 5.01e-02 | 0.0596 |
| 7041 | TGFB1I1 | P2T-E | Human | Esophagus | ESCC | 1.57e-21 | 3.97e-01 | 0.1177 |
| 7041 | TGFB1I1 | P4T-E | Human | Esophagus | ESCC | 1.50e-17 | 7.04e-01 | 0.1323 |
| 7041 | TGFB1I1 | P5T-E | Human | Esophagus | ESCC | 5.36e-21 | 5.33e-01 | 0.1327 |
| 7041 | TGFB1I1 | P8T-E | Human | Esophagus | ESCC | 1.81e-18 | 4.03e-01 | 0.0889 |
| 7041 | TGFB1I1 | P9T-E | Human | Esophagus | ESCC | 2.87e-07 | 4.27e-01 | 0.1131 |
| 7041 | TGFB1I1 | P10T-E | Human | Esophagus | ESCC | 1.81e-18 | 4.65e-01 | 0.116 |
| 7041 | TGFB1I1 | P11T-E | Human | Esophagus | ESCC | 6.81e-18 | 1.03e+00 | 0.1426 |
| 7041 | TGFB1I1 | P12T-E | Human | Esophagus | ESCC | 1.20e-51 | 1.01e+00 | 0.1122 |
| 7041 | TGFB1I1 | P16T-E | Human | Esophagus | ESCC | 6.37e-46 | 8.82e-01 | 0.1153 |
| 7041 | TGFB1I1 | P17T-E | Human | Esophagus | ESCC | 9.24e-03 | 5.80e-01 | 0.1278 |
| 7041 | TGFB1I1 | P19T-E | Human | Esophagus | ESCC | 7.92e-10 | 1.66e+00 | 0.1662 |
| 7041 | TGFB1I1 | P21T-E | Human | Esophagus | ESCC | 9.66e-37 | 8.31e-01 | 0.1617 |
| 7041 | TGFB1I1 | P22T-E | Human | Esophagus | ESCC | 8.08e-28 | 5.33e-01 | 0.1236 |
| 7041 | TGFB1I1 | P23T-E | Human | Esophagus | ESCC | 3.20e-09 | 5.02e-01 | 0.108 |
| 7041 | TGFB1I1 | P24T-E | Human | Esophagus | ESCC | 3.28e-32 | 7.92e-01 | 0.1287 |
| 7041 | TGFB1I1 | P26T-E | Human | Esophagus | ESCC | 2.21e-21 | 4.44e-01 | 0.1276 |
| 7041 | TGFB1I1 | P27T-E | Human | Esophagus | ESCC | 6.99e-03 | 1.46e-01 | 0.1055 |
| Page: 1 2 3 4 |
| Tissue | Expression Dynamics | Abbreviation |
| Esophagus | 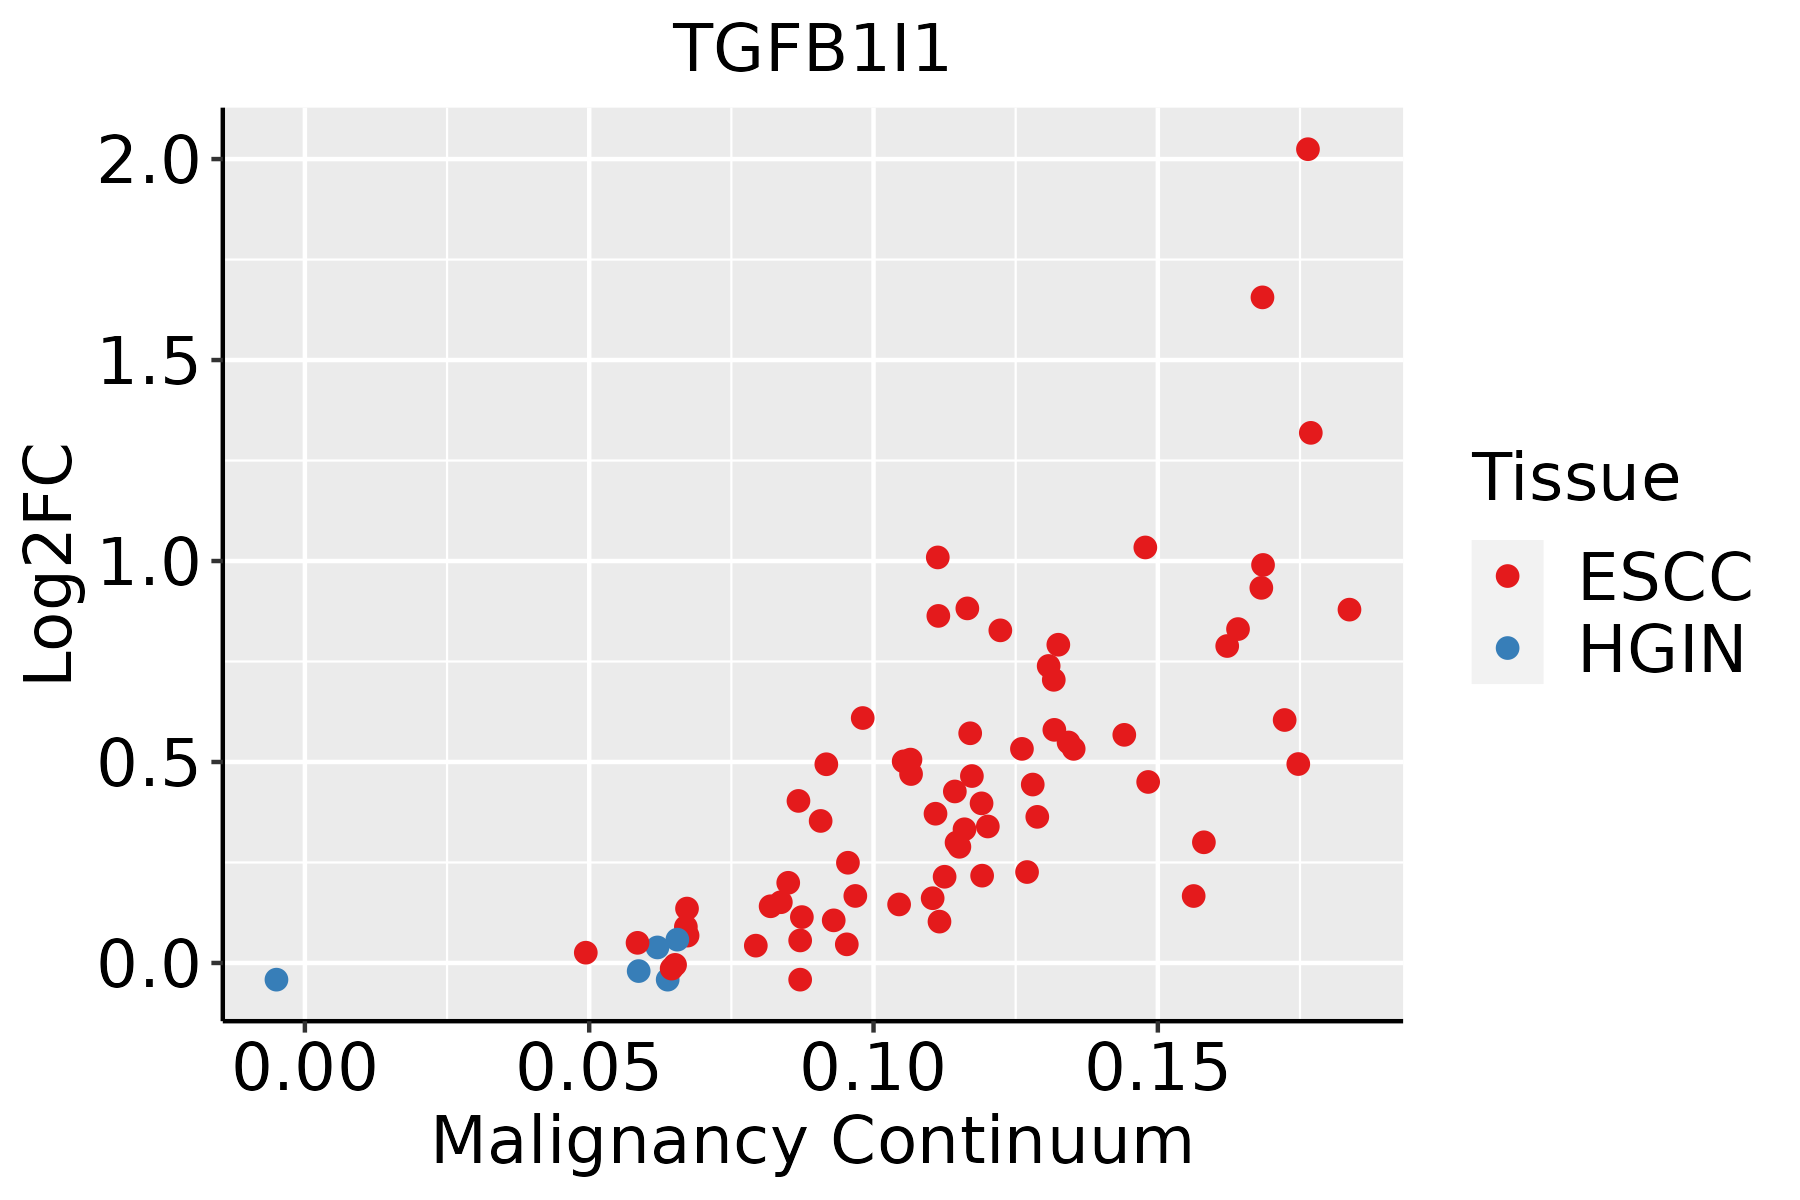 | ESCC: Esophageal squamous cell carcinoma |
| HGIN: High-grade intraepithelial neoplasias | ||
| LGIN: Low-grade intraepithelial neoplasias | ||
| Oral Cavity | 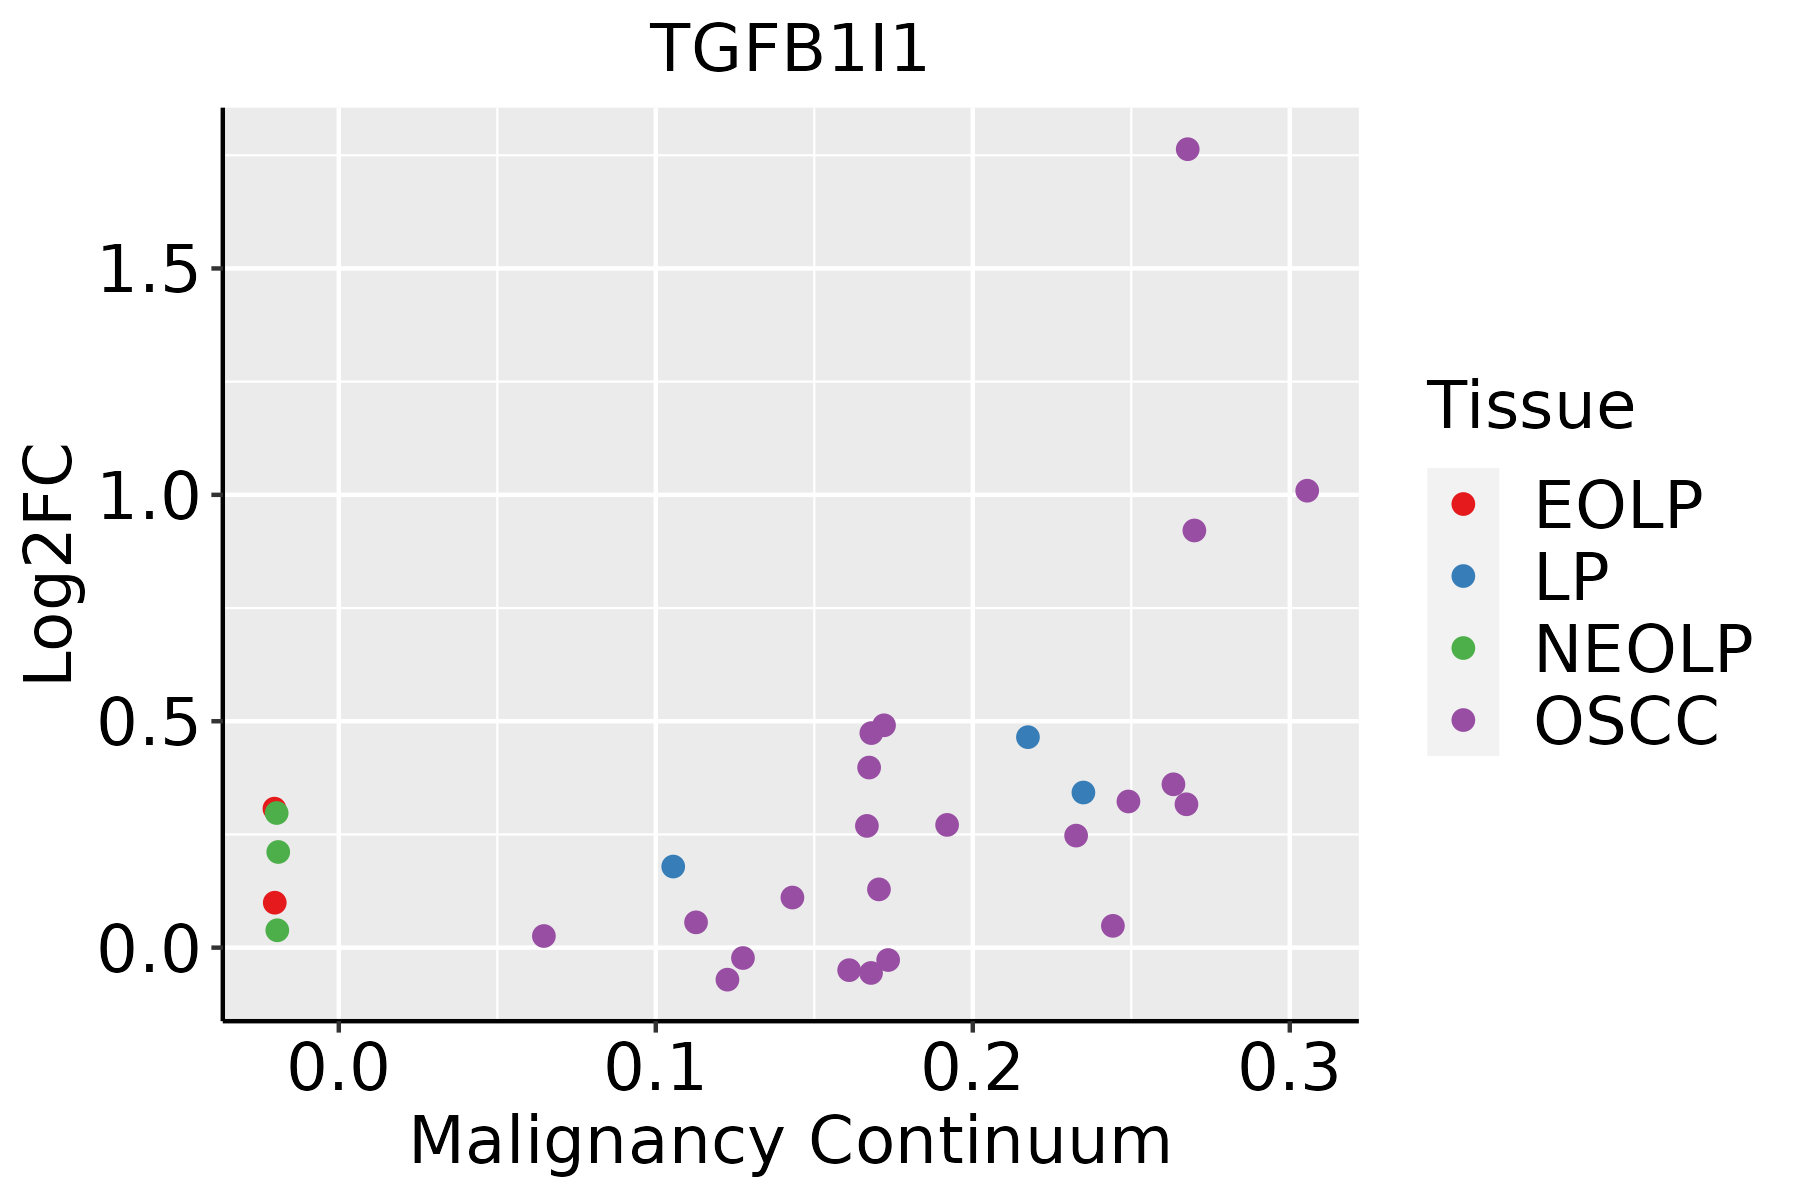 | EOLP: Erosive Oral lichen planus |
| LP: leukoplakia | ||
| NEOLP: Non-erosive oral lichen planus | ||
| OSCC: Oral squamous cell carcinoma | ||
| Thyroid | 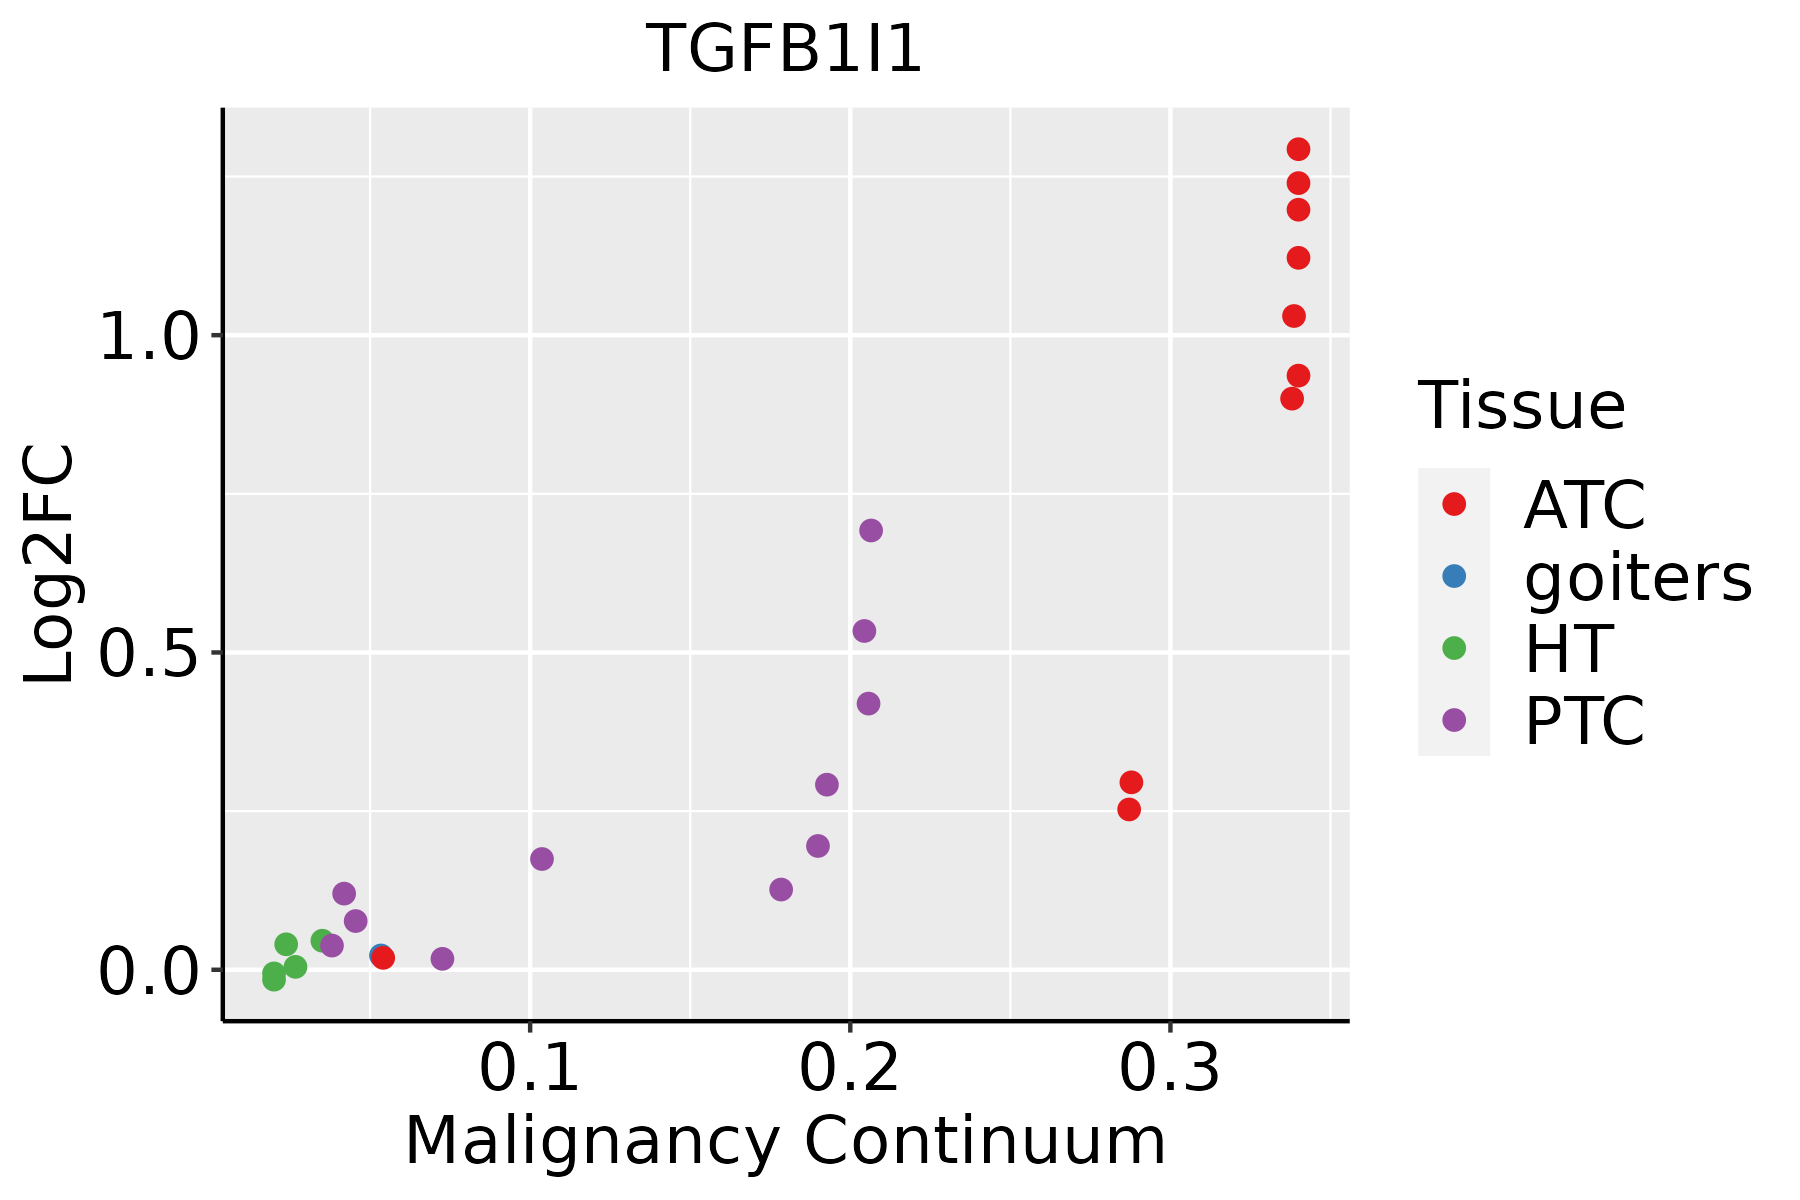 | ATC: Anaplastic thyroid cancer |
| HT: Hashimoto's thyroiditis | ||
| PTC: Papillary thyroid cancer |
| ∗log2FC in expression of this searched gene in stem-like cells from each diseased tissue sample relative to stem-like cells in normal samples in each tissue plotted against the malignancy continuum. Samples are colored based on if they are from different disease stage. |
Top |
Malignant transformation related pathway analysis |
| Find out the enriched GO biological processes and KEGG pathways involved in transition from healthy to precancer to cancer |
| Tissue | Disease Stage | Enriched GO biological Processes |
| Colorectum | AD |  |
| Colorectum | SER |  |
| Colorectum | MSS |  |
| Colorectum | MSI-H |  |
| Colorectum | FAP |  |
| ∗Top 15 enriched GO BP terms are showed in the bar plot of each disease state in each tissue. Each row represents a significant GO biological process which is colored according to the -log10(p.adjust). |
| Page: 1 2 3 4 5 6 7 8 9 |
| GO ID | Tissue | Disease Stage | Description | Gene Ratio | Bg Ratio | pvalue | p.adjust | Count |
| GO:000940817 | Oral cavity | OSCC | response to heat | 73/7305 | 110/18723 | 5.56e-09 | 1.21e-07 | 73 |
| GO:001605510 | Oral cavity | OSCC | Wnt signaling pathway | 227/7305 | 444/18723 | 1.10e-07 | 1.87e-06 | 227 |
| GO:019873810 | Oral cavity | OSCC | cell-cell signaling by wnt | 227/7305 | 446/18723 | 1.75e-07 | 2.86e-06 | 227 |
| GO:00715598 | Oral cavity | OSCC | response to transforming growth factor beta | 140/7305 | 256/18723 | 2.34e-07 | 3.70e-06 | 140 |
| GO:00715608 | Oral cavity | OSCC | cellular response to transforming growth factor beta stimulus | 137/7305 | 250/18723 | 2.68e-07 | 4.15e-06 | 137 |
| GO:00071798 | Oral cavity | OSCC | transforming growth factor beta receptor signaling pathway | 109/7305 | 198/18723 | 3.21e-06 | 3.86e-05 | 109 |
| GO:000926616 | Oral cavity | OSCC | response to temperature stimulus | 98/7305 | 178/18723 | 9.78e-06 | 1.03e-04 | 98 |
| GO:00454448 | Oral cavity | OSCC | fat cell differentiation | 120/7305 | 229/18723 | 2.48e-05 | 2.32e-04 | 120 |
| GO:00107183 | Oral cavity | OSCC | positive regulation of epithelial to mesenchymal transition | 35/7305 | 52/18723 | 3.34e-05 | 3.00e-04 | 35 |
| GO:00455983 | Oral cavity | OSCC | regulation of fat cell differentiation | 77/7305 | 139/18723 | 6.36e-05 | 5.18e-04 | 77 |
| GO:00170155 | Oral cavity | OSCC | regulation of transforming growth factor beta receptor signaling pathway | 71/7305 | 128/18723 | 1.14e-04 | 8.34e-04 | 71 |
| GO:19038446 | Oral cavity | OSCC | regulation of cellular response to transforming growth factor beta stimulus | 72/7305 | 131/18723 | 1.51e-04 | 1.06e-03 | 72 |
| GO:00305114 | Oral cavity | OSCC | positive regulation of transforming growth factor beta receptor signaling pathway | 23/7305 | 32/18723 | 1.67e-04 | 1.14e-03 | 23 |
| GO:19038464 | Oral cavity | OSCC | positive regulation of cellular response to transforming growth factor beta stimulus | 23/7305 | 32/18723 | 1.67e-04 | 1.14e-03 | 23 |
| GO:00018377 | Oral cavity | OSCC | epithelial to mesenchymal transition | 82/7305 | 157/18723 | 5.09e-04 | 2.98e-03 | 82 |
| GO:00163315 | Oral cavity | OSCC | morphogenesis of embryonic epithelium | 77/7305 | 147/18723 | 6.63e-04 | 3.72e-03 | 77 |
| GO:00107173 | Oral cavity | OSCC | regulation of epithelial to mesenchymal transition | 54/7305 | 99/18723 | 1.21e-03 | 6.10e-03 | 54 |
| GO:00071789 | Oral cavity | OSCC | transmembrane receptor protein serine/threonine kinase signaling pathway | 165/7305 | 355/18723 | 2.31e-03 | 1.02e-02 | 165 |
| GO:00487627 | Oral cavity | OSCC | mesenchymal cell differentiation | 109/7305 | 236/18723 | 1.43e-02 | 4.69e-02 | 109 |
| GO:001605532 | Oral cavity | NEOLP | Wnt signaling pathway | 93/2005 | 444/18723 | 1.35e-10 | 1.34e-08 | 93 |
| Page: 1 2 3 4 5 6 |
| Pathway ID | Tissue | Disease Stage | Description | Gene Ratio | Bg Ratio | pvalue | p.adjust | qvalue | Count |
| Page: 1 |
Top |
Cell-cell communication analysis |
| Identification of potential cell-cell interactions between two cell types and their ligand-receptor pairs for different disease states |
| Ligand | Receptor | LRpair | Pathway | Tissue | Disease Stage |
| Page: 1 |
Top |
Single-cell gene regulatory network inference analysis |
| Find out the significant the regulons (TFs) and the target genes of each regulon across cell types for different disease states |
| TF | Cell Type | Tissue | Disease Stage | Target Gene | RSS | Regulon Activity |
| ∗The dot plots of a searched regulon are shown for all cell subpopulations in each disease state of each tissue based on the regulon specific score inferred using pySCENIC and by calculating the average expression. |
| Page: 1 |
Top |
Somatic mutation of malignant transformation related genes |
| Annotation of somatic variants for genes involved in malignant transformation |
| Hugo Symbol | Variant Class | Variant Classification | dbSNP RS | HGVSc | HGVSp | HGVSp Short | SWISSPROT | BIOTYPE | SIFT | PolyPhen | Tumor Sample Barcode | Tissue | Histology | Sex | Age | Stage | Therapy Types | Drugs | Outcome |
| TGFB1I1 | SNV | Missense_Mutation | c.960N>G | p.Phe320Leu | p.F320L | O43294 | protein_coding | tolerated(0.06) | possibly_damaging(0.874) | TCGA-AC-A23H-01 | Breast | breast invasive carcinoma | Female | >=65 | I/II | Unknown | Unknown | PD | |
| TGFB1I1 | SNV | Missense_Mutation | novel | c.1232N>T | p.Pro411Leu | p.P411L | O43294 | protein_coding | deleterious(0) | probably_damaging(0.929) | TCGA-DS-A1OC-01 | Cervix | cervical & endocervical cancer | Female | <65 | I/II | Chemotherapy | gemcitabine | SD |
| TGFB1I1 | SNV | Missense_Mutation | c.661N>T | p.Pro221Ser | p.P221S | O43294 | protein_coding | tolerated(0.51) | benign(0.014) | TCGA-UC-A7PF-01 | Cervix | cervical & endocervical cancer | Female | <65 | I/II | Unknown | Unknown | SD | |
| TGFB1I1 | SNV | Missense_Mutation | rs199836545 | c.250G>A | p.Gly84Ser | p.G84S | O43294 | protein_coding | tolerated(0.72) | benign(0.011) | TCGA-A6-6781-01 | Colorectum | colon adenocarcinoma | Male | <65 | III/IV | Chemotherapy | oxaliplatin | SD |
| TGFB1I1 | SNV | Missense_Mutation | rs201803234 | c.185N>T | p.Thr62Met | p.T62M | O43294 | protein_coding | tolerated(0.25) | probably_damaging(0.98) | TCGA-AY-6197-01 | Colorectum | colon adenocarcinoma | Male | <65 | I/II | Unknown | Unknown | SD |
| TGFB1I1 | SNV | Missense_Mutation | novel | c.802N>A | p.Glu268Lys | p.E268K | O43294 | protein_coding | deleterious(0) | probably_damaging(0.998) | TCGA-AZ-4315-01 | Colorectum | colon adenocarcinoma | Male | <65 | I/II | Unknown | Unknown | SD |
| TGFB1I1 | SNV | Missense_Mutation | novel | c.338C>A | p.Ser113Tyr | p.S113Y | O43294 | protein_coding | deleterious(0.02) | probably_damaging(0.979) | TCGA-CA-6717-01 | Colorectum | colon adenocarcinoma | Male | <65 | I/II | Chemotherapy | oxaliplatin | CR |
| TGFB1I1 | SNV | Missense_Mutation | c.1182G>T | p.Glu394Asp | p.E394D | O43294 | protein_coding | deleterious(0.02) | possibly_damaging(0.893) | TCGA-CA-6717-01 | Colorectum | colon adenocarcinoma | Male | <65 | I/II | Chemotherapy | oxaliplatin | CR | |
| TGFB1I1 | SNV | Missense_Mutation | rs753388681 | c.249N>A | p.Ser83Arg | p.S83R | O43294 | protein_coding | tolerated(0.06) | possibly_damaging(0.632) | TCGA-CK-5916-01 | Colorectum | colon adenocarcinoma | Female | >=65 | I/II | Unknown | Unknown | PD |
| TGFB1I1 | SNV | Missense_Mutation | c.704T>A | p.Ile235Asn | p.I235N | O43294 | protein_coding | deleterious(0) | probably_damaging(0.998) | TCGA-CM-4743-01 | Colorectum | colon adenocarcinoma | Male | >=65 | I/II | Chemotherapy | capecitabine | SD |
| Page: 1 2 3 4 5 6 |
Top |
Related drugs of malignant transformation related genes |
| Identification of chemicals and drugs interact with genes involved in malignant transfromation |
| (DGIdb 4.0) |
| Entrez ID | Symbol | Category | Interaction Types | Drug Claim Name | Drug Name | PMIDs |
| Page: 1 |

Copyright 2023-Present -The University of Texas Health Science Center at Houston |