
|
|||||
|
 | |
| |
| |
| |
| |
| |
|
Gene: TFPI |
Gene summary for TFPI |
| Gene information | Species | Human | Gene symbol | TFPI | Gene ID | 7035 |
| Gene name | tissue factor pathway inhibitor | |
| Gene Alias | EPI | |
| Cytomap | 2q32.1 | |
| Gene Type | protein-coding | GO ID | GO:0002237 | UniProtAcc | P10646 |
Top |
Malignant transformation analysis |
| Identification of the aberrant gene expression in precancerous and cancerous lesions by comparing the gene expression of stem-like cells in diseased tissues with normal stem cells |
| Entrez ID | Symbol | Replicates | Species | Organ | Tissue | Adj P-value | Log2FC | Malignancy |
| 7035 | TFPI | AEH-subject2 | Human | Endometrium | AEH | 2.29e-05 | -9.00e-02 | -0.2525 |
| 7035 | TFPI | AEH-subject3 | Human | Endometrium | AEH | 1.70e-04 | -1.45e-01 | -0.2576 |
| 7035 | TFPI | AEH-subject4 | Human | Endometrium | AEH | 3.62e-02 | -3.74e-02 | -0.2657 |
| 7035 | TFPI | EEC-subject1 | Human | Endometrium | EEC | 4.70e-07 | -1.47e-01 | -0.2682 |
| 7035 | TFPI | EEC-subject2 | Human | Endometrium | EEC | 3.89e-10 | -1.56e-01 | -0.2607 |
| 7035 | TFPI | EEC-subject3 | Human | Endometrium | EEC | 5.38e-05 | -3.19e-02 | -0.2525 |
| 7035 | TFPI | EEC-subject5 | Human | Endometrium | EEC | 7.78e-06 | -1.41e-01 | -0.249 |
| 7035 | TFPI | GSM5276934 | Human | Endometrium | EEC | 1.00e-18 | 5.41e-01 | -0.0913 |
| 7035 | TFPI | GSM5276935 | Human | Endometrium | EEC | 4.30e-04 | -1.30e-01 | -0.123 |
| 7035 | TFPI | GSM5276937 | Human | Endometrium | EEC | 2.01e-19 | 5.60e-01 | -0.0897 |
| 7035 | TFPI | GSM6177620_NYU_UCEC1_lib1_lib1 | Human | Endometrium | EEC | 6.41e-05 | -1.42e-01 | -0.1869 |
| 7035 | TFPI | GSM6177620_NYU_UCEC1_lib2_lib2 | Human | Endometrium | EEC | 9.87e-05 | -1.56e-01 | -0.1875 |
| 7035 | TFPI | GSM6177620_NYU_UCEC1_lib3_lib3 | Human | Endometrium | EEC | 6.46e-06 | -1.56e-01 | -0.1883 |
| 7035 | TFPI | GSM6177621_NYU_UCEC2_lib1_lib1 | Human | Endometrium | EEC | 8.71e-07 | -1.56e-01 | -0.1934 |
| 7035 | TFPI | GSM6177622_NYU_UCEC3_lib1_lib1 | Human | Endometrium | EEC | 1.89e-07 | -1.56e-01 | -0.1917 |
| 7035 | TFPI | GSM6177622_NYU_UCEC3_lib2_lib2 | Human | Endometrium | EEC | 2.91e-09 | -1.12e-01 | -0.1916 |
| 7035 | TFPI | LZE2T | Human | Esophagus | ESCC | 4.49e-03 | 3.59e-01 | 0.082 |
| 7035 | TFPI | LZE8T | Human | Esophagus | ESCC | 3.38e-17 | 9.25e-01 | 0.067 |
| 7035 | TFPI | P4T-E | Human | Esophagus | ESCC | 3.84e-21 | 9.49e-01 | 0.1323 |
| 7035 | TFPI | P8T-E | Human | Esophagus | ESCC | 1.72e-16 | 5.06e-01 | 0.0889 |
| Page: 1 2 3 4 5 |
| Tissue | Expression Dynamics | Abbreviation |
| Endometrium |  | AEH: Atypical endometrial hyperplasia |
| EEC: Endometrioid Cancer | ||
| Esophagus | 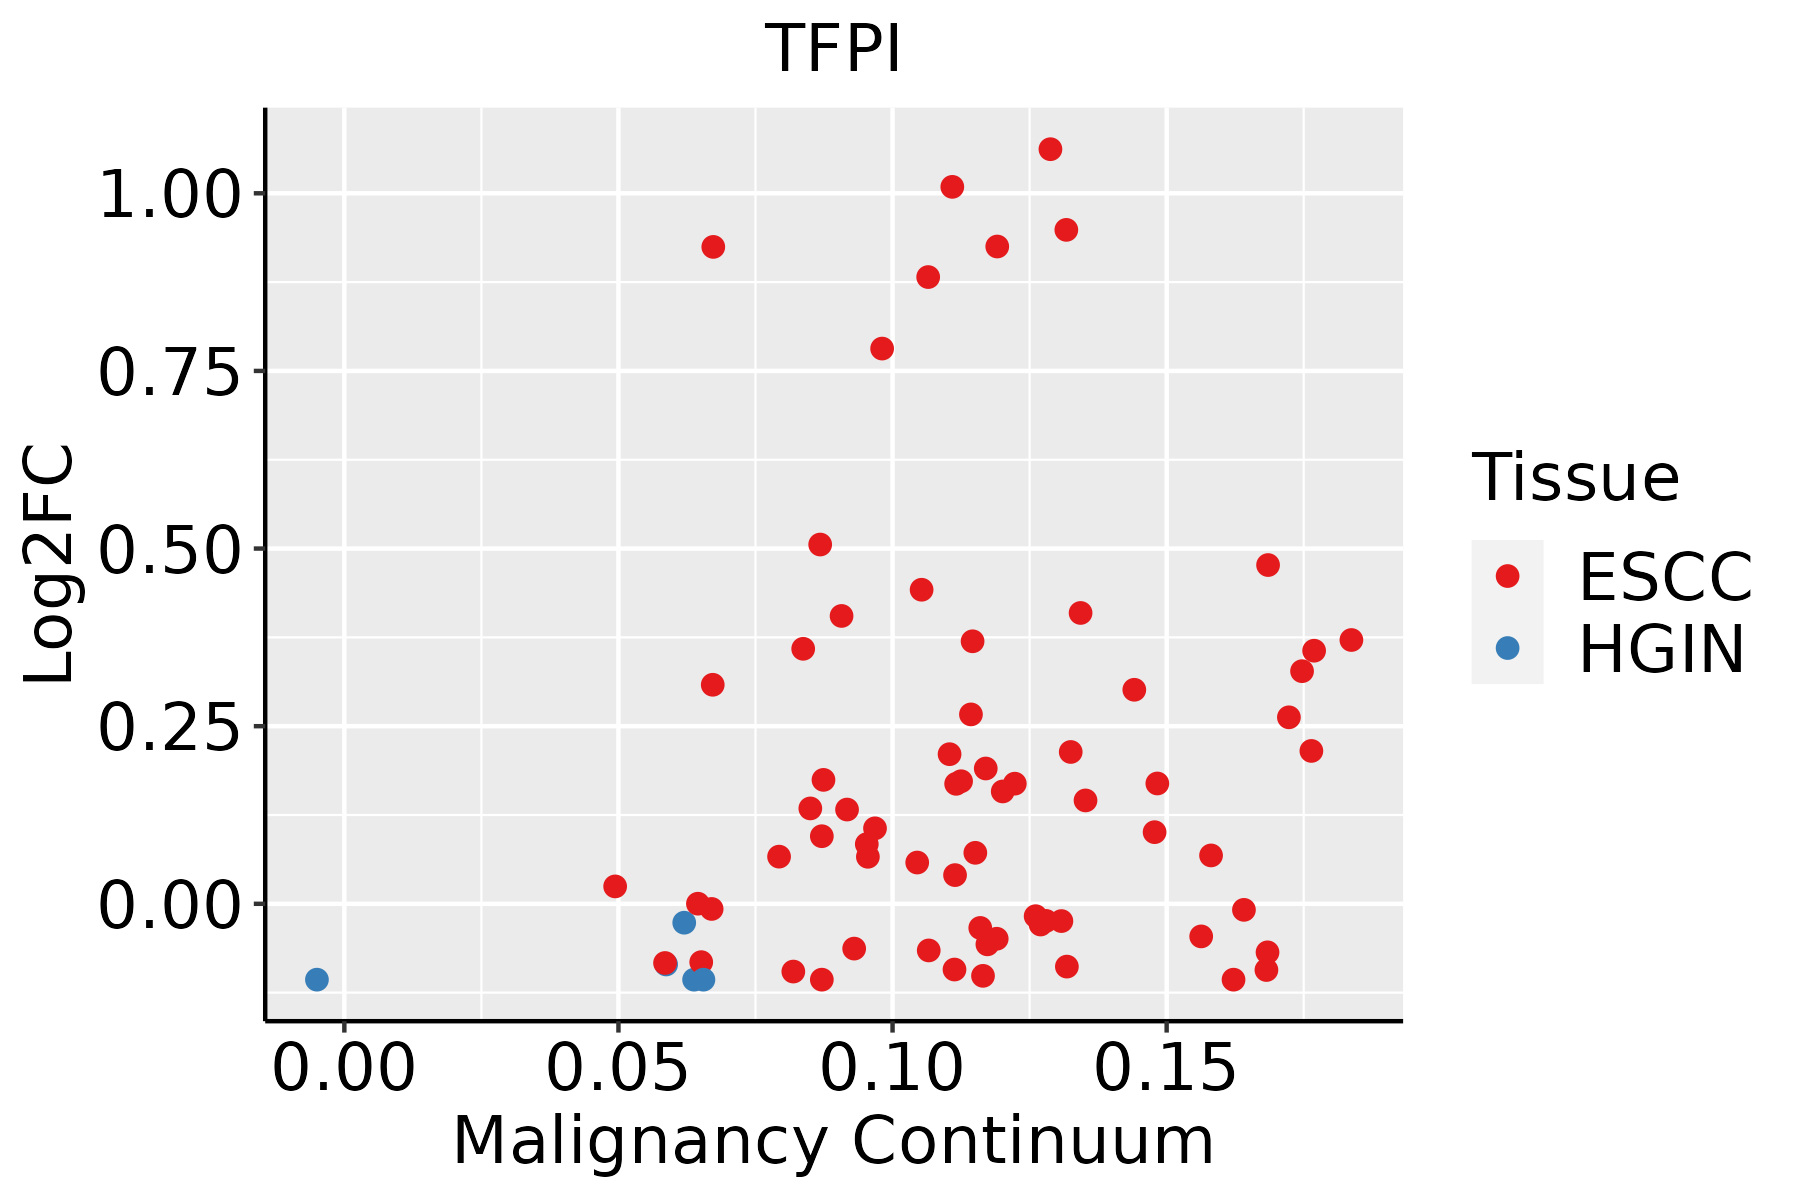 | ESCC: Esophageal squamous cell carcinoma |
| HGIN: High-grade intraepithelial neoplasias | ||
| LGIN: Low-grade intraepithelial neoplasias | ||
| Liver | 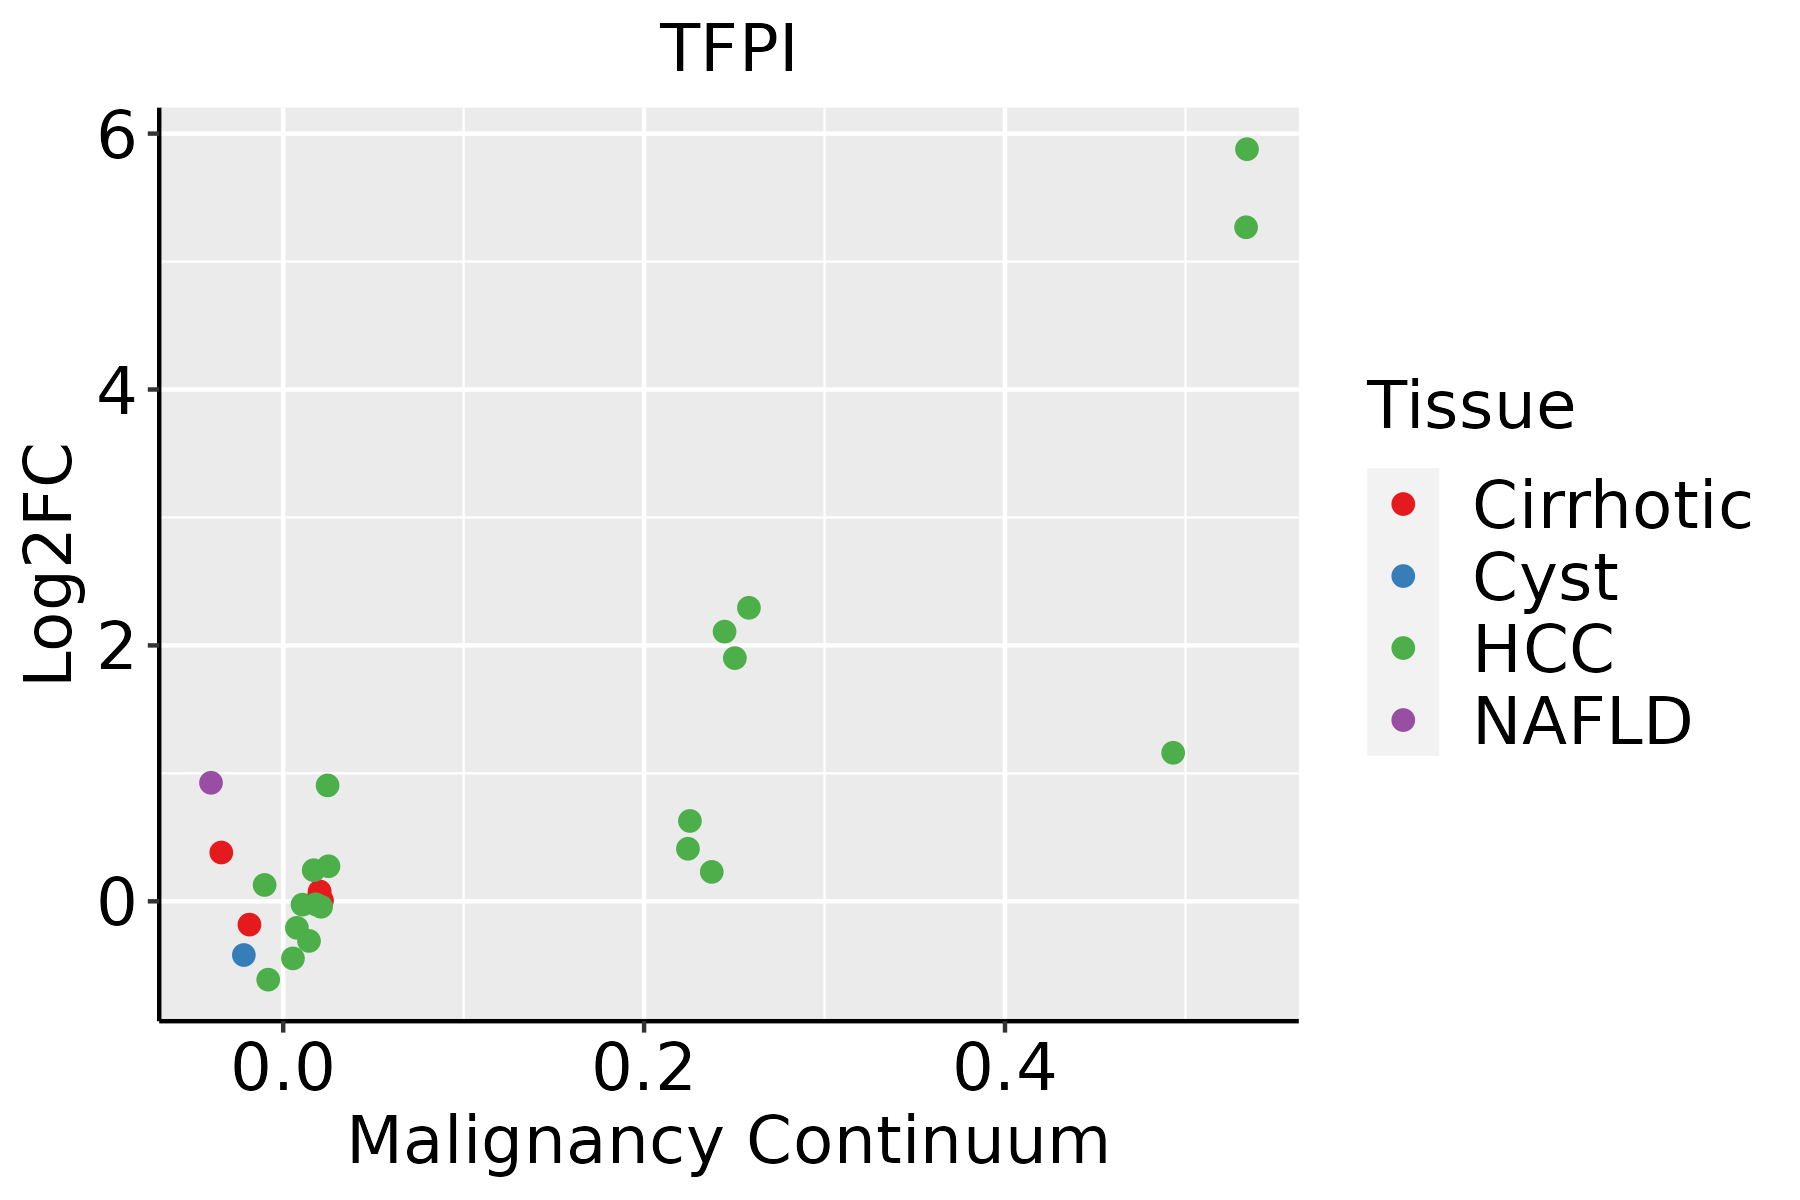 | HCC: Hepatocellular carcinoma |
| NAFLD: Non-alcoholic fatty liver disease | ||
| Lung | 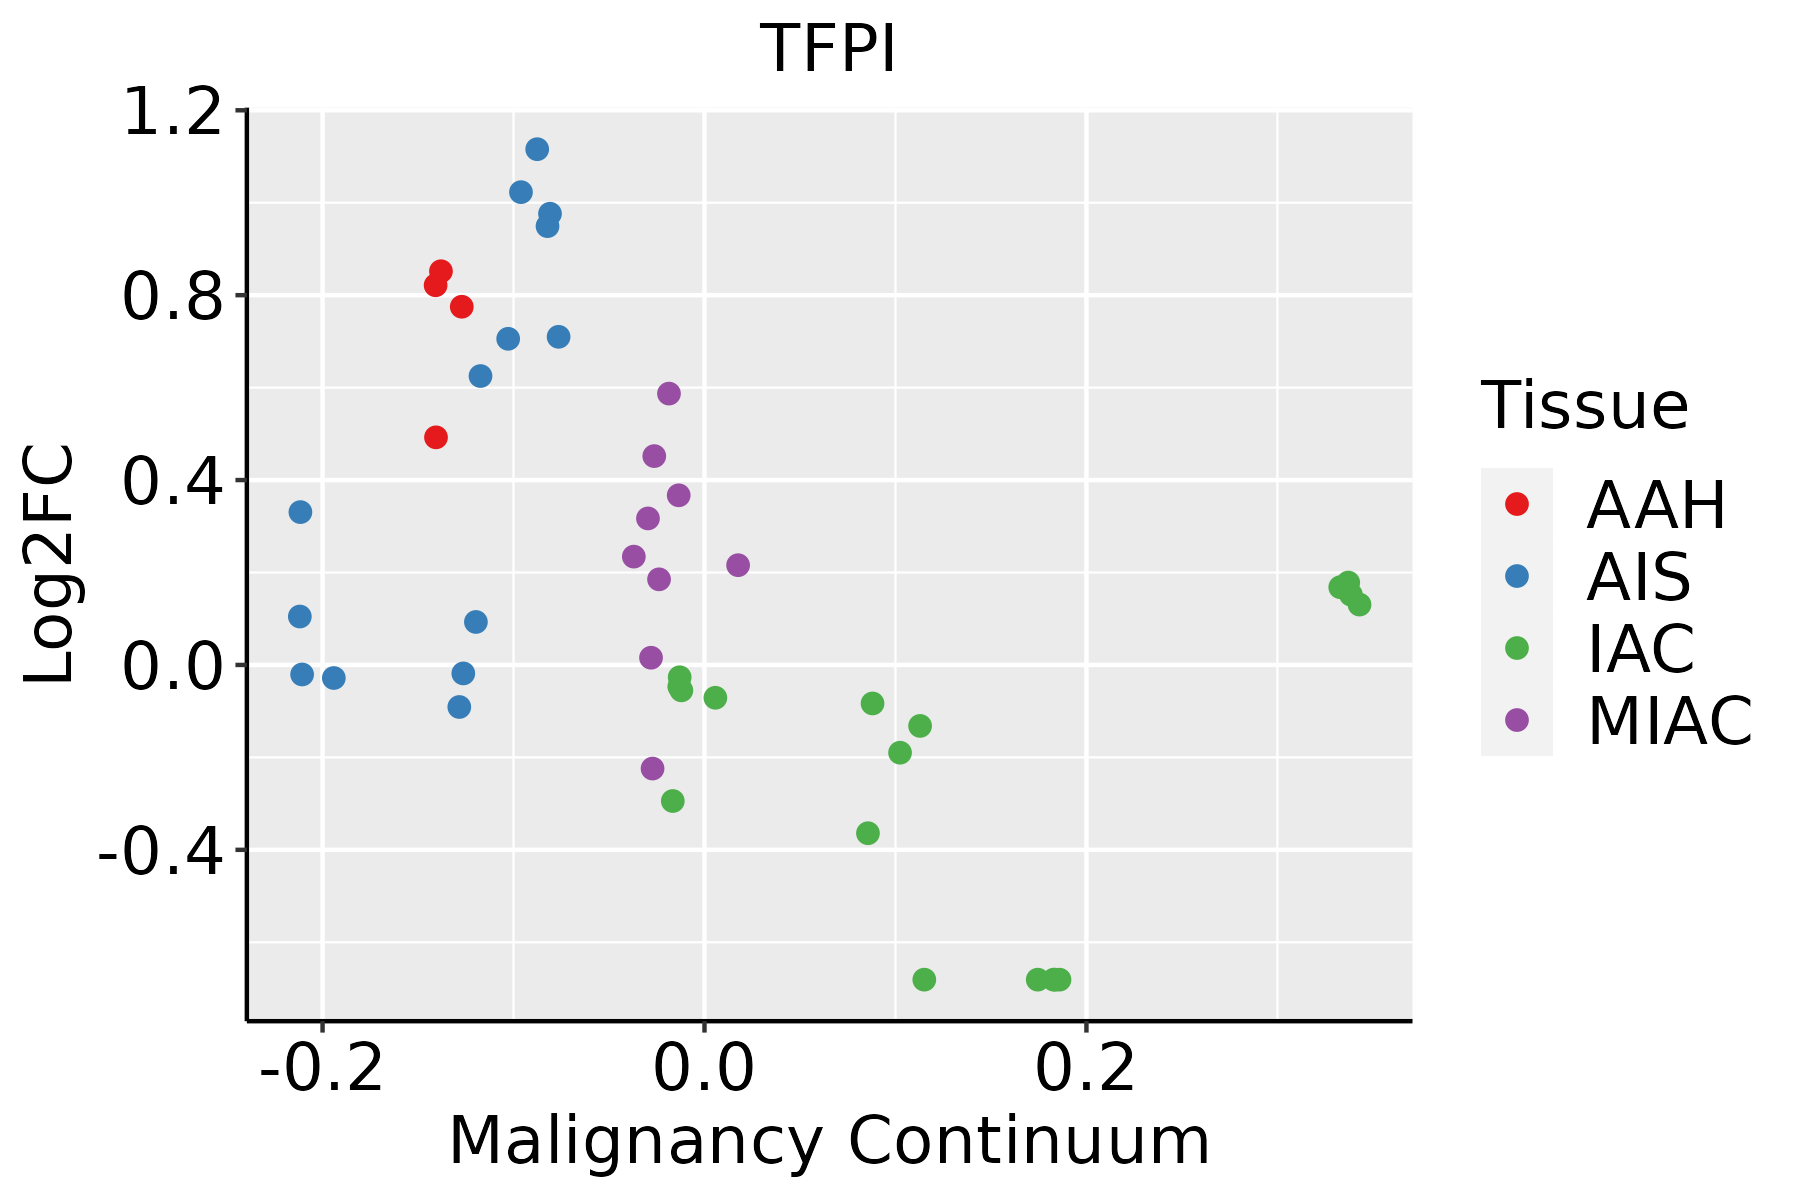 | AAH: Atypical adenomatous hyperplasia |
| AIS: Adenocarcinoma in situ | ||
| IAC: Invasive lung adenocarcinoma | ||
| MIA: Minimally invasive adenocarcinoma | ||
| Oral Cavity |  | EOLP: Erosive Oral lichen planus |
| LP: leukoplakia | ||
| NEOLP: Non-erosive oral lichen planus | ||
| OSCC: Oral squamous cell carcinoma | ||
| Thyroid | 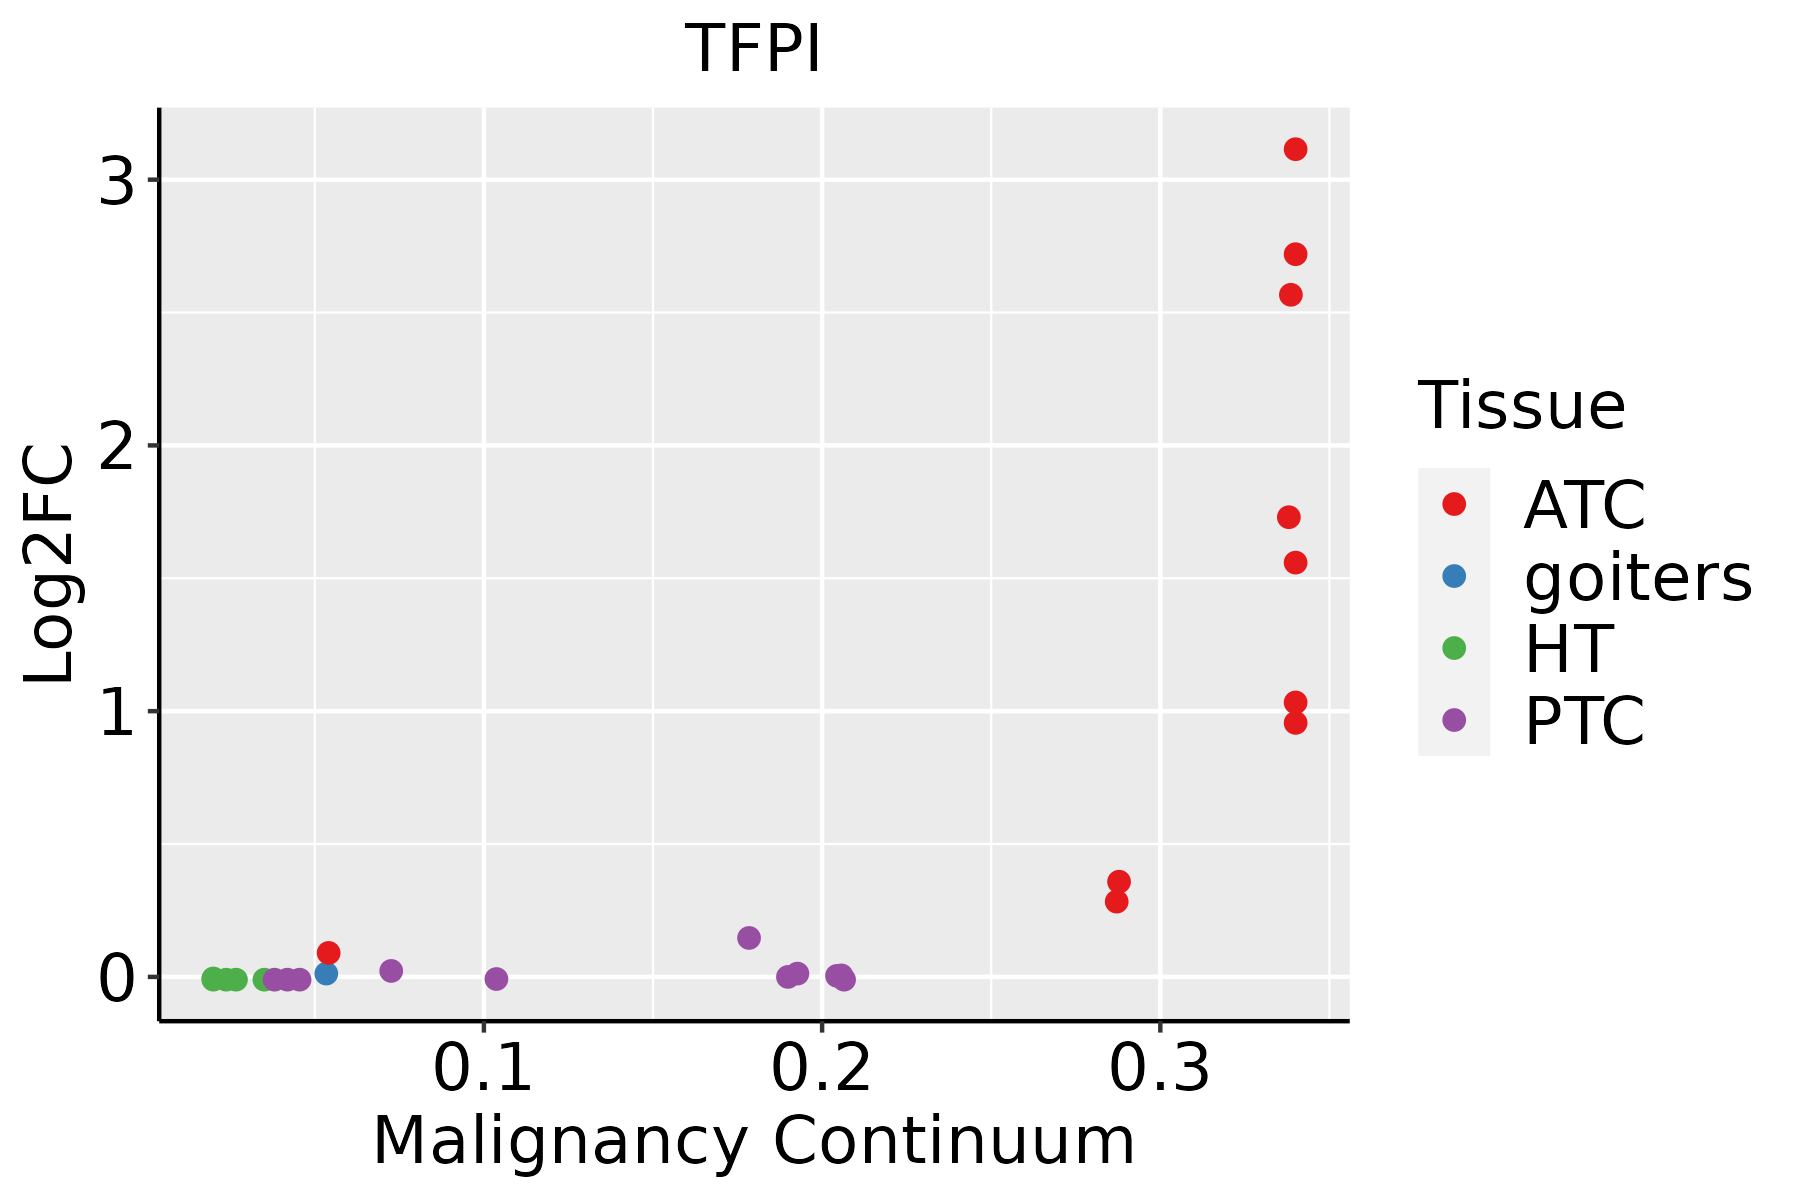 | ATC: Anaplastic thyroid cancer |
| HT: Hashimoto's thyroiditis | ||
| PTC: Papillary thyroid cancer |
| ∗log2FC in expression of this searched gene in stem-like cells from each diseased tissue sample relative to stem-like cells in normal samples in each tissue plotted against the malignancy continuum. Samples are colored based on if they are from different disease stage. |
Top |
Malignant transformation related pathway analysis |
| Find out the enriched GO biological processes and KEGG pathways involved in transition from healthy to precancer to cancer |
| Tissue | Disease Stage | Enriched GO biological Processes |
| Colorectum | AD |  |
| Colorectum | SER |  |
| Colorectum | MSS |  |
| Colorectum | MSI-H |  |
| Colorectum | FAP |  |
| ∗Top 15 enriched GO BP terms are showed in the bar plot of each disease state in each tissue. Each row represents a significant GO biological process which is colored according to the -log10(p.adjust). |
| Page: 1 2 3 4 5 6 7 8 9 |
| GO ID | Tissue | Disease Stage | Description | Gene Ratio | Bg Ratio | pvalue | p.adjust | Count |
| GO:00705555 | Endometrium | AEH | response to interleukin-1 | 26/2100 | 143/18723 | 8.78e-03 | 4.78e-02 | 26 |
| GO:004206017 | Endometrium | EEC | wound healing | 92/2168 | 422/18723 | 1.12e-09 | 9.58e-08 | 92 |
| GO:004854517 | Endometrium | EEC | response to steroid hormone | 77/2168 | 339/18723 | 3.80e-09 | 2.71e-07 | 77 |
| GO:005254717 | Endometrium | EEC | regulation of peptidase activity | 91/2168 | 461/18723 | 2.00e-07 | 8.93e-06 | 91 |
| GO:004586117 | Endometrium | EEC | negative regulation of proteolysis | 72/2168 | 351/18723 | 8.46e-07 | 2.98e-05 | 72 |
| GO:005254817 | Endometrium | EEC | regulation of endopeptidase activity | 82/2168 | 432/18723 | 3.96e-06 | 1.04e-04 | 82 |
| GO:007138315 | Endometrium | EEC | cellular response to steroid hormone stimulus | 45/2168 | 204/18723 | 1.40e-05 | 2.79e-04 | 45 |
| GO:005134615 | Endometrium | EEC | negative regulation of hydrolase activity | 72/2168 | 379/18723 | 1.46e-05 | 2.87e-04 | 72 |
| GO:003235514 | Endometrium | EEC | response to estradiol | 34/2168 | 141/18723 | 2.22e-05 | 3.98e-04 | 34 |
| GO:000223714 | Endometrium | EEC | response to molecule of bacterial origin | 68/2168 | 363/18723 | 3.96e-05 | 6.64e-04 | 68 |
| GO:003249614 | Endometrium | EEC | response to lipopolysaccharide | 65/2168 | 343/18723 | 4.04e-05 | 6.75e-04 | 65 |
| GO:000759613 | Endometrium | EEC | blood coagulation | 44/2168 | 217/18723 | 1.42e-04 | 1.84e-03 | 44 |
| GO:190303415 | Endometrium | EEC | regulation of response to wounding | 36/2168 | 167/18723 | 1.58e-04 | 1.99e-03 | 36 |
| GO:000759913 | Endometrium | EEC | hemostasis | 44/2168 | 222/18723 | 2.43e-04 | 2.85e-03 | 44 |
| GO:005081713 | Endometrium | EEC | coagulation | 44/2168 | 222/18723 | 2.43e-04 | 2.85e-03 | 44 |
| GO:001046615 | Endometrium | EEC | negative regulation of peptidase activity | 49/2168 | 262/18723 | 4.64e-04 | 4.79e-03 | 49 |
| GO:001095114 | Endometrium | EEC | negative regulation of endopeptidase activity | 47/2168 | 252/18723 | 6.37e-04 | 6.25e-03 | 47 |
| GO:005087816 | Endometrium | EEC | regulation of body fluid levels | 65/2168 | 379/18723 | 7.48e-04 | 7.05e-03 | 65 |
| GO:007122213 | Endometrium | EEC | cellular response to lipopolysaccharide | 40/2168 | 209/18723 | 9.31e-04 | 8.37e-03 | 40 |
| GO:007121613 | Endometrium | EEC | cellular response to biotic stimulus | 45/2168 | 246/18723 | 1.24e-03 | 1.03e-02 | 45 |
| Page: 1 2 3 4 5 6 7 8 9 10 11 12 13 14 |
| Pathway ID | Tissue | Disease Stage | Description | Gene Ratio | Bg Ratio | pvalue | p.adjust | qvalue | Count |
| hsa04610 | Liver | NAFLD | Complement and coagulation cascades | 35/1043 | 86/8465 | 2.48e-11 | 2.04e-09 | 1.64e-09 | 35 |
| hsa046101 | Liver | NAFLD | Complement and coagulation cascades | 35/1043 | 86/8465 | 2.48e-11 | 2.04e-09 | 1.64e-09 | 35 |
| hsa046102 | Liver | Cirrhotic | Complement and coagulation cascades | 48/2530 | 86/8465 | 4.41e-07 | 5.44e-06 | 3.35e-06 | 48 |
| hsa046103 | Liver | Cirrhotic | Complement and coagulation cascades | 48/2530 | 86/8465 | 4.41e-07 | 5.44e-06 | 3.35e-06 | 48 |
| hsa046104 | Liver | HCC | Complement and coagulation cascades | 57/4020 | 86/8465 | 3.19e-04 | 1.45e-03 | 8.04e-04 | 57 |
| hsa046105 | Liver | HCC | Complement and coagulation cascades | 57/4020 | 86/8465 | 3.19e-04 | 1.45e-03 | 8.04e-04 | 57 |
| Page: 1 |
Top |
Cell-cell communication analysis |
| Identification of potential cell-cell interactions between two cell types and their ligand-receptor pairs for different disease states |
| Ligand | Receptor | LRpair | Pathway | Tissue | Disease Stage |
| Page: 1 |
Top |
Single-cell gene regulatory network inference analysis |
| Find out the significant the regulons (TFs) and the target genes of each regulon across cell types for different disease states |
| TF | Cell Type | Tissue | Disease Stage | Target Gene | RSS | Regulon Activity |
| ∗The dot plots of a searched regulon are shown for all cell subpopulations in each disease state of each tissue based on the regulon specific score inferred using pySCENIC and by calculating the average expression. |
| Page: 1 |
Top |
Somatic mutation of malignant transformation related genes |
| Annotation of somatic variants for genes involved in malignant transformation |
| Hugo Symbol | Variant Class | Variant Classification | dbSNP RS | HGVSc | HGVSp | HGVSp Short | SWISSPROT | BIOTYPE | SIFT | PolyPhen | Tumor Sample Barcode | Tissue | Histology | Sex | Age | Stage | Therapy Types | Drugs | Outcome |
| TFPI | SNV | Missense_Mutation | novel | c.295N>C | p.Glu99Gln | p.E99Q | P10646 | protein_coding | deleterious(0.03) | possibly_damaging(0.851) | TCGA-BH-A0B6-01 | Breast | breast invasive carcinoma | Female | <65 | I/II | Unknown | Unknown | SD |
| TFPI | SNV | Missense_Mutation | rs746176720 | c.637N>A | p.Gly213Ser | p.G213S | P10646 | protein_coding | tolerated(0.39) | benign(0.44) | TCGA-D8-A1Y1-01 | Breast | breast invasive carcinoma | Female | >=65 | III/IV | Hormone Therapy | tamoxiphen | PD |
| TFPI | SNV | Missense_Mutation | rs781414695 | c.889N>A | p.Glu297Lys | p.E297K | P10646 | protein_coding | tolerated(0.16) | possibly_damaging(0.709) | TCGA-UC-A7PF-01 | Cervix | cervical & endocervical cancer | Female | <65 | I/II | Unknown | Unknown | SD |
| TFPI | SNV | Missense_Mutation | c.238G>A | p.Glu80Lys | p.E80K | P10646 | protein_coding | deleterious(0) | probably_damaging(1) | TCGA-AA-3510-01 | Colorectum | colon adenocarcinoma | Male | >=65 | I/II | Unknown | Unknown | SD | |
| TFPI | SNV | Missense_Mutation | c.821G>T | p.Arg274Ile | p.R274I | P10646 | protein_coding | deleterious(0) | possibly_damaging(0.641) | TCGA-AA-3977-01 | Colorectum | colon adenocarcinoma | Male | >=65 | I/II | Unknown | Unknown | SD | |
| TFPI | SNV | Missense_Mutation | c.706N>G | p.Asn236Asp | p.N236D | P10646 | protein_coding | tolerated(0.12) | probably_damaging(0.925) | TCGA-CK-4951-01 | Colorectum | colon adenocarcinoma | Female | >=65 | I/II | Unknown | Unknown | PD | |
| TFPI | SNV | Missense_Mutation | c.730N>A | p.Pro244Thr | p.P244T | P10646 | protein_coding | deleterious(0.04) | possibly_damaging(0.651) | TCGA-CK-5913-01 | Colorectum | colon adenocarcinoma | Female | <65 | I/II | Unknown | Unknown | SD | |
| TFPI | SNV | Missense_Mutation | rs568113767 | c.173N>T | p.Ala58Val | p.A58V | P10646 | protein_coding | tolerated(0.11) | benign(0.101) | TCGA-DM-A1HB-01 | Colorectum | colon adenocarcinoma | Male | >=65 | III/IV | Unknown | Unknown | SD |
| TFPI | insertion | Frame_Shift_Ins | novel | c.755_756insG | p.Asn253LysfsTer2 | p.N253Kfs*2 | P10646 | protein_coding | TCGA-DM-A1D4-01 | Colorectum | colon adenocarcinoma | Male | >=65 | I/II | Unknown | Unknown | PD | ||
| TFPI | SNV | Missense_Mutation | novel | c.419N>T | p.Arg140Met | p.R140M | P10646 | protein_coding | deleterious(0) | probably_damaging(1) | TCGA-A5-A0G2-01 | Endometrium | uterine corpus endometrioid carcinoma | Female | <65 | III/IV | Unknown | Unknown | SD |
| Page: 1 2 3 4 5 |
Top |
Related drugs of malignant transformation related genes |
| Identification of chemicals and drugs interact with genes involved in malignant transfromation |
| (DGIdb 4.0) |
| Entrez ID | Symbol | Category | Interaction Types | Drug Claim Name | Drug Name | PMIDs |
| 7035 | TFPI | CELL SURFACE, DRUGGABLE GENOME, PROTEASE INHIBITOR | PI-88 | MUPARFOSTAT | 11292191 | |
| 7035 | TFPI | CELL SURFACE, DRUGGABLE GENOME, PROTEASE INHIBITOR | CHONDROITIN SULFATE | 10959709 | ||
| 7035 | TFPI | CELL SURFACE, DRUGGABLE GENOME, PROTEASE INHIBITOR | AZITHROMYCIN | AZITHROMYCIN | 16113783 | |
| 7035 | TFPI | CELL SURFACE, DRUGGABLE GENOME, PROTEASE INHIBITOR | HEPARIN | HEPARIN | 11150580 | |
| 7035 | TFPI | CELL SURFACE, DRUGGABLE GENOME, PROTEASE INHIBITOR | NN-7415 | |||
| 7035 | TFPI | CELL SURFACE, DRUGGABLE GENOME, PROTEASE INHIBITOR | LOVASTATIN | LOVASTATIN | 7600119 | |
| 7035 | TFPI | CELL SURFACE, DRUGGABLE GENOME, PROTEASE INHIBITOR | CREMOPHOR | 9352228 | ||
| 7035 | TFPI | CELL SURFACE, DRUGGABLE GENOME, PROTEASE INHIBITOR | ATORVASTATIN | ATORVASTATIN | 15792677 | |
| 7035 | TFPI | CELL SURFACE, DRUGGABLE GENOME, PROTEASE INHIBITOR | FULVESTRANT | FULVESTRANT | 17029634 | |
| 7035 | TFPI | CELL SURFACE, DRUGGABLE GENOME, PROTEASE INHIBITOR | CHONDROITIN | 7974391 |
| Page: 1 2 |

Copyright 2023-Present -The University of Texas Health Science Center at Houston |