Schematic overview of the cellular and molecular mechanisms involved in the cancer progression, including the proposed cellular and molecular mechanisms in cancer cells trajectory. AT1: alveolar type 1 cells; AT2: alveolar type 2 cells; AAH: atypical adenomatous hyperplasia; AIS: adenocarcinoma in situ; MIA: minimally invasive adenocarcinoma; IA: invasive adenocarcinoma; EMT: epithelial-mesenchymal transition

Home

Download

Statistics

Help

Contact

Center for Computational Systems Medicine
leaf

Gene summary

leaf

Malignant transformation analysis

leaf

Malignant transformation related pathway analysis

leaf

Cell-cell communication analysis

leaf

Single-cell gene regulatory network inference analysis

leaf

Somatic mutation of malignant transformation related genes

leaf

Related drugs of malignant transformation related genes

Gene: TCOF1

Gene summary for TCOF1

check button Gene summary.

Gene informationSpeciesHuman
Gene symbol

TCOF1

Gene ID

6949

Gene nametreacle ribosome biogenesis factor 1
Gene AliasMFD1
Cytomap5q32-q33.1
Gene Typeprotein-coding
GO ID

GO:0001501

UniProtAcc

Q13428


Top

Malignant transformation analysis

check button Identification of the aberrant gene expression in precancerous and cancerous lesions by comparing the gene expression of stem-like cells in diseased tissues with normal stem cells
check button Malignant transformation involving gene list.
Entrez IDSymbolReplicatesSpeciesOrganTissueAdj P-valueLog2FCMalignancy
6949TCOF1LZE4THumanEsophagusESCC1.18e-071.50e-010.0811
6949TCOF1LZE7THumanEsophagusESCC1.26e-053.23e-010.0667
6949TCOF1LZE8THumanEsophagusESCC9.63e-079.79e-020.067
6949TCOF1LZE20THumanEsophagusESCC3.65e-033.91e-020.0662
6949TCOF1LZE24THumanEsophagusESCC1.38e-093.35e-010.0596
6949TCOF1LZE21THumanEsophagusESCC5.31e-053.58e-010.0655
6949TCOF1P1T-EHumanEsophagusESCC9.59e-033.23e-010.0875
6949TCOF1P2T-EHumanEsophagusESCC2.29e-216.21e-010.1177
6949TCOF1P4T-EHumanEsophagusESCC1.19e-164.32e-010.1323
6949TCOF1P5T-EHumanEsophagusESCC4.06e-255.37e-010.1327
6949TCOF1P8T-EHumanEsophagusESCC4.83e-121.80e-010.0889
6949TCOF1P9T-EHumanEsophagusESCC6.41e-092.29e-010.1131
6949TCOF1P10T-EHumanEsophagusESCC5.16e-163.16e-010.116
6949TCOF1P11T-EHumanEsophagusESCC6.73e-103.74e-010.1426
6949TCOF1P12T-EHumanEsophagusESCC1.83e-174.46e-010.1122
6949TCOF1P15T-EHumanEsophagusESCC6.10e-164.21e-010.1149
6949TCOF1P16T-EHumanEsophagusESCC9.05e-163.02e-010.1153
6949TCOF1P17T-EHumanEsophagusESCC7.62e-117.21e-010.1278
6949TCOF1P19T-EHumanEsophagusESCC1.62e-024.54e-010.1662
6949TCOF1P20T-EHumanEsophagusESCC5.24e-112.39e-010.1124
Page: 1 2 3 4 5 6 

check button Transcriptomic changes along malignancy continuum.
TissueExpression DynamicsAbbreviation
EsophagusThe image shows the transcriptomic changes along malignancy continuum.log2FC in expression of this searched gene in stem-like cells from each diseased tissue sample relative to stem-like cells in normal samples in each tissue plotted against the malignancy continuum. Samples are colored based on if they are from different disease stage.ESCC: Esophageal squamous cell carcinoma
HGIN: High-grade intraepithelial neoplasias
LGIN: Low-grade intraepithelial neoplasias
LiverThe image shows the transcriptomic changes along malignancy continuum.log2FC in expression of this searched gene in stem-like cells from each diseased tissue sample relative to stem-like cells in normal samples in each tissue plotted against the malignancy continuum. Samples are colored based on if they are from different disease stage.HCC: Hepatocellular carcinoma
NAFLD: Non-alcoholic fatty liver disease
Oral CavityThe image shows the transcriptomic changes along malignancy continuum.log2FC in expression of this searched gene in stem-like cells from each diseased tissue sample relative to stem-like cells in normal samples in each tissue plotted against the malignancy continuum. Samples are colored based on if they are from different disease stage.
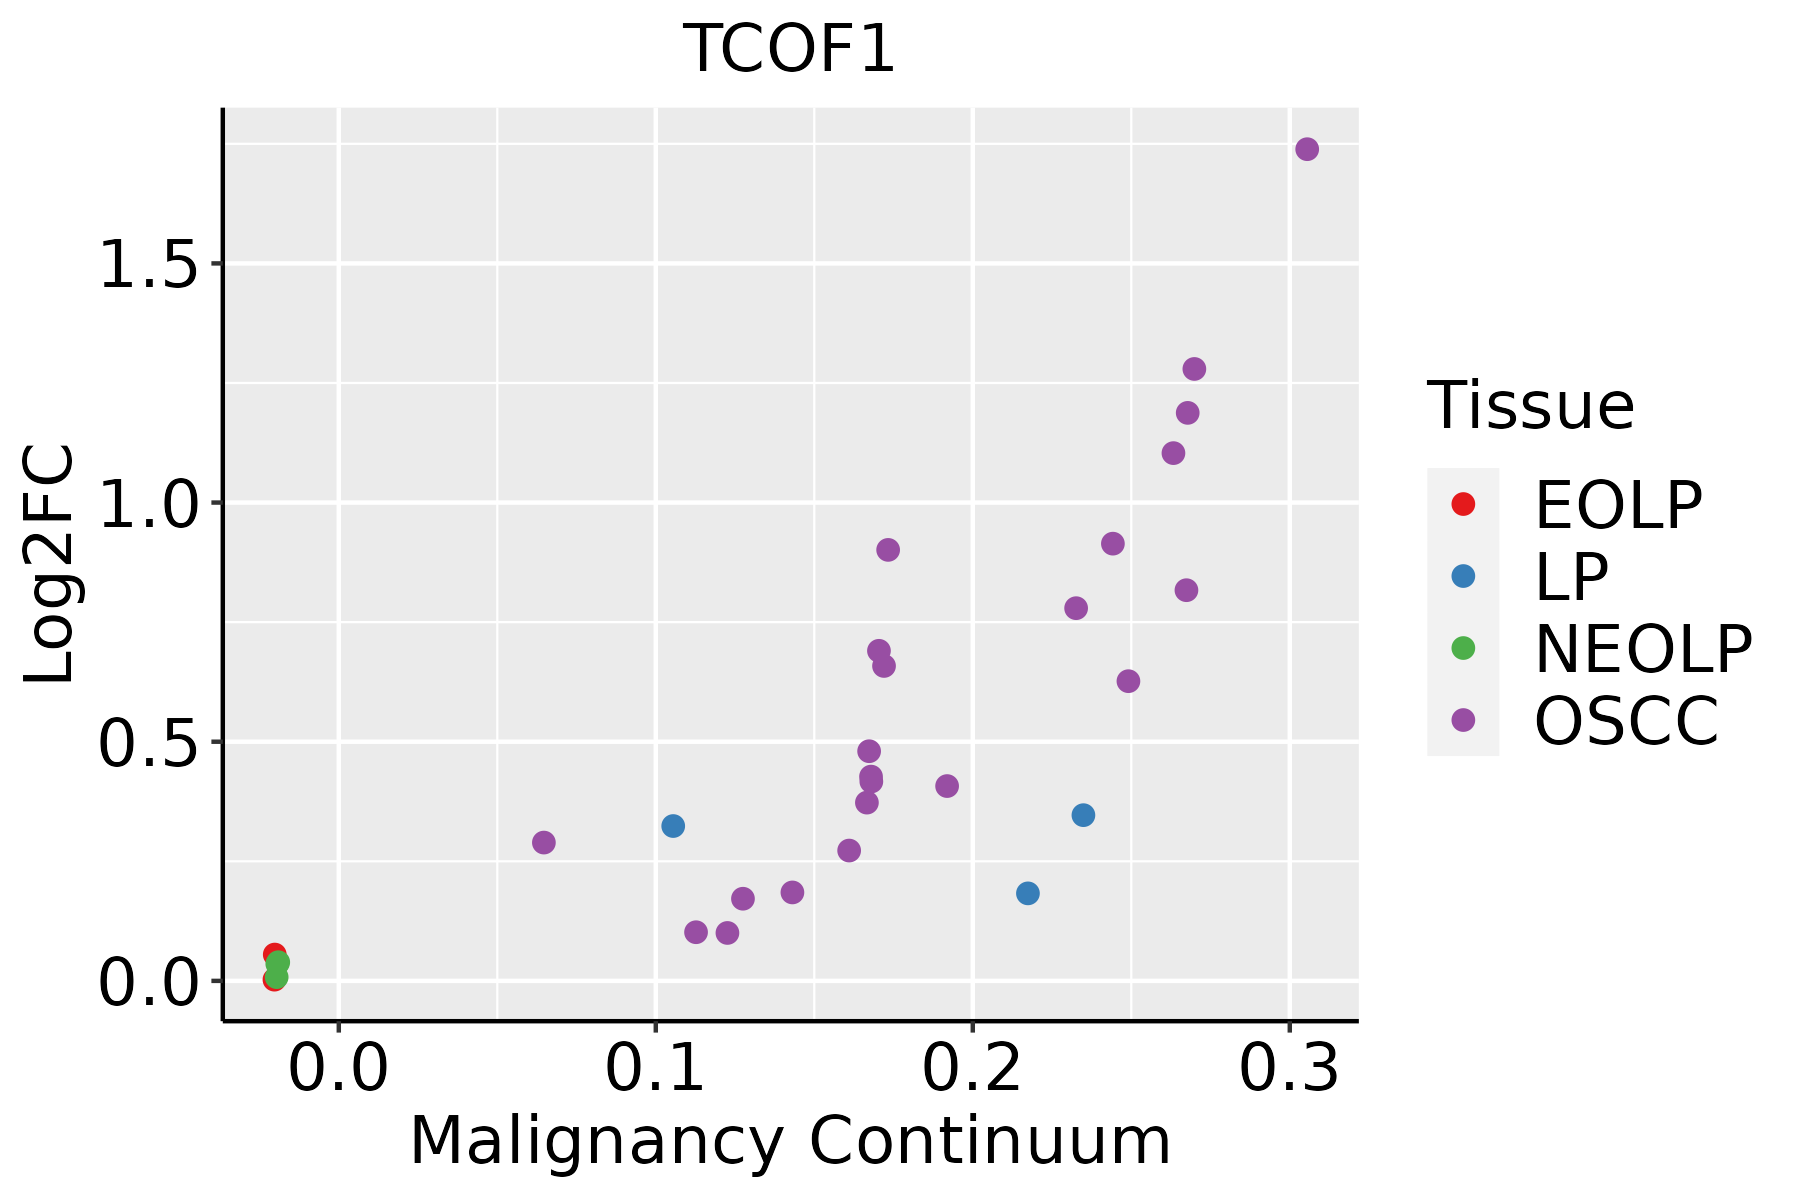
EOLP: Erosive Oral lichen planus
LP: leukoplakia
NEOLP: Non-erosive oral lichen planus
OSCC: Oral squamous cell carcinoma
SkinThe image shows the transcriptomic changes along malignancy continuum.log2FC in expression of this searched gene in stem-like cells from each diseased tissue sample relative to stem-like cells in normal samples in each tissue plotted against the malignancy continuum. Samples are colored based on if they are from different disease stage.AK: Actinic keratosis
cSCC: Cutaneous squamous cell carcinoma
SCCIS:squamous cell carcinoma in situ
ThyroidThe image shows the transcriptomic changes along malignancy continuum.log2FC in expression of this searched gene in stem-like cells from each diseased tissue sample relative to stem-like cells in normal samples in each tissue plotted against the malignancy continuum. Samples are colored based on if they are from different disease stage.ATC: Anaplastic thyroid cancer
HT: Hashimoto's thyroiditis
PTC: Papillary thyroid cancer
∗log2FC in expression of this searched gene in stem-like cells from each diseased tissue sample relative to stem-like cells in normal samples in each tissue plotted against the malignancy continuum. Samples are colored based on if they are from different disease stage.

Top

Malignant transformation related pathway analysis

check buttonFind out the enriched GO biological processes and KEGG pathways involved in transition from healthy to precancer to cancer
check button Figure of enriched GO biological processes.
TissueDisease StageEnriched GO biological Processes
ColorectumADGO analysis - Figure of enriched GO biological processes: Top 15 enriched GO BP terms are showed in the bar plot of each disease state in each tissue. Each row represents a significant GO biological process which is colored according to the -log10(p.adjust).
ColorectumSERGO analysis - Figure of enriched GO biological processes: Top 15 enriched GO BP terms are showed in the bar plot of each disease state in each tissue. Each row represents a significant GO biological process which is colored according to the -log10(p.adjust).
ColorectumMSSGO analysis - Figure of enriched GO biological processes: Top 15 enriched GO BP terms are showed in the bar plot of each disease state in each tissue. Each row represents a significant GO biological process which is colored according to the -log10(p.adjust).
ColorectumMSI-HGO analysis - Figure of enriched GO biological processes: Top 15 enriched GO BP terms are showed in the bar plot of each disease state in each tissue. Each row represents a significant GO biological process which is colored according to the -log10(p.adjust).
ColorectumFAPGO analysis - Figure of enriched GO biological processes: Top 15 enriched GO BP terms are showed in the bar plot of each disease state in each tissue. Each row represents a significant GO biological process which is colored according to the -log10(p.adjust).
∗Top 15 enriched GO BP terms are showed in the bar plot of each disease state in each tissue. Each row represents a significant GO biological process which is colored according to the -log10(p.adjust).
Page: 1 2 3 4 5 6 7 8 9 

check button Enriched GO biological processes.
GO IDTissueDisease StageDescriptionGene RatioBg Ratiopvaluep.adjustCount
GO:00018377Oral cavityOSCCepithelial to mesenchymal transition82/7305157/187235.09e-042.98e-0382
GO:00427901Oral cavityOSCCnucleolar large rRNA transcription by RNA polymerase I14/730518/187239.51e-044.96e-0314
GO:00487627Oral cavityOSCCmesenchymal cell differentiation109/7305236/187231.43e-024.69e-02109
GO:00488637Oral cavityOSCCstem cell differentiation96/7305206/187231.55e-024.99e-0296
GO:000641729SkincSCCregulation of translation226/4864468/187238.78e-262.62e-23226
GO:00063603SkincSCCtranscription by RNA polymerase I30/486455/187236.13e-068.70e-0530
GO:00987813SkincSCCncRNA transcription28/486456/187239.93e-059.22e-0428
GO:00093033SkincSCCrRNA transcription19/486434/187232.03e-041.69e-0319
GO:00427903SkincSCCnucleolar large rRNA transcription by RNA polymerase I11/486418/187231.74e-031.06e-0211
GO:004886317SkincSCCstem cell differentiation69/4864206/187239.56e-034.30e-0269
GO:0006417113ThyroidPTCregulation of translation236/5968468/187232.70e-172.52e-15236
GO:000183715ThyroidPTCepithelial to mesenchymal transition76/5968157/187231.10e-051.21e-0476
GO:004876215ThyroidPTCmesenchymal cell differentiation99/5968236/187236.72e-044.22e-0399
GO:00063604ThyroidPTCtranscription by RNA polymerase I28/596855/187232.55e-031.31e-0228
GO:004886318ThyroidPTCstem cell differentiation85/5968206/187232.71e-031.36e-0285
GO:00987814ThyroidPTCncRNA transcription27/596856/187237.77e-033.29e-0227
GO:006048514ThyroidPTCmesenchyme development112/5968291/187239.48e-033.90e-02112
GO:000641735ThyroidATCregulation of translation236/6293468/187232.39e-141.34e-12236
GO:000183722ThyroidATCepithelial to mesenchymal transition87/6293157/187231.50e-083.06e-0787
GO:004876221ThyroidATCmesenchymal cell differentiation116/6293236/187235.08e-077.30e-06116
Page: 1 2 3 

check button Enriched KEGG pathways.
Pathway IDTissueDisease StageDescriptionGene RatioBg Ratiopvaluep.adjustqvalueCount
Page: 1 

Top

Cell-cell communication analysis

check buttonIdentification of potential cell-cell interactions between two cell types and their ligand-receptor pairs for different disease states
LigandReceptorLRpairPathwayTissueDisease Stage
Page: 1 

Top

Single-cell gene regulatory network inference analysis

check buttonFind out the significant the regulons (TFs) and the target genes of each regulon across cell types for different disease states
TFCell TypeTissueDisease StageTarget GeneRSSRegulon Activity
∗The dot plots of a searched regulon are shown for all cell subpopulations in each disease state of each tissue based on the regulon specific score inferred using pySCENIC and by calculating the average expression.
Page: 1 

Top

Somatic mutation of malignant transformation related genes

check buttonAnnotation of somatic variants for genes involved in malignant transformation
Hugo SymbolVariant ClassVariant ClassificationdbSNP RSHGVScHGVSpHGVSp ShortSWISSPROTBIOTYPESIFTPolyPhenTumor Sample BarcodeTissueHistologySexAgeStageTherapy TypesDrugsOutcome
TCOF1SNVMissense_Mutationnovelc.3659A>Gp.Lys1220Argp.K1220RQ13428protein_codingdeleterious(0.01)probably_damaging(0.971)TCGA-A8-A08G-01Breastbreast invasive carcinomaFemale<65I/IIChemotherapy5-fluorouracilCR
TCOF1SNVMissense_Mutationc.3475N>Cp.Asp1159Hisp.D1159HQ13428protein_codingdeleterious(0)possibly_damaging(0.819)TCGA-AC-A23H-01Breastbreast invasive carcinomaFemale>=65I/IIUnknownUnknownPD
TCOF1SNVMissense_Mutationc.2048N>Tp.Ala683Valp.A683VQ13428protein_codingtolerated(0.1)benign(0.228)TCGA-BH-A1F6-01Breastbreast invasive carcinomaFemale<65III/IVUnknownUnknownSD
TCOF1SNVMissense_Mutationc.3707N>Tp.Ala1236Valp.A1236VQ13428protein_codingtolerated(0.12)benign(0.168)TCGA-E2-A15O-01Breastbreast invasive carcinomaFemale>=65I/IIHormone TherapyarimidexPD
TCOF1SNVMissense_Mutationc.3908N>Tp.Pro1303Leup.P1303LQ13428protein_codingdeleterious(0)possibly_damaging(0.781)TCGA-E2-A1LG-01Breastbreast invasive carcinomaFemale<65I/IIChemotherapydoxorubicinSD
TCOF1insertionFrame_Shift_Insnovelc.3661_3662insACCTGACTTTGCTGTTTGAp.Ala1221AspfsTer26p.A1221Dfs*26Q13428protein_codingTCGA-A8-A08G-01Breastbreast invasive carcinomaFemale<65I/IIChemotherapy5-fluorouracilCR
TCOF1insertionFrame_Shift_Insnovelc.2394_2395insCTp.Ala799LeufsTer30p.A799Lfs*30Q13428protein_codingTCGA-BH-A0DZ-01Breastbreast invasive carcinomaFemale<65I/IIChemotherapydocetaxelSD
TCOF1deletionFrame_Shift_Delnovelc.3639delNp.Ala1214ProfsTer12p.A1214Pfs*12Q13428protein_codingTCGA-EW-A2FV-01Breastbreast invasive carcinomaFemale<65III/IVChemotherapydocetaxelSD
TCOF1SNVMissense_Mutationc.206C>Tp.Ala69Valp.A69VQ13428protein_codingdeleterious(0.02)possibly_damaging(0.801)TCGA-2W-A8YY-01Cervixcervical & endocervical cancerFemale<65I/IIChemotherapycisplatinCR
TCOF1SNVMissense_Mutationnovelc.3695C>Tp.Ser1232Phep.S1232FQ13428protein_codingdeleterious(0.02)possibly_damaging(0.854)TCGA-2W-A8YY-01Cervixcervical & endocervical cancerFemale<65I/IIChemotherapycisplatinCR
Page: 1 2 3 4 5 6 7 8 9 10 11 12 

Top

Related drugs of malignant transformation related genes

check buttonIdentification of chemicals and drugs interact with genes involved in malignant transfromation
(DGIdb 4.0)
Entrez IDSymbolCategoryInteraction TypesDrug Claim NameDrug NamePMIDs
Page: 1