
|
|||||
|
 | |
| |
| |
| |
| |
| |
|
Gene: TAX1BP1 |
Gene summary for TAX1BP1 |
| Gene information | Species | Human | Gene symbol | TAX1BP1 | Gene ID | 8887 |
| Gene name | Tax1 binding protein 1 | |
| Gene Alias | CALCOCO3 | |
| Cytomap | 7p15.2 | |
| Gene Type | protein-coding | GO ID | GO:0006139 | UniProtAcc | Q86VP1 |
Top |
Malignant transformation analysis |
| Identification of the aberrant gene expression in precancerous and cancerous lesions by comparing the gene expression of stem-like cells in diseased tissues with normal stem cells |
| Entrez ID | Symbol | Replicates | Species | Organ | Tissue | Adj P-value | Log2FC | Malignancy |
| 8887 | TAX1BP1 | HTA11_3410_2000001011 | Human | Colorectum | AD | 1.31e-07 | -3.63e-01 | 0.0155 |
| 8887 | TAX1BP1 | HTA11_1938_2000001011 | Human | Colorectum | AD | 3.37e-04 | 5.51e-01 | -0.0811 |
| 8887 | TAX1BP1 | HTA11_78_2000001011 | Human | Colorectum | AD | 2.88e-04 | 5.52e-01 | -0.1088 |
| 8887 | TAX1BP1 | HTA11_347_2000001011 | Human | Colorectum | AD | 4.00e-18 | 7.02e-01 | -0.1954 |
| 8887 | TAX1BP1 | HTA11_411_2000001011 | Human | Colorectum | SER | 1.35e-02 | 7.45e-01 | -0.2602 |
| 8887 | TAX1BP1 | HTA11_99999974143_84620 | Human | Colorectum | MSS | 1.73e-06 | -3.96e-01 | 0.3005 |
| 8887 | TAX1BP1 | A002-C-010 | Human | Colorectum | FAP | 1.82e-04 | -9.05e-02 | 0.242 |
| 8887 | TAX1BP1 | A001-C-207 | Human | Colorectum | FAP | 2.26e-03 | -5.34e-02 | 0.1278 |
| 8887 | TAX1BP1 | A015-C-203 | Human | Colorectum | FAP | 1.51e-28 | -2.59e-01 | -0.1294 |
| 8887 | TAX1BP1 | A015-C-204 | Human | Colorectum | FAP | 1.34e-06 | -2.11e-01 | -0.0228 |
| 8887 | TAX1BP1 | A014-C-040 | Human | Colorectum | FAP | 2.99e-06 | -2.40e-01 | -0.1184 |
| 8887 | TAX1BP1 | A002-C-201 | Human | Colorectum | FAP | 3.41e-16 | -2.93e-01 | 0.0324 |
| 8887 | TAX1BP1 | A001-C-119 | Human | Colorectum | FAP | 7.75e-08 | -5.96e-02 | -0.1557 |
| 8887 | TAX1BP1 | A001-C-108 | Human | Colorectum | FAP | 1.23e-14 | -7.33e-03 | -0.0272 |
| 8887 | TAX1BP1 | A002-C-205 | Human | Colorectum | FAP | 7.85e-27 | 4.50e-02 | -0.1236 |
| 8887 | TAX1BP1 | A015-C-005 | Human | Colorectum | FAP | 1.87e-03 | -7.47e-02 | -0.0336 |
| 8887 | TAX1BP1 | A015-C-006 | Human | Colorectum | FAP | 2.85e-17 | -3.84e-01 | -0.0994 |
| 8887 | TAX1BP1 | A015-C-106 | Human | Colorectum | FAP | 1.27e-12 | -2.59e-01 | -0.0511 |
| 8887 | TAX1BP1 | A002-C-114 | Human | Colorectum | FAP | 1.07e-19 | -2.33e-01 | -0.1561 |
| 8887 | TAX1BP1 | A015-C-104 | Human | Colorectum | FAP | 1.76e-29 | -2.55e-01 | -0.1899 |
| Page: 1 2 3 4 5 6 7 8 9 10 11 |
| Tissue | Expression Dynamics | Abbreviation |
| Colorectum (GSE201348) |  | FAP: Familial adenomatous polyposis |
| CRC: Colorectal cancer | ||
| Colorectum (HTA11) |  | AD: Adenomas |
| SER: Sessile serrated lesions | ||
| MSI-H: Microsatellite-high colorectal cancer | ||
| MSS: Microsatellite stable colorectal cancer | ||
| Esophagus | 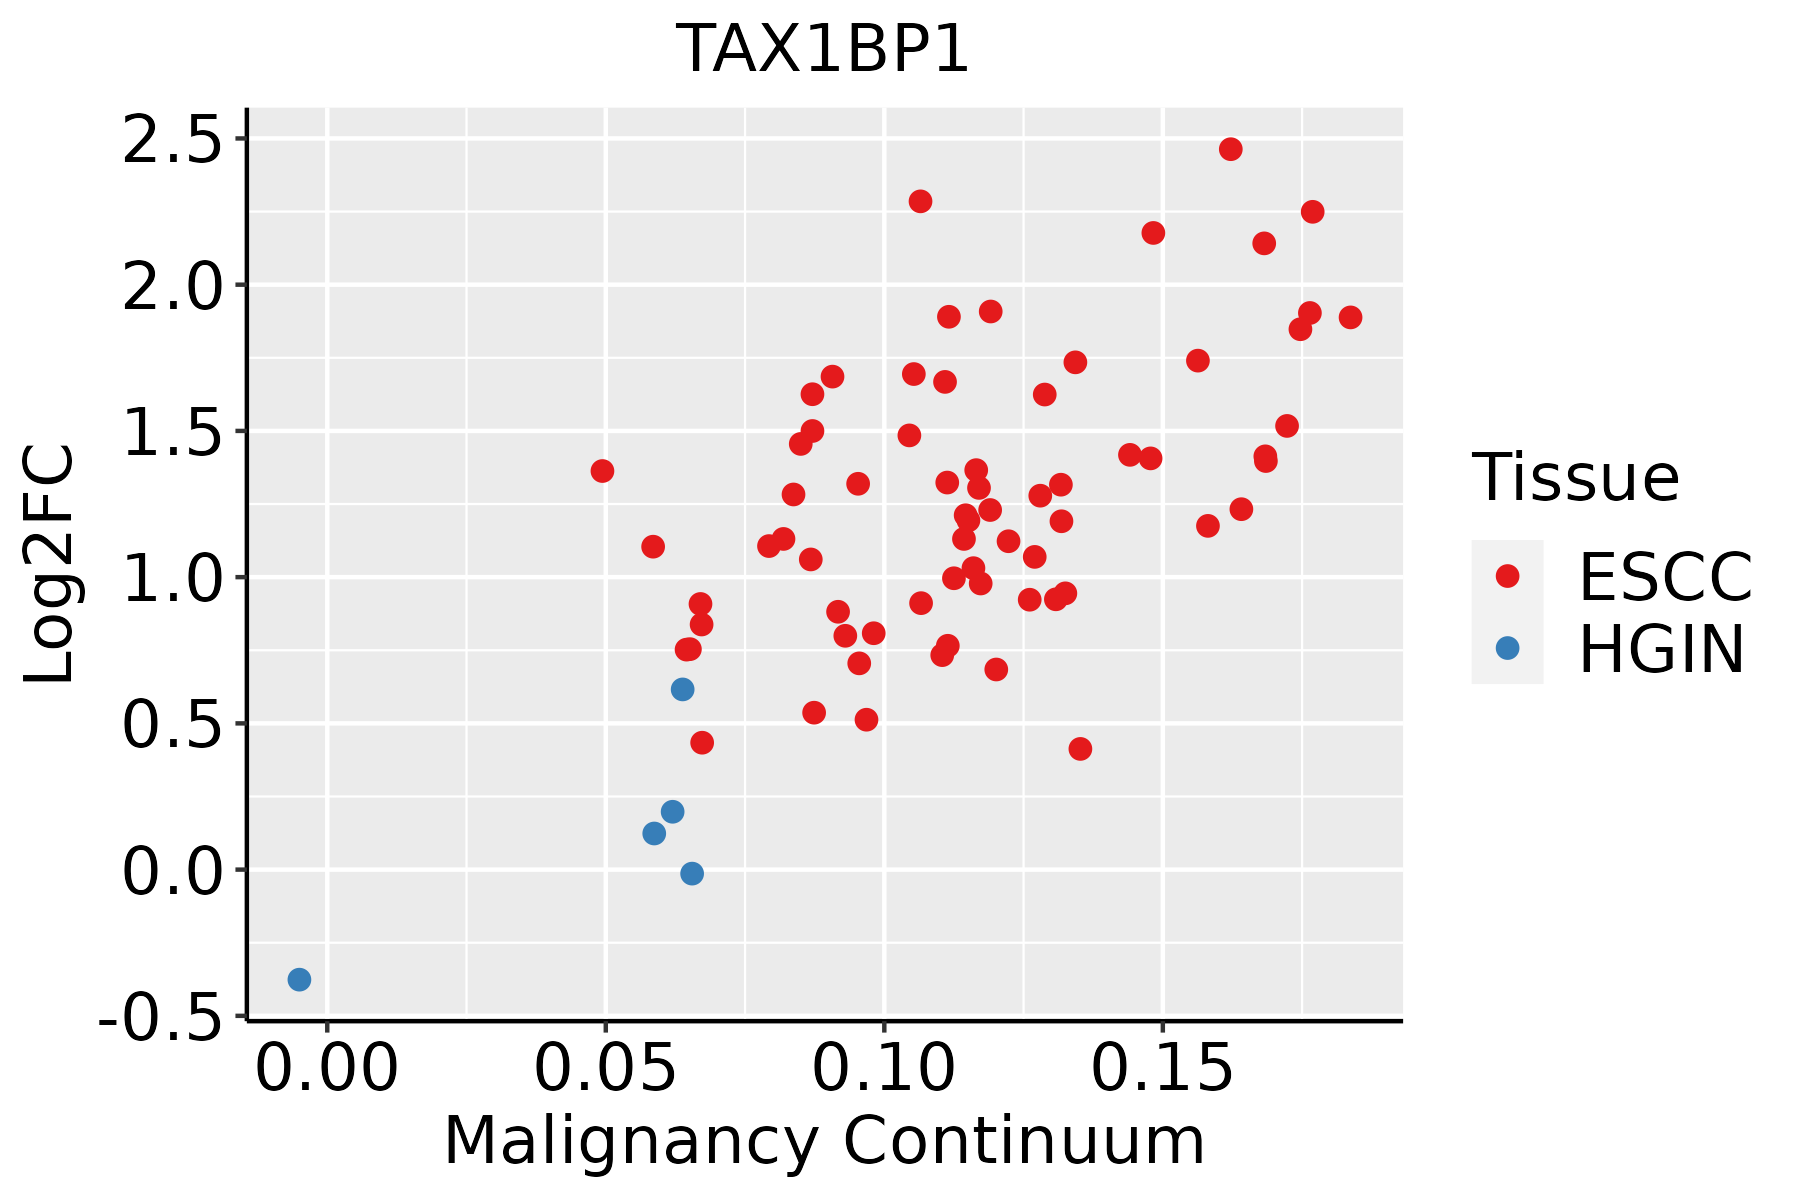 | ESCC: Esophageal squamous cell carcinoma |
| HGIN: High-grade intraepithelial neoplasias | ||
| LGIN: Low-grade intraepithelial neoplasias | ||
| Liver | 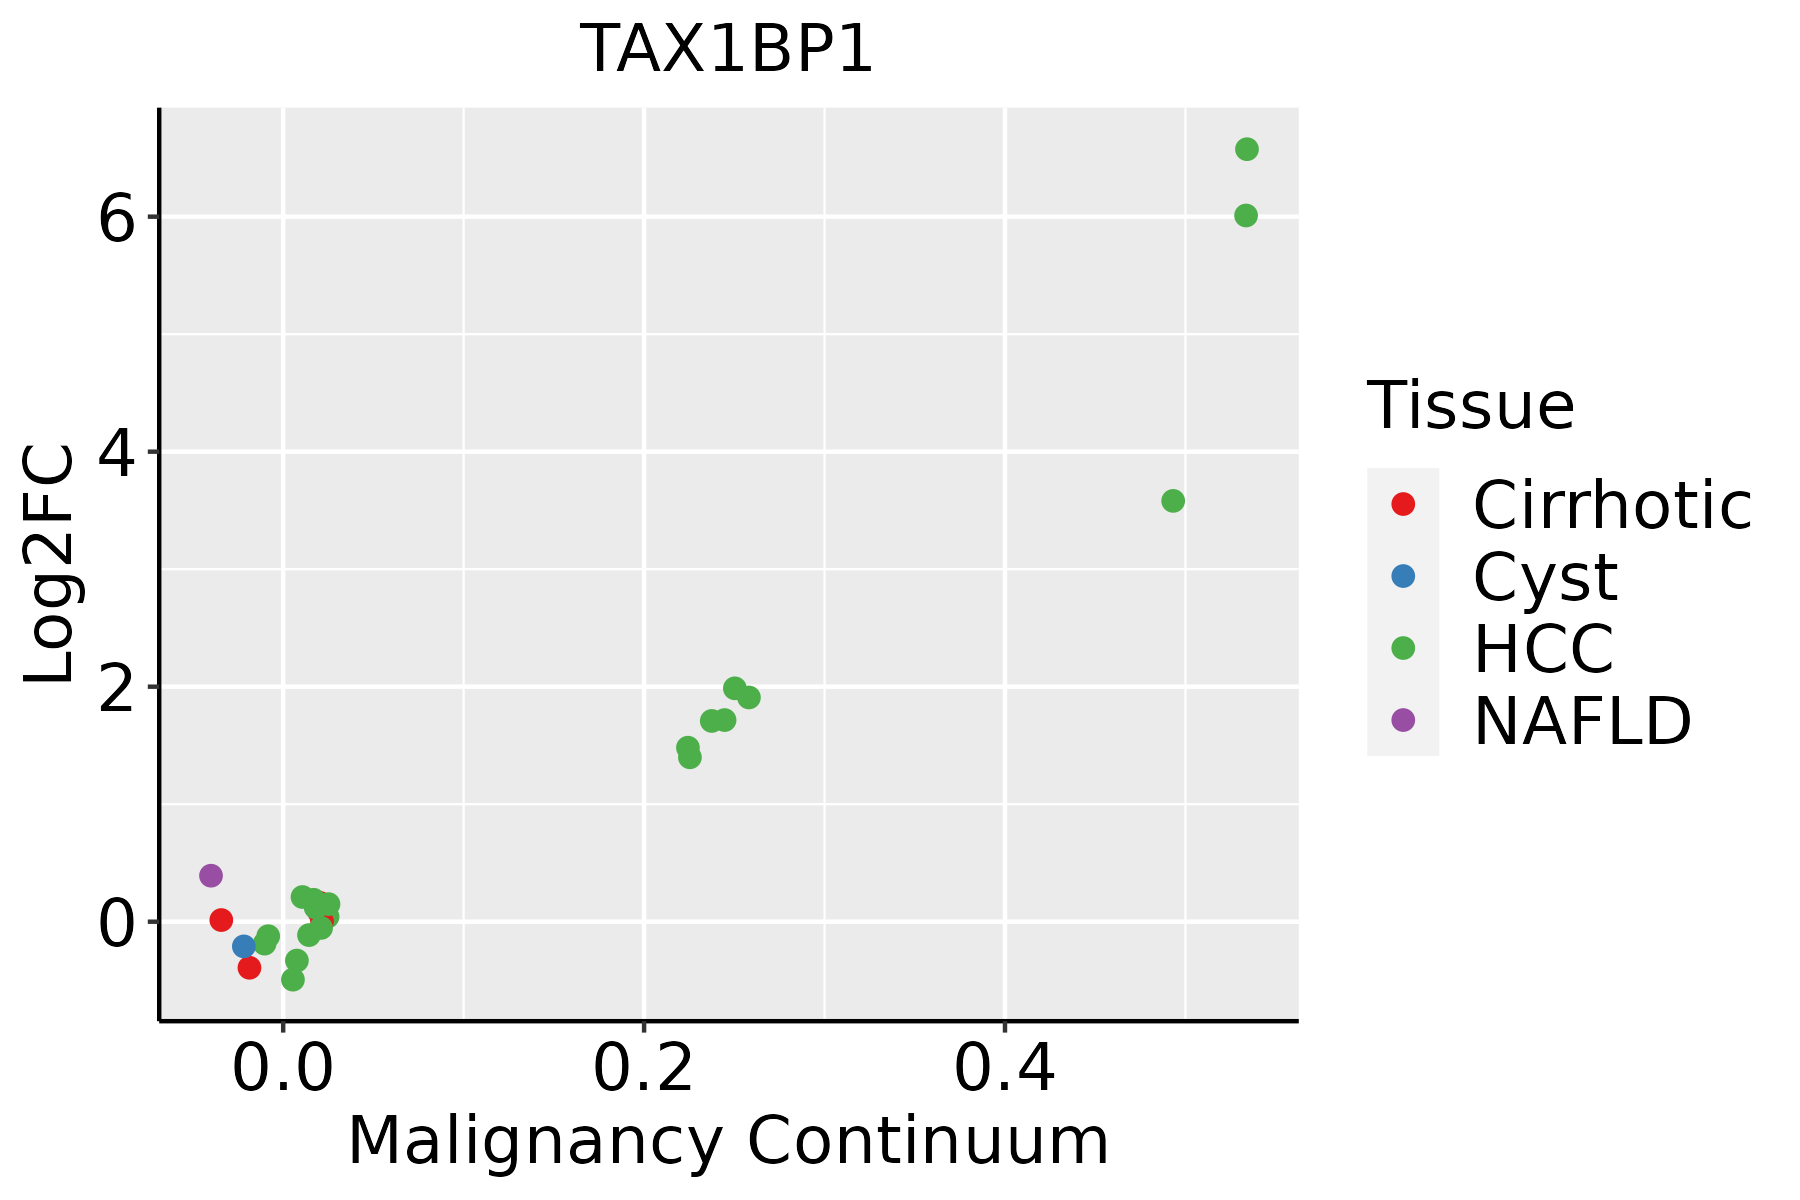 | HCC: Hepatocellular carcinoma |
| NAFLD: Non-alcoholic fatty liver disease | ||
| Lung | 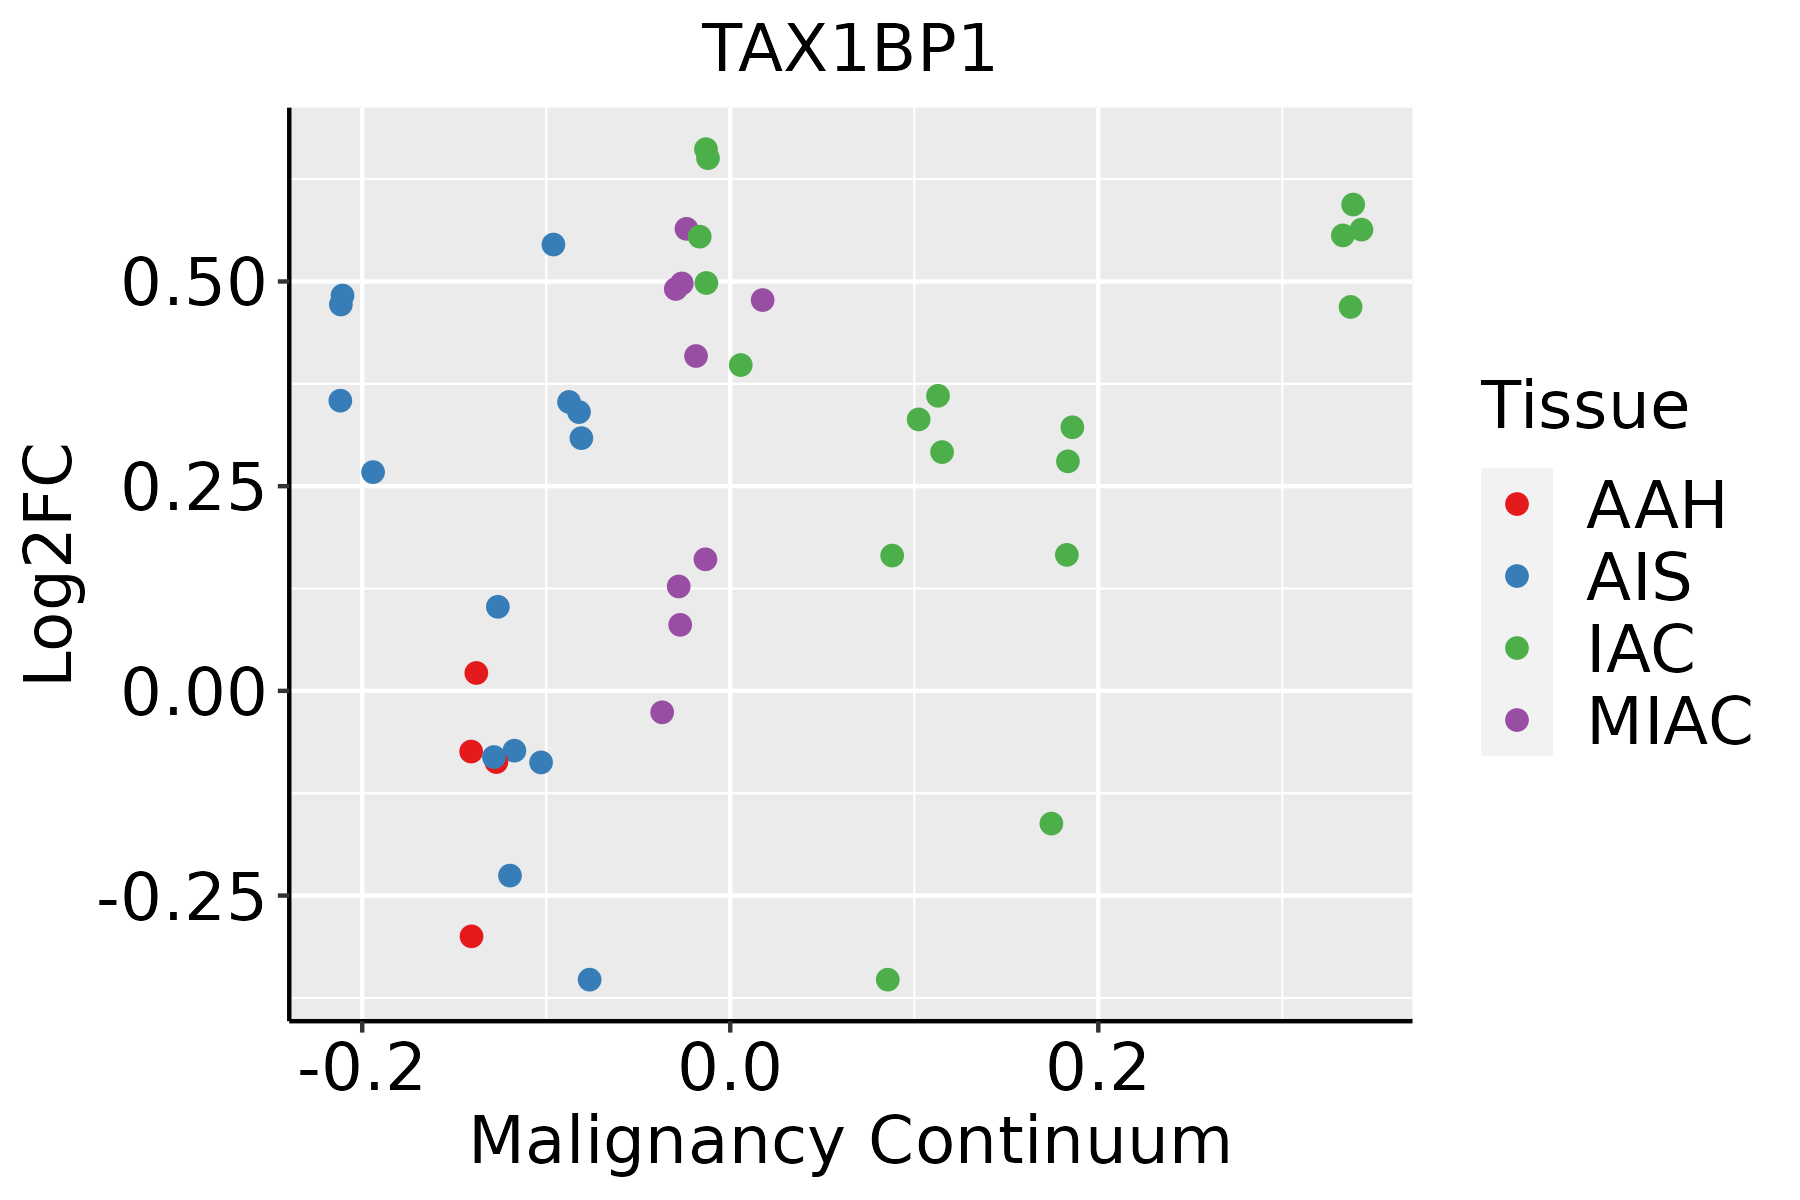 | AAH: Atypical adenomatous hyperplasia |
| AIS: Adenocarcinoma in situ | ||
| IAC: Invasive lung adenocarcinoma | ||
| MIA: Minimally invasive adenocarcinoma | ||
| Oral Cavity | 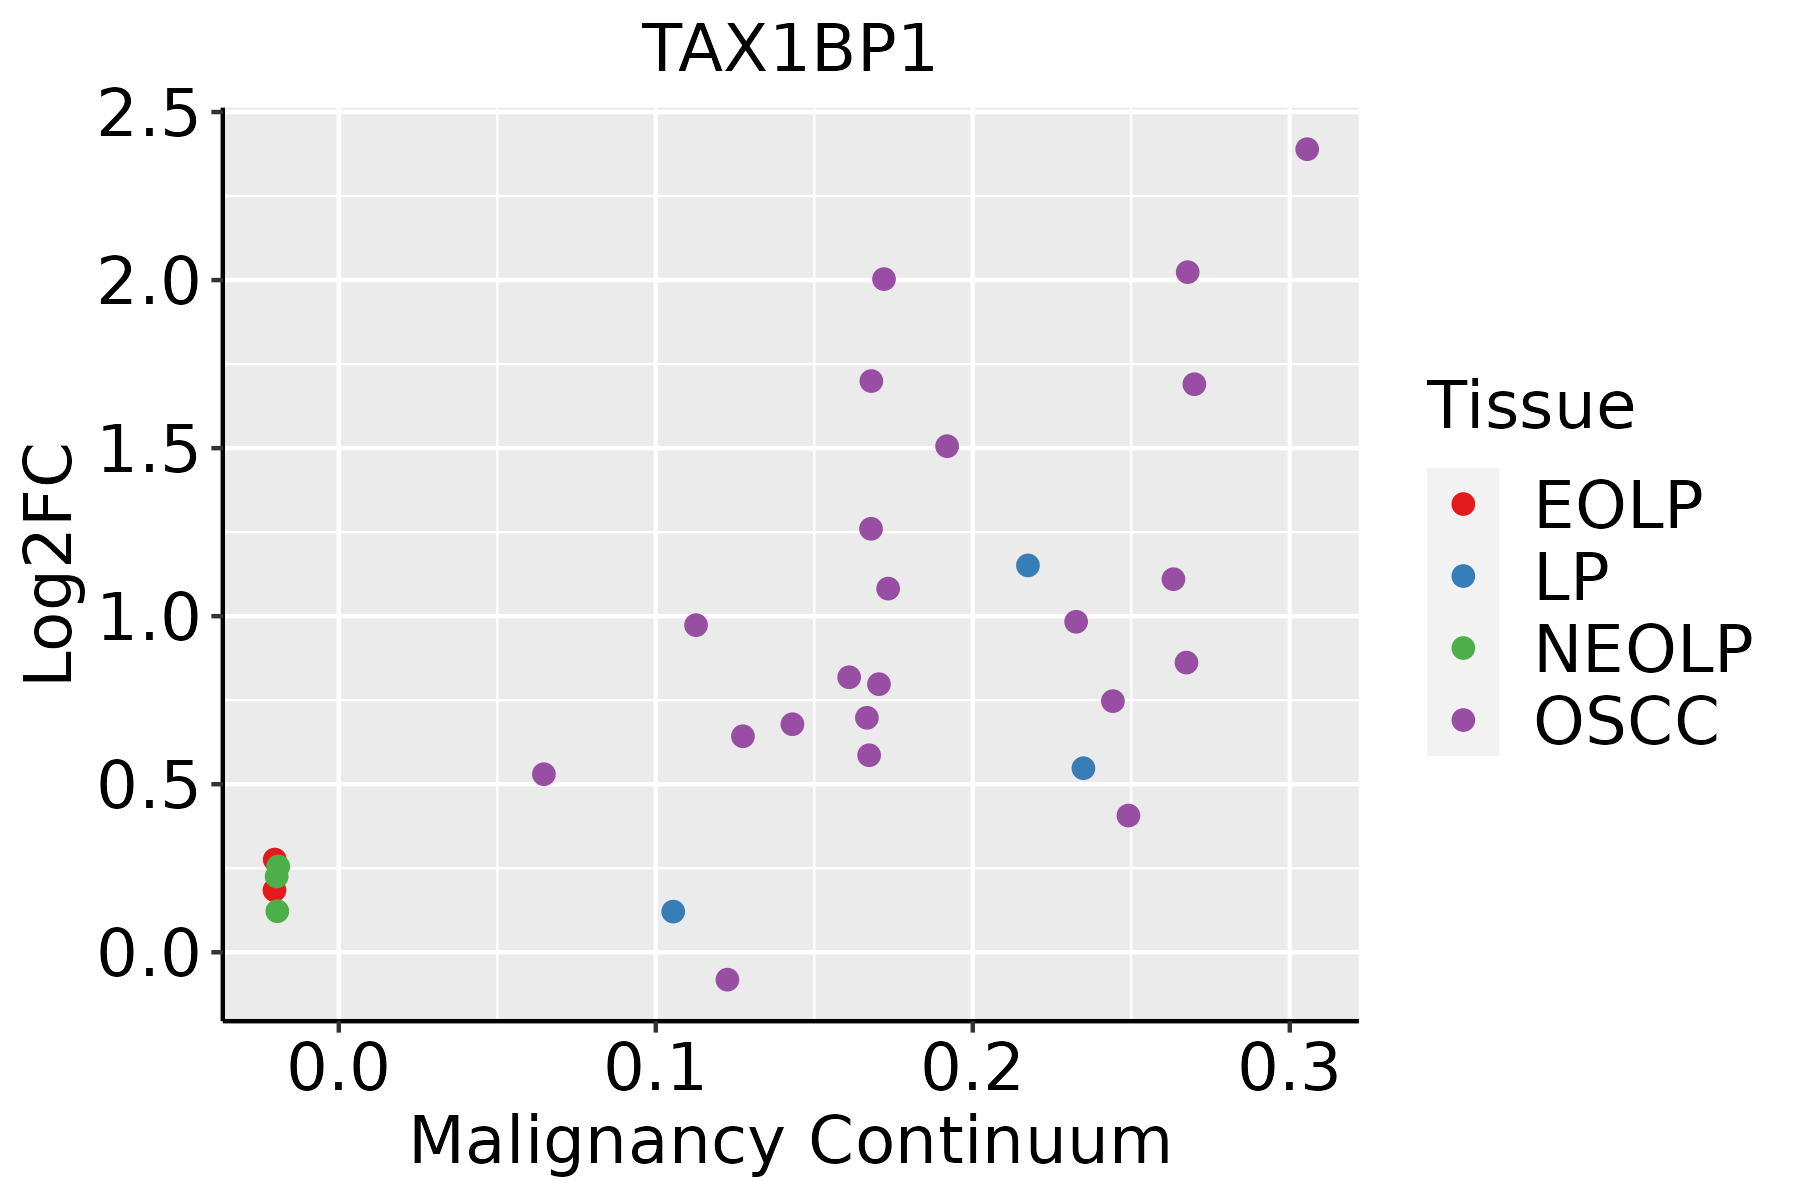 | EOLP: Erosive Oral lichen planus |
| LP: leukoplakia | ||
| NEOLP: Non-erosive oral lichen planus | ||
| OSCC: Oral squamous cell carcinoma | ||
| Prostate | 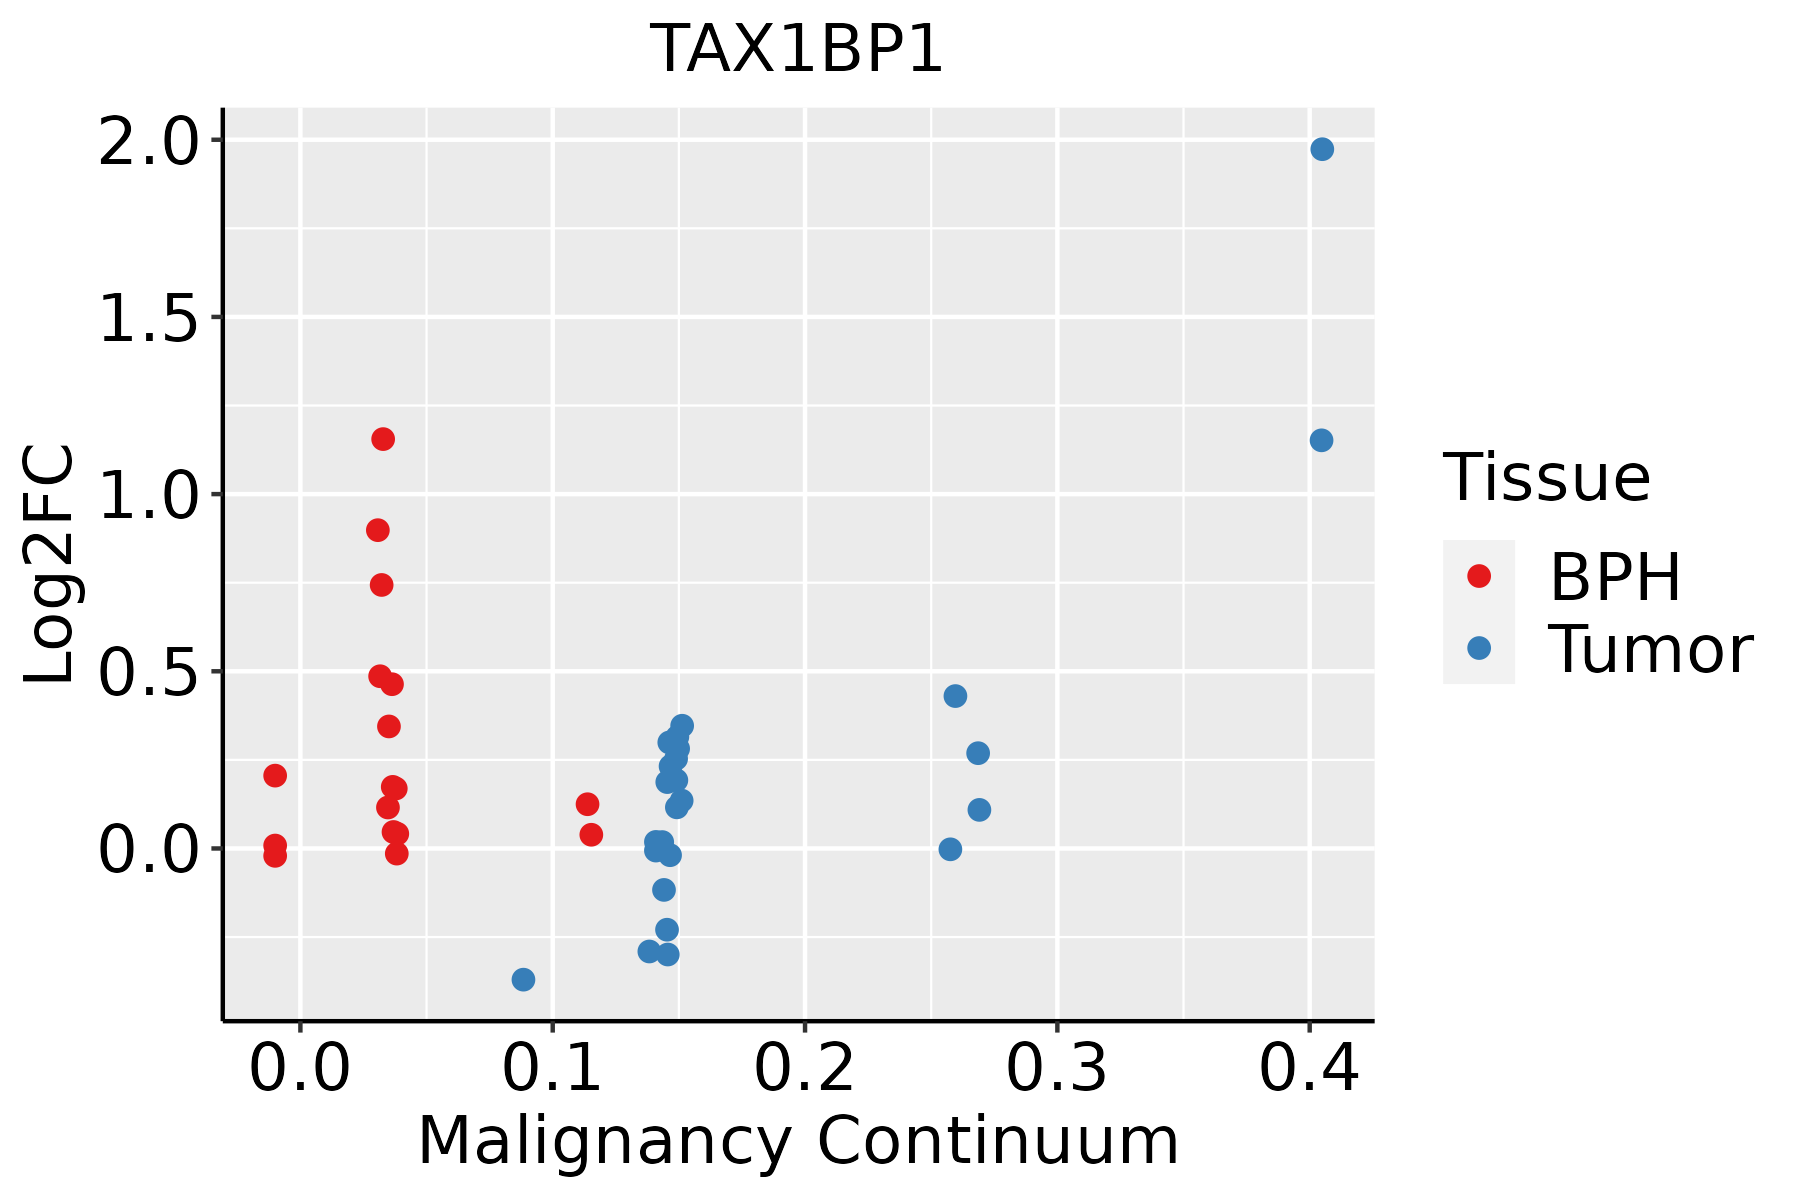 | BPH: Benign Prostatic Hyperplasia |
| Skin |  | AK: Actinic keratosis |
| cSCC: Cutaneous squamous cell carcinoma | ||
| SCCIS:squamous cell carcinoma in situ | ||
| Thyroid | 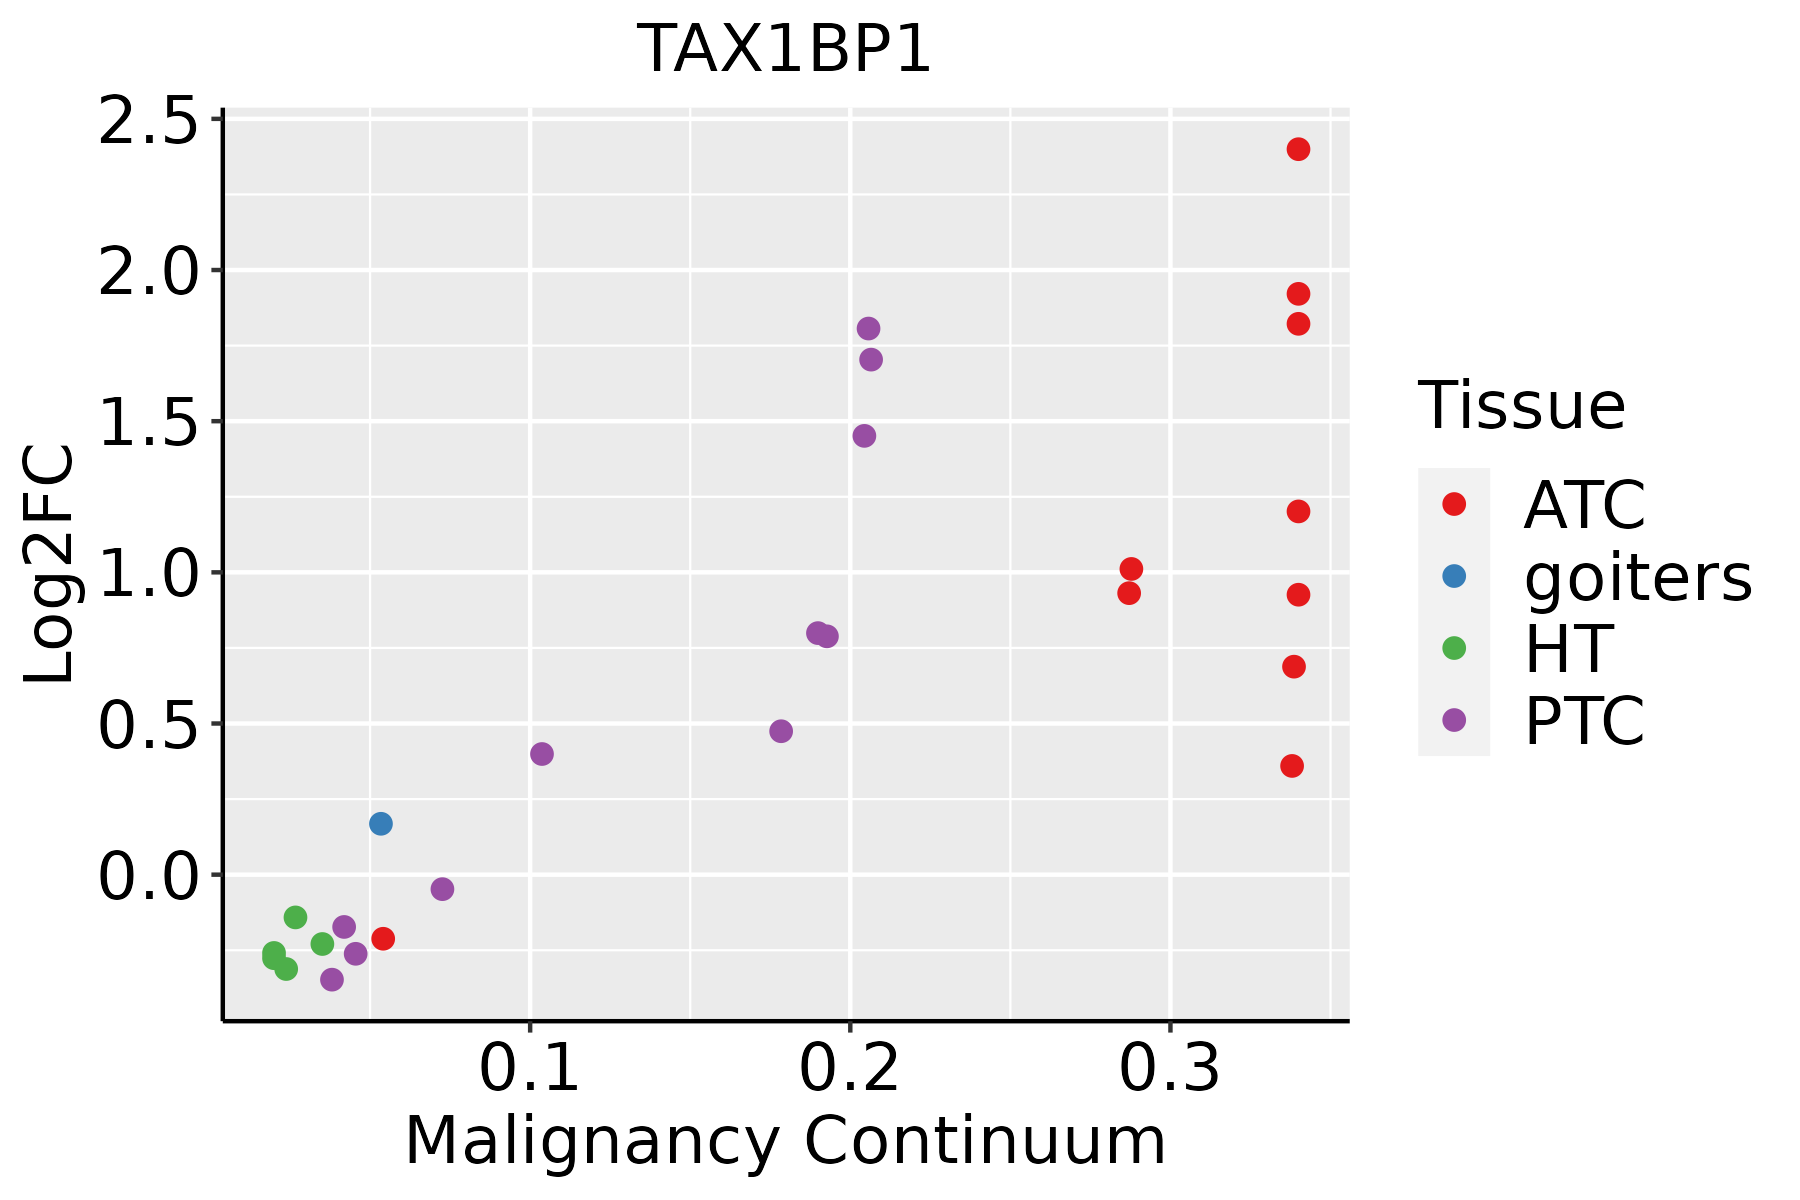 | ATC: Anaplastic thyroid cancer |
| HT: Hashimoto's thyroiditis | ||
| PTC: Papillary thyroid cancer |
| ∗log2FC in expression of this searched gene in stem-like cells from each diseased tissue sample relative to stem-like cells in normal samples in each tissue plotted against the malignancy continuum. Samples are colored based on if they are from different disease stage. |
Top |
Malignant transformation related pathway analysis |
| Find out the enriched GO biological processes and KEGG pathways involved in transition from healthy to precancer to cancer |
| Tissue | Disease Stage | Enriched GO biological Processes |
| Colorectum | AD |  |
| Colorectum | SER |  |
| Colorectum | MSS |  |
| Colorectum | MSI-H |  |
| Colorectum | FAP |  |
| ∗Top 15 enriched GO BP terms are showed in the bar plot of each disease state in each tissue. Each row represents a significant GO biological process which is colored according to the -log10(p.adjust). |
| Page: 1 2 3 4 5 6 7 8 9 |
| GO ID | Tissue | Disease Stage | Description | Gene Ratio | Bg Ratio | pvalue | p.adjust | Count |
| GO:005109022 | Thyroid | ATC | regulation of DNA-binding transcription factor activity | 190/6293 | 440/18723 | 1.49e-05 | 1.39e-04 | 190 |
| GO:00434333 | Thyroid | ATC | negative regulation of DNA-binding transcription factor activity | 79/6293 | 185/18723 | 5.96e-03 | 2.40e-02 | 79 |
| Page: 1 2 |
| Pathway ID | Tissue | Disease Stage | Description | Gene Ratio | Bg Ratio | pvalue | p.adjust | qvalue | Count |
| hsa04137 | Colorectum | AD | Mitophagy - animal | 29/2092 | 72/8465 | 2.49e-03 | 1.35e-02 | 8.59e-03 | 29 |
| hsa041371 | Colorectum | AD | Mitophagy - animal | 29/2092 | 72/8465 | 2.49e-03 | 1.35e-02 | 8.59e-03 | 29 |
| hsa041372 | Colorectum | SER | Mitophagy - animal | 22/1580 | 72/8465 | 9.93e-03 | 4.78e-02 | 3.47e-02 | 22 |
| hsa041373 | Colorectum | SER | Mitophagy - animal | 22/1580 | 72/8465 | 9.93e-03 | 4.78e-02 | 3.47e-02 | 22 |
| hsa041378 | Colorectum | FAP | Mitophagy - animal | 20/1404 | 72/8465 | 1.14e-02 | 3.92e-02 | 2.38e-02 | 20 |
| hsa041379 | Colorectum | FAP | Mitophagy - animal | 20/1404 | 72/8465 | 1.14e-02 | 3.92e-02 | 2.38e-02 | 20 |
| hsa0413710 | Colorectum | CRC | Mitophagy - animal | 17/1091 | 72/8465 | 8.74e-03 | 4.00e-02 | 2.71e-02 | 17 |
| hsa0413711 | Colorectum | CRC | Mitophagy - animal | 17/1091 | 72/8465 | 8.74e-03 | 4.00e-02 | 2.71e-02 | 17 |
| hsa0413730 | Esophagus | HGIN | Mitophagy - animal | 23/1383 | 72/8465 | 7.69e-04 | 7.59e-03 | 6.03e-03 | 23 |
| hsa04137113 | Esophagus | HGIN | Mitophagy - animal | 23/1383 | 72/8465 | 7.69e-04 | 7.59e-03 | 6.03e-03 | 23 |
| hsa04137210 | Esophagus | ESCC | Mitophagy - animal | 54/4205 | 72/8465 | 9.33e-06 | 4.96e-05 | 2.54e-05 | 54 |
| hsa0413738 | Esophagus | ESCC | Mitophagy - animal | 54/4205 | 72/8465 | 9.33e-06 | 4.96e-05 | 2.54e-05 | 54 |
| hsa0413712 | Liver | NAFLD | Mitophagy - animal | 18/1043 | 72/8465 | 2.27e-03 | 2.46e-02 | 1.99e-02 | 18 |
| hsa0413713 | Liver | NAFLD | Mitophagy - animal | 18/1043 | 72/8465 | 2.27e-03 | 2.46e-02 | 1.99e-02 | 18 |
| hsa0413721 | Liver | Cirrhotic | Mitophagy - animal | 39/2530 | 72/8465 | 1.38e-05 | 1.24e-04 | 7.64e-05 | 39 |
| hsa0413731 | Liver | Cirrhotic | Mitophagy - animal | 39/2530 | 72/8465 | 1.38e-05 | 1.24e-04 | 7.64e-05 | 39 |
| hsa0413741 | Liver | HCC | Mitophagy - animal | 53/4020 | 72/8465 | 5.49e-06 | 4.59e-05 | 2.56e-05 | 53 |
| hsa0413751 | Liver | HCC | Mitophagy - animal | 53/4020 | 72/8465 | 5.49e-06 | 4.59e-05 | 2.56e-05 | 53 |
| hsa0413714 | Lung | IAC | Mitophagy - animal | 19/1053 | 72/8465 | 9.72e-04 | 7.32e-03 | 4.86e-03 | 19 |
| hsa0413715 | Lung | IAC | Mitophagy - animal | 19/1053 | 72/8465 | 9.72e-04 | 7.32e-03 | 4.86e-03 | 19 |
| Page: 1 2 |
Top |
Cell-cell communication analysis |
| Identification of potential cell-cell interactions between two cell types and their ligand-receptor pairs for different disease states |
| Ligand | Receptor | LRpair | Pathway | Tissue | Disease Stage |
| Page: 1 |
Top |
Single-cell gene regulatory network inference analysis |
| Find out the significant the regulons (TFs) and the target genes of each regulon across cell types for different disease states |
| TF | Cell Type | Tissue | Disease Stage | Target Gene | RSS | Regulon Activity |
| ∗The dot plots of a searched regulon are shown for all cell subpopulations in each disease state of each tissue based on the regulon specific score inferred using pySCENIC and by calculating the average expression. |
| Page: 1 |
Top |
Somatic mutation of malignant transformation related genes |
| Annotation of somatic variants for genes involved in malignant transformation |
| Hugo Symbol | Variant Class | Variant Classification | dbSNP RS | HGVSc | HGVSp | HGVSp Short | SWISSPROT | BIOTYPE | SIFT | PolyPhen | Tumor Sample Barcode | Tissue | Histology | Sex | Age | Stage | Therapy Types | Drugs | Outcome |
| TAX1BP1 | SNV | Missense_Mutation | c.923N>T | p.Asp308Val | p.D308V | Q86VP1 | protein_coding | deleterious(0) | probably_damaging(0.985) | TCGA-AN-A0AK-01 | Breast | breast invasive carcinoma | Female | >=65 | I/II | Unknown | Unknown | SD | |
| TAX1BP1 | SNV | Missense_Mutation | c.1448N>T | p.Asn483Ile | p.N483I | Q86VP1 | protein_coding | tolerated(0.06) | benign(0.089) | TCGA-AR-A1AR-01 | Breast | breast invasive carcinoma | Female | <65 | III/IV | Unspecific | Docetaxel | PD | |
| TAX1BP1 | SNV | Missense_Mutation | c.1997C>G | p.Ser666Cys | p.S666C | Q86VP1 | protein_coding | deleterious(0.01) | benign(0.443) | TCGA-BH-A0BP-01 | Breast | breast invasive carcinoma | Female | >=65 | I/II | Unknown | Unknown | SD | |
| TAX1BP1 | insertion | Frame_Shift_Ins | novel | c.1139_1140insTCTTTATCTCCCTT | p.Val381LeufsTer26 | p.V381Lfs*26 | Q86VP1 | protein_coding | TCGA-AN-A03X-01 | Breast | breast invasive carcinoma | Female | >=65 | I/II | Unknown | Unknown | SD | ||
| TAX1BP1 | insertion | In_Frame_Ins | novel | c.1141_1142insCCCCAATTTTTATGATTGTTT | p.Val381delinsAlaProIlePheMetIleValPhe | p.V381delinsAPIFMIVF | Q86VP1 | protein_coding | TCGA-AN-A03X-01 | Breast | breast invasive carcinoma | Female | >=65 | I/II | Unknown | Unknown | SD | ||
| TAX1BP1 | insertion | Frame_Shift_Ins | novel | c.2362_2363insCAATTTTACAATTAGA | p.Phe788SerfsTer7 | p.F788Sfs*7 | Q86VP1 | protein_coding | TCGA-AR-A0U2-01 | Breast | breast invasive carcinoma | Female | <65 | III/IV | Hormone Therapy | tamoxiphen | PD | ||
| TAX1BP1 | deletion | Frame_Shift_Del | novel | c.1320delN | p.Arg441ValfsTer23 | p.R441Vfs*23 | Q86VP1 | protein_coding | TCGA-D8-A27V-01 | Breast | breast invasive carcinoma | Female | <65 | I/II | Hormone Therapy | tamoxiphen | SD | ||
| TAX1BP1 | SNV | Missense_Mutation | c.1982N>A | p.Pro661His | p.P661H | Q86VP1 | protein_coding | deleterious(0) | probably_damaging(0.99) | TCGA-AA-3864-01 | Colorectum | colon adenocarcinoma | Male | >=65 | I/II | Unknown | Unknown | SD | |
| TAX1BP1 | SNV | Missense_Mutation | novel | c.1288G>A | p.Glu430Lys | p.E430K | Q86VP1 | protein_coding | deleterious(0.02) | probably_damaging(0.955) | TCGA-AA-3984-01 | Colorectum | colon adenocarcinoma | Female | <65 | I/II | Unknown | Unknown | SD |
| TAX1BP1 | SNV | Missense_Mutation | novel | c.1288N>A | p.Glu430Lys | p.E430K | Q86VP1 | protein_coding | deleterious(0.02) | probably_damaging(0.955) | TCGA-AZ-4315-01 | Colorectum | colon adenocarcinoma | Male | <65 | I/II | Unknown | Unknown | SD |
| Page: 1 2 3 4 5 6 7 8 |
Top |
Related drugs of malignant transformation related genes |
| Identification of chemicals and drugs interact with genes involved in malignant transfromation |
| (DGIdb 4.0) |
| Entrez ID | Symbol | Category | Interaction Types | Drug Claim Name | Drug Name | PMIDs |
| Page: 1 |

Copyright 2023-Present -The University of Texas Health Science Center at Houston |