| Tissue | Expression Dynamics | Abbreviation |
| Cervix | 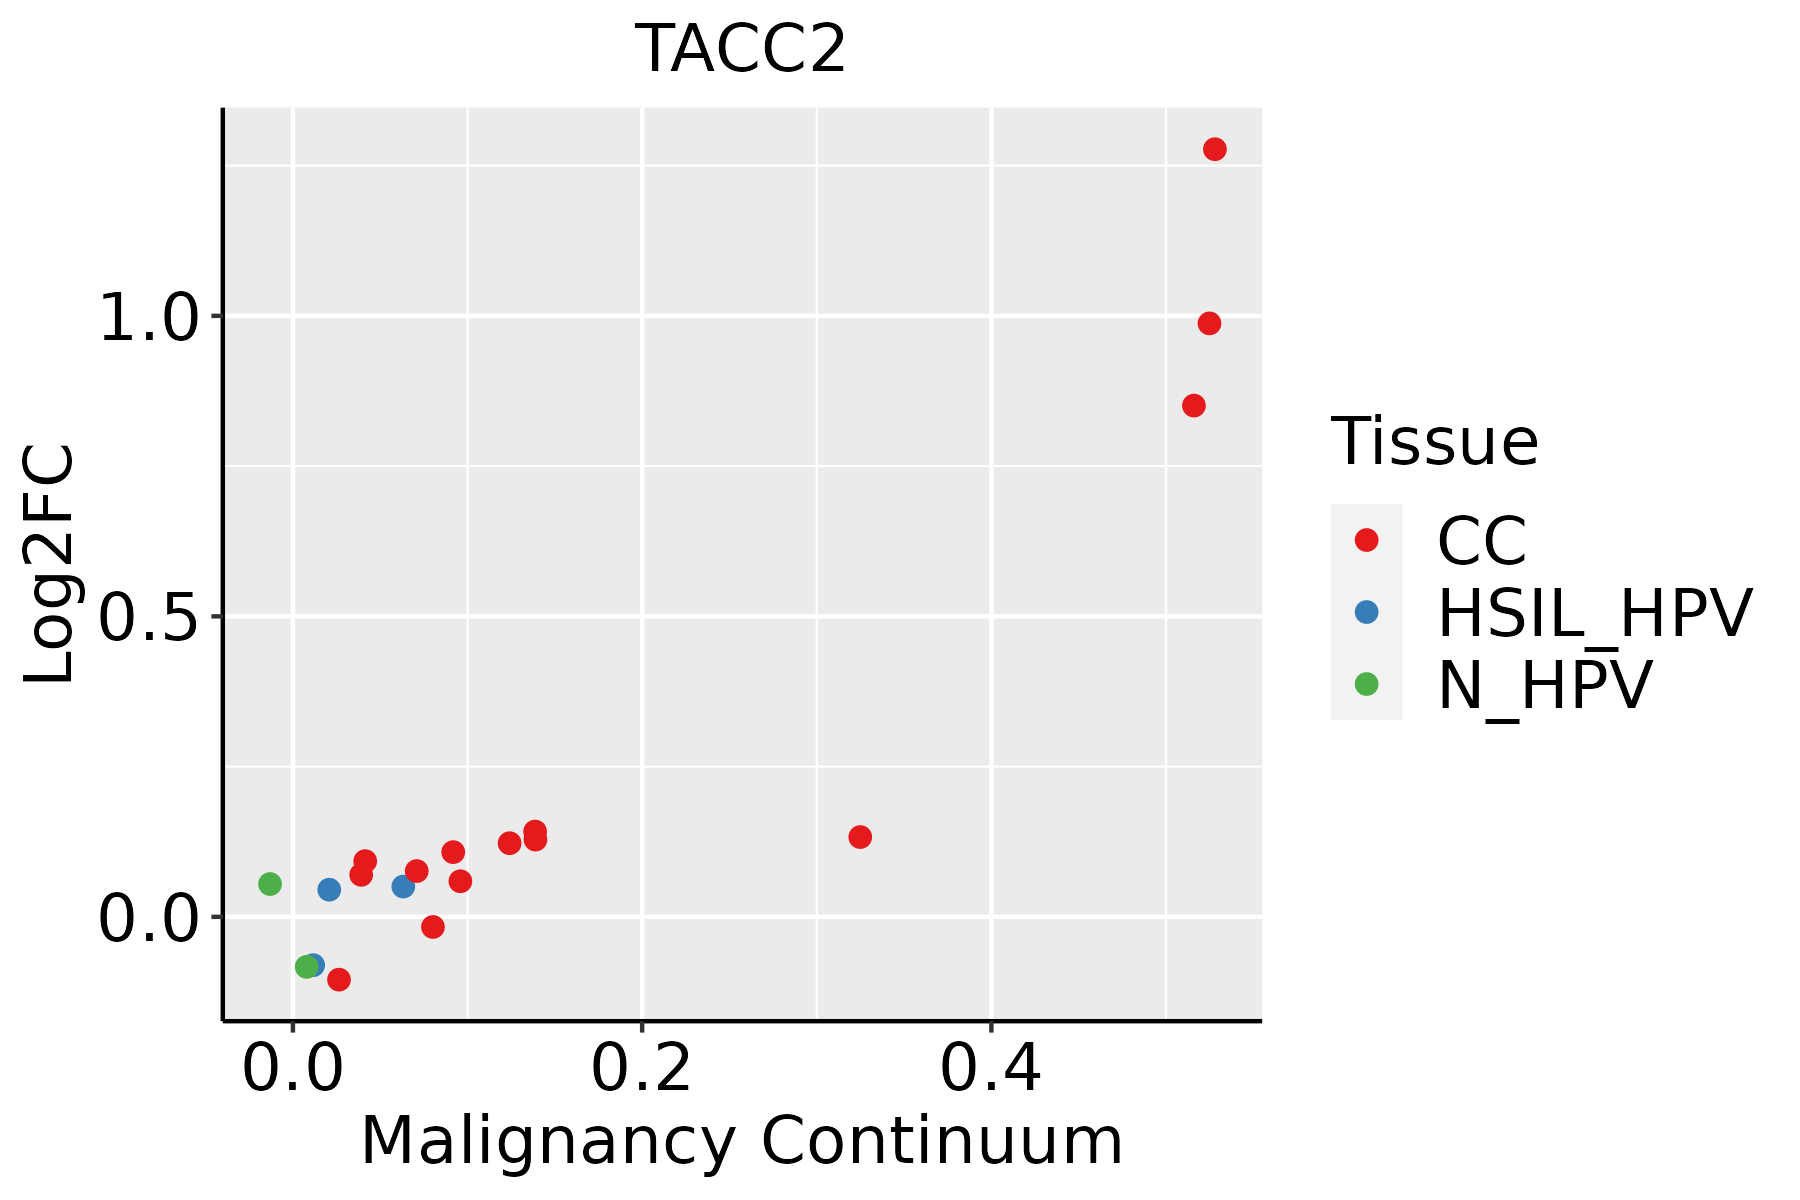 | CC: Cervix cancer |
| HSIL_HPV: HPV-infected high-grade squamous intraepithelial lesions |
| N_HPV: HPV-infected normal cervix |
| Colorectum (GSE201348) |  | FAP: Familial adenomatous polyposis |
| CRC: Colorectal cancer |
| Colorectum (HTA11) |  | AD: Adenomas |
| SER: Sessile serrated lesions |
| MSI-H: Microsatellite-high colorectal cancer |
| MSS: Microsatellite stable colorectal cancer |
| Endometrium | 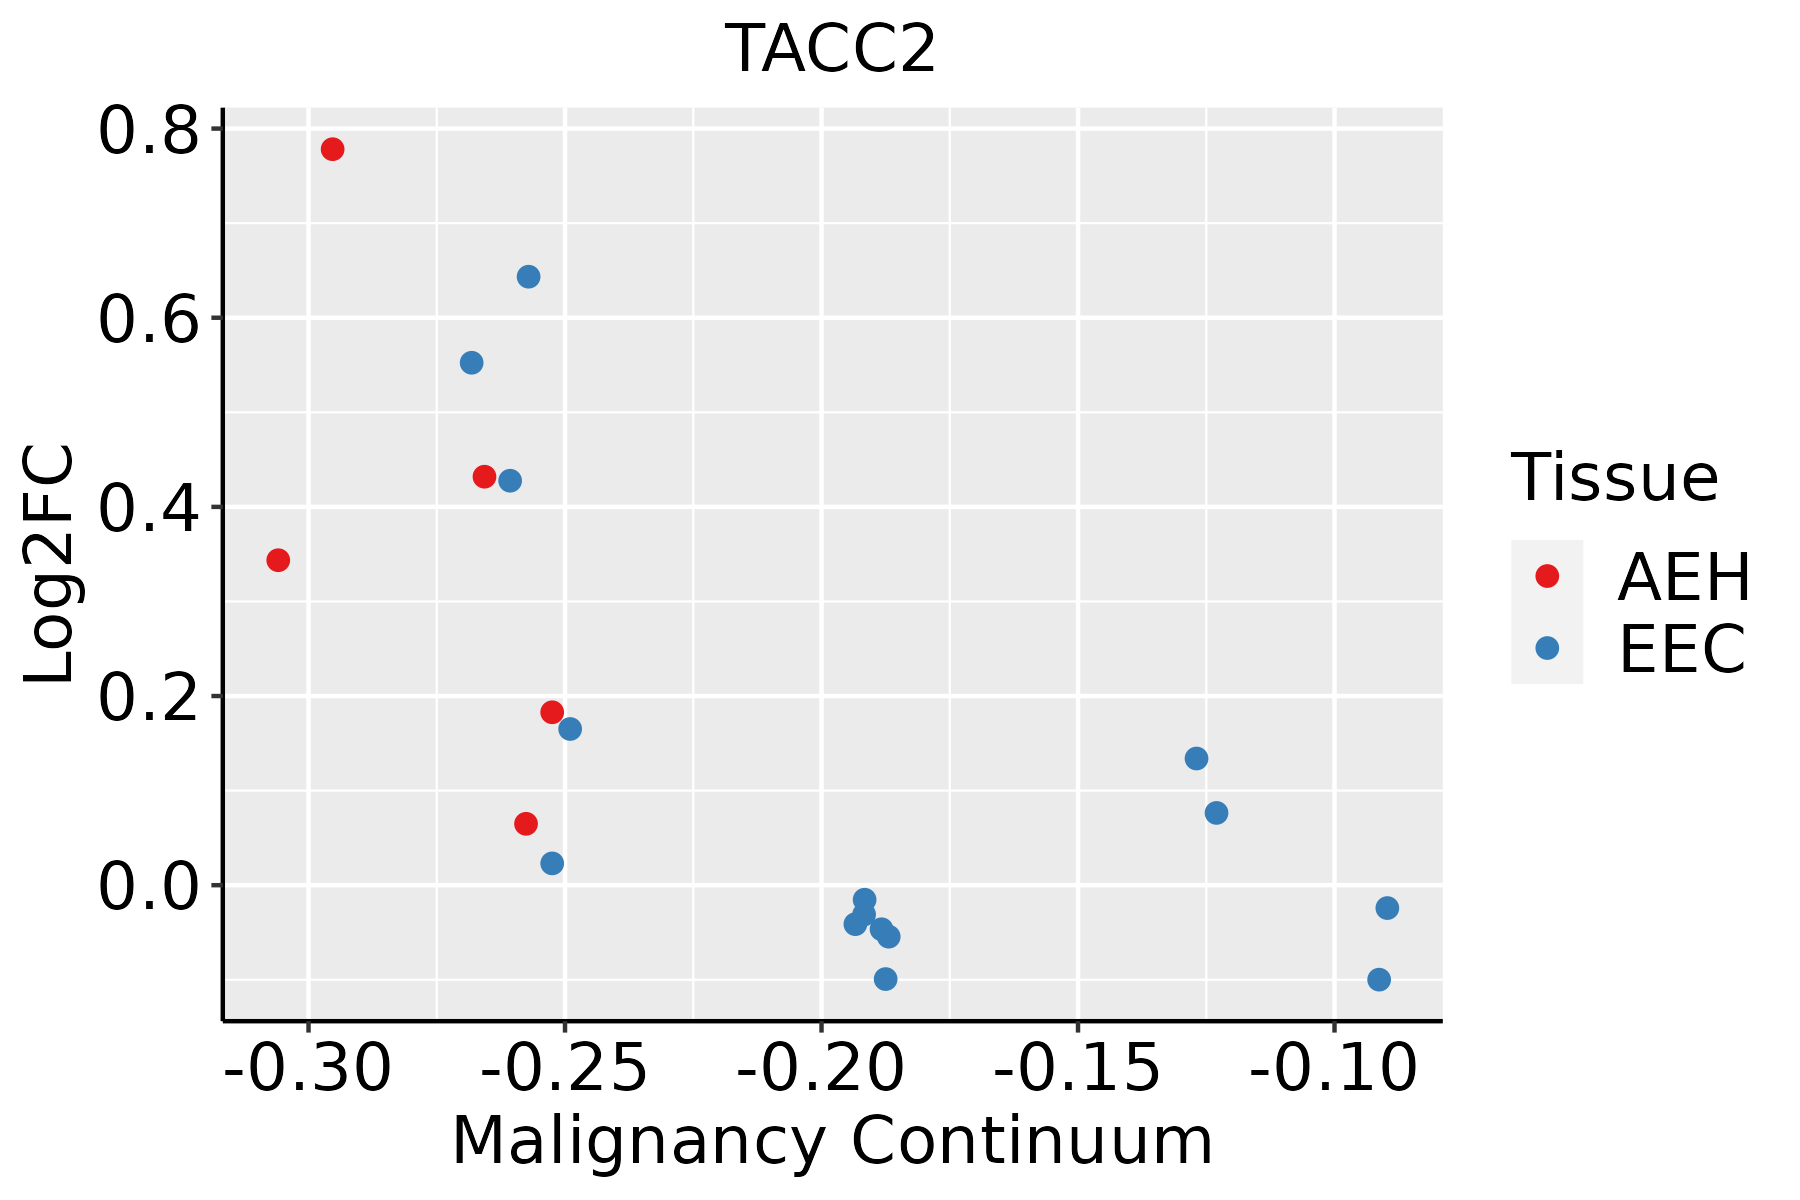 | AEH: Atypical endometrial hyperplasia |
| EEC: Endometrioid Cancer |
| Esophagus | 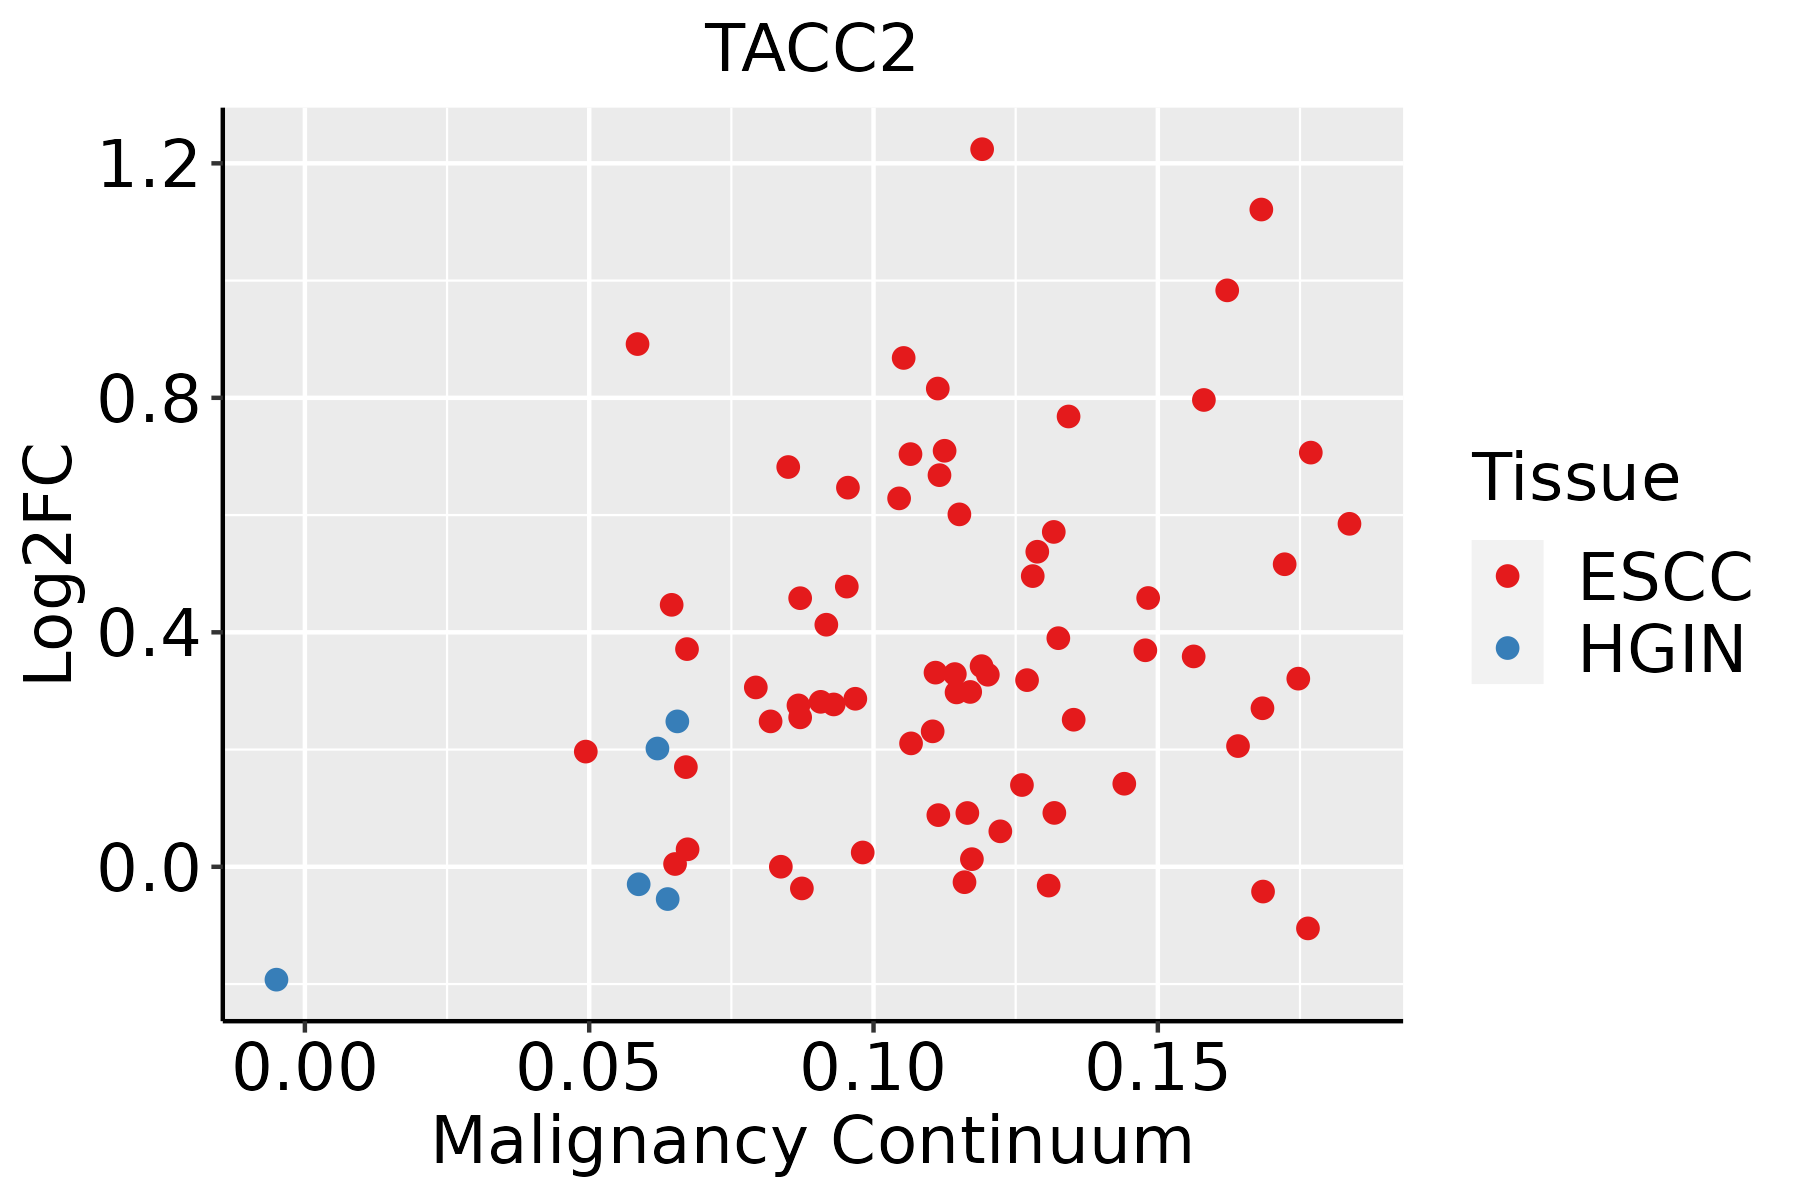 | ESCC: Esophageal squamous cell carcinoma |
| HGIN: High-grade intraepithelial neoplasias |
| LGIN: Low-grade intraepithelial neoplasias |
| Liver | 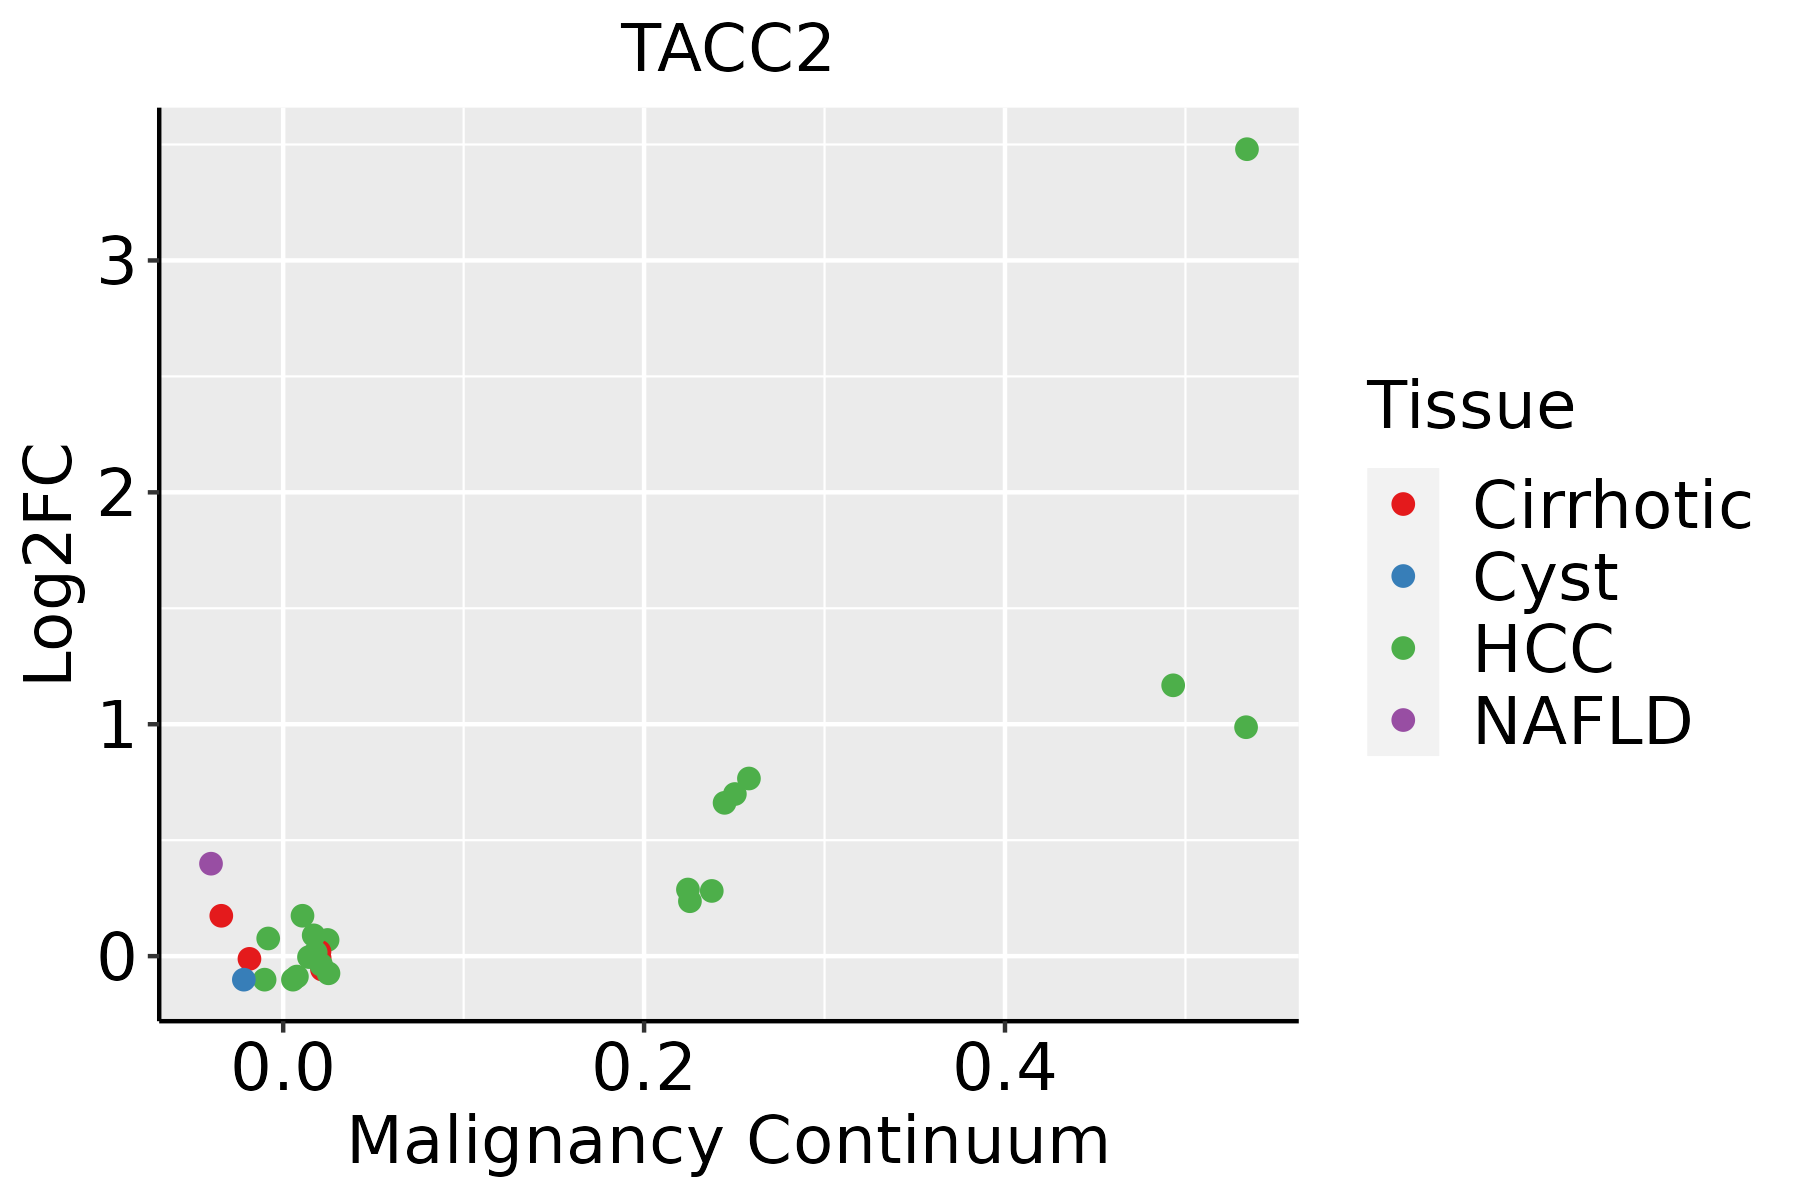 | HCC: Hepatocellular carcinoma |
| NAFLD: Non-alcoholic fatty liver disease |
| Lung | 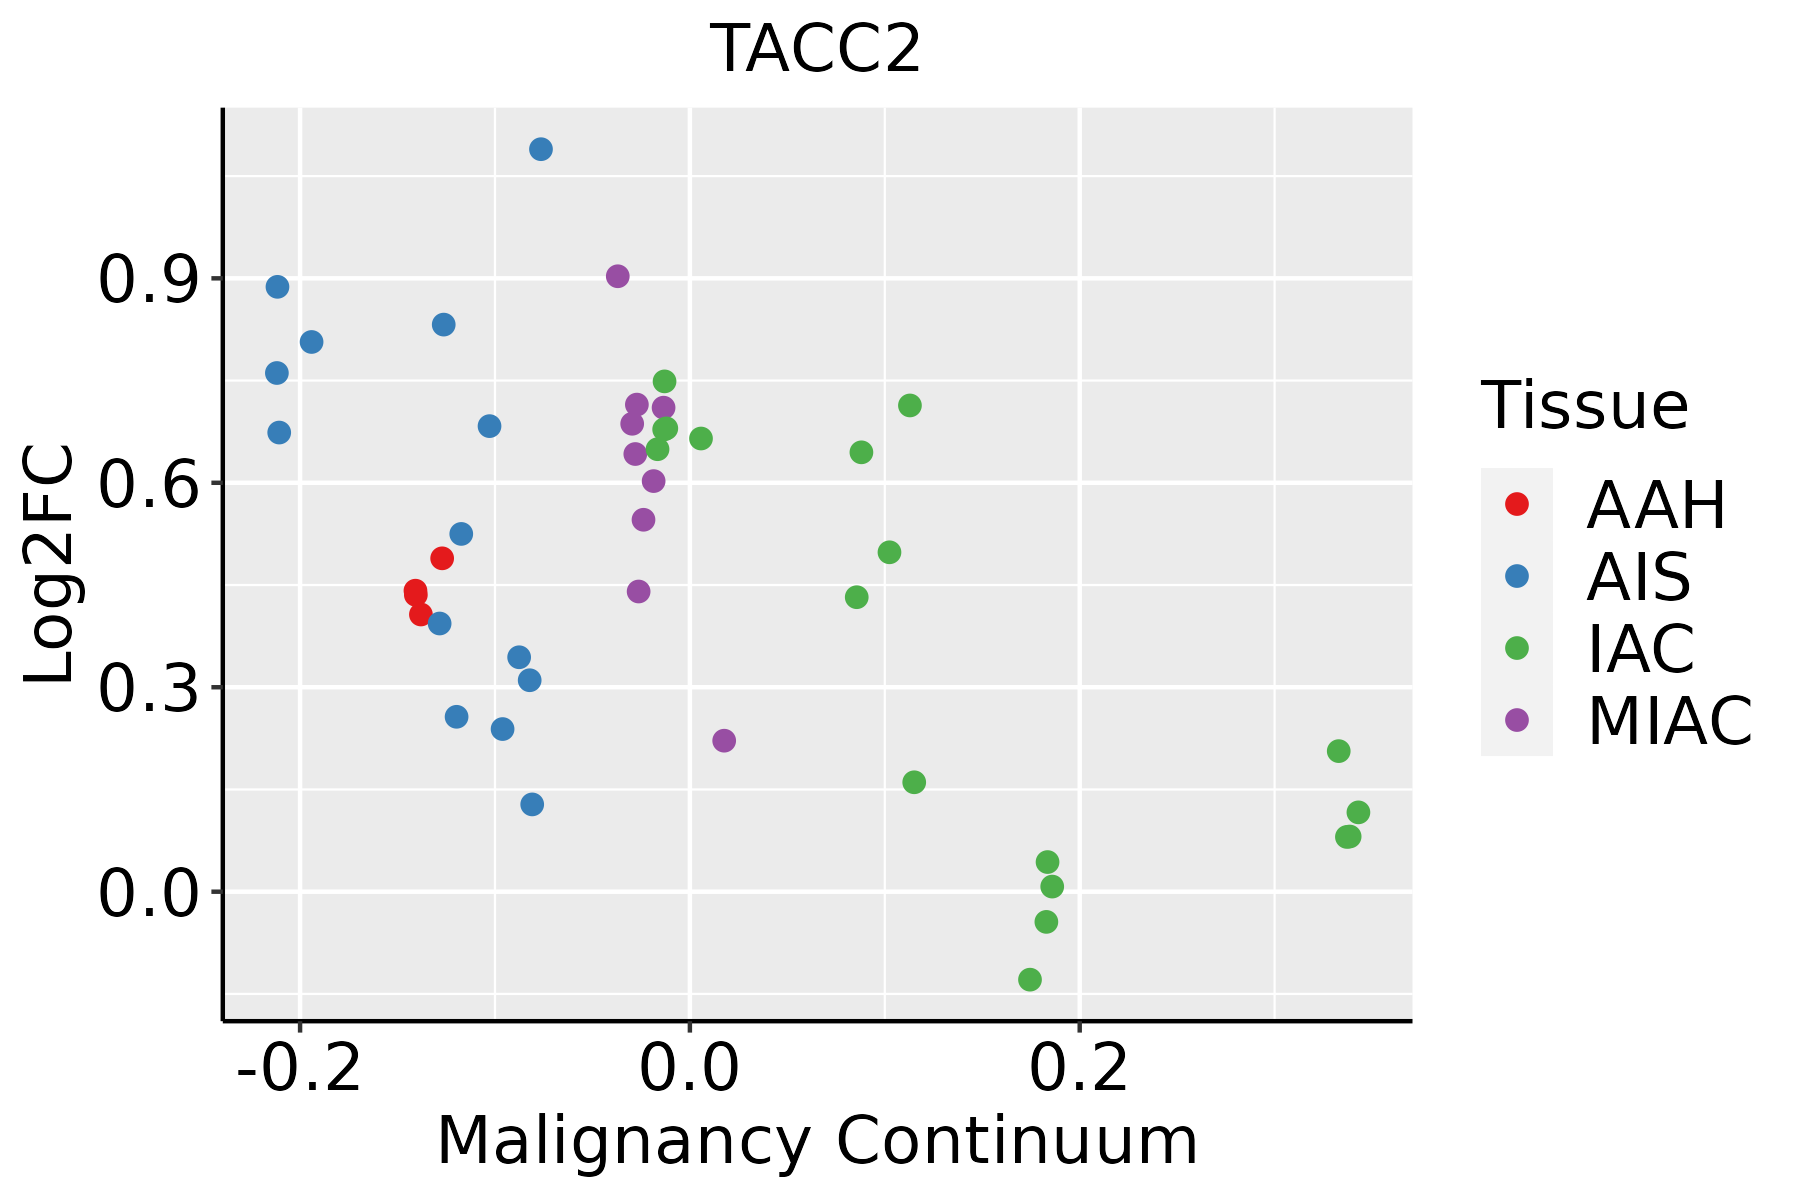 | AAH: Atypical adenomatous hyperplasia |
| AIS: Adenocarcinoma in situ |
| IAC: Invasive lung adenocarcinoma |
| MIA: Minimally invasive adenocarcinoma |
| Oral Cavity | 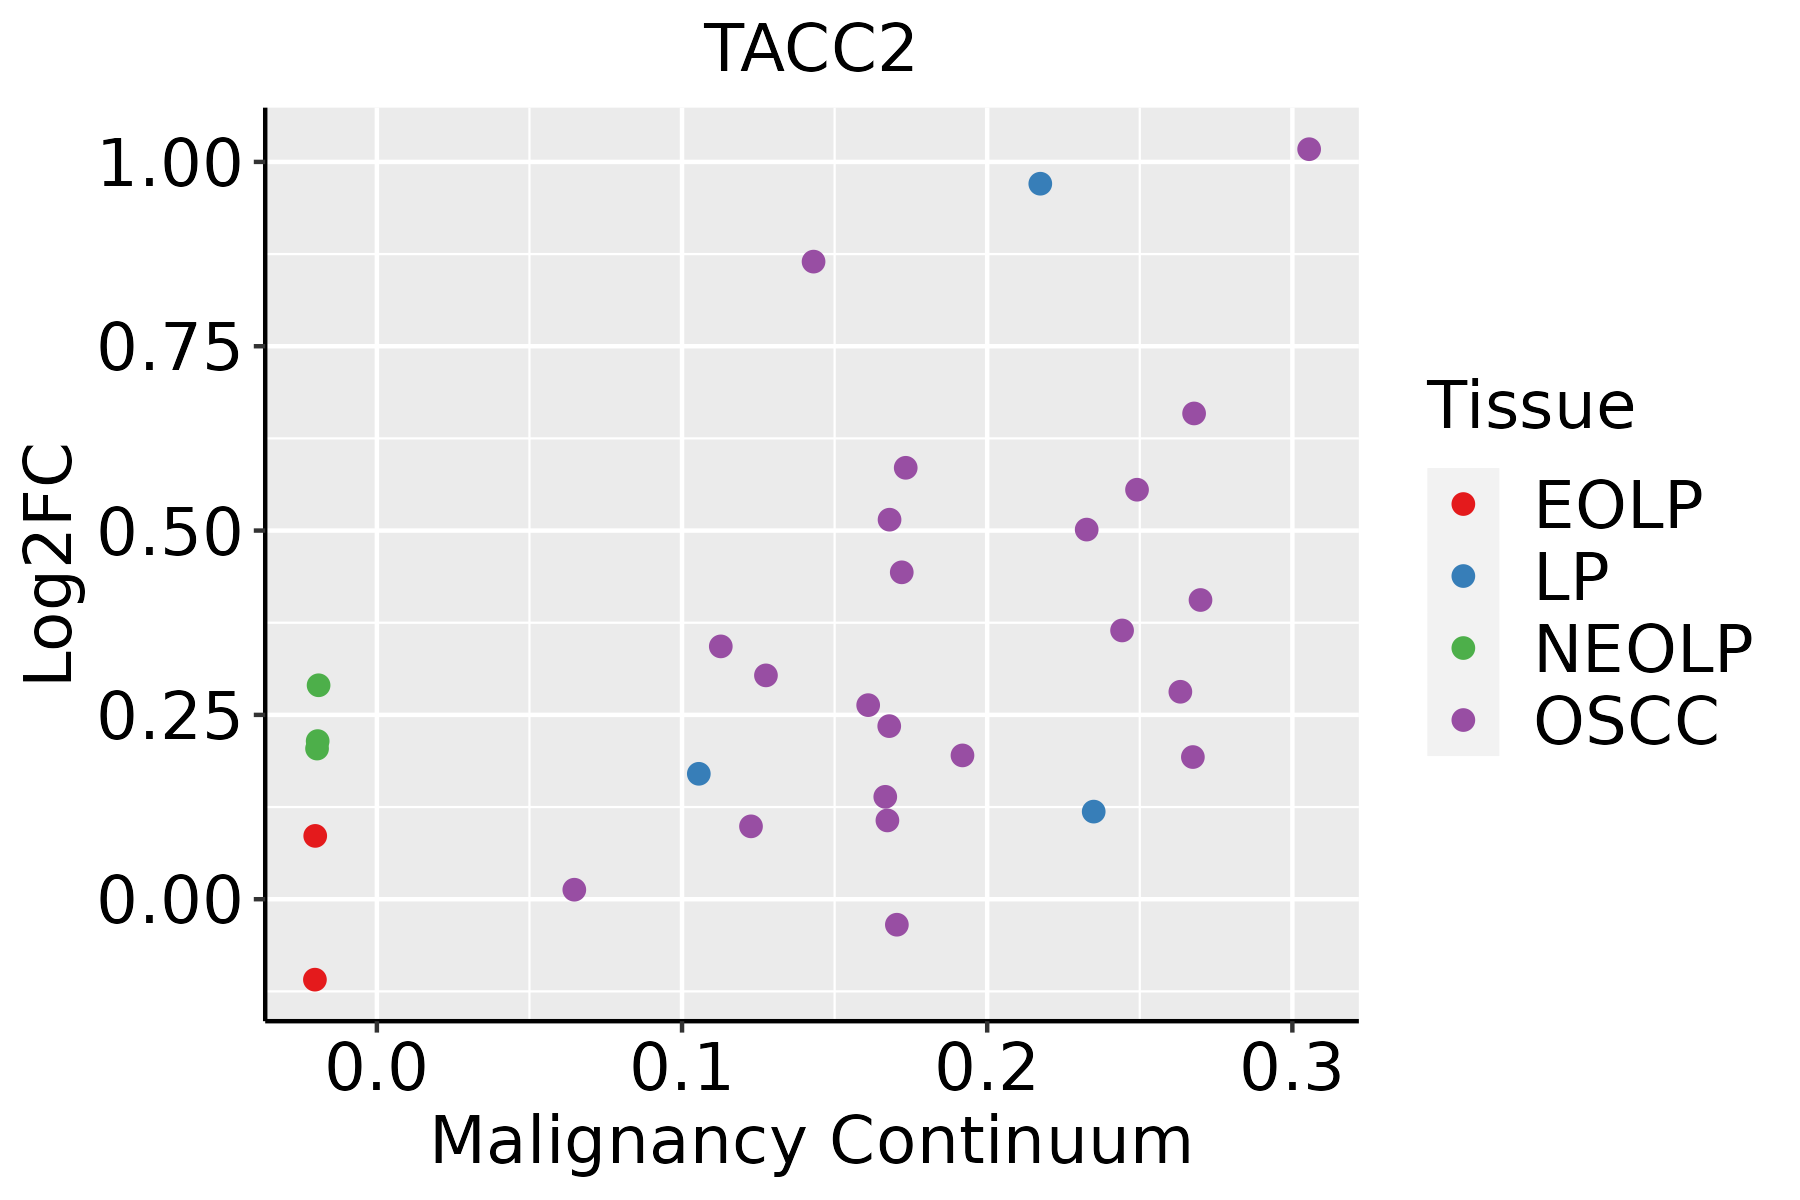 | EOLP: Erosive Oral lichen planus |
| LP: leukoplakia |
| NEOLP: Non-erosive oral lichen planus |
| OSCC: Oral squamous cell carcinoma |
| Skin | 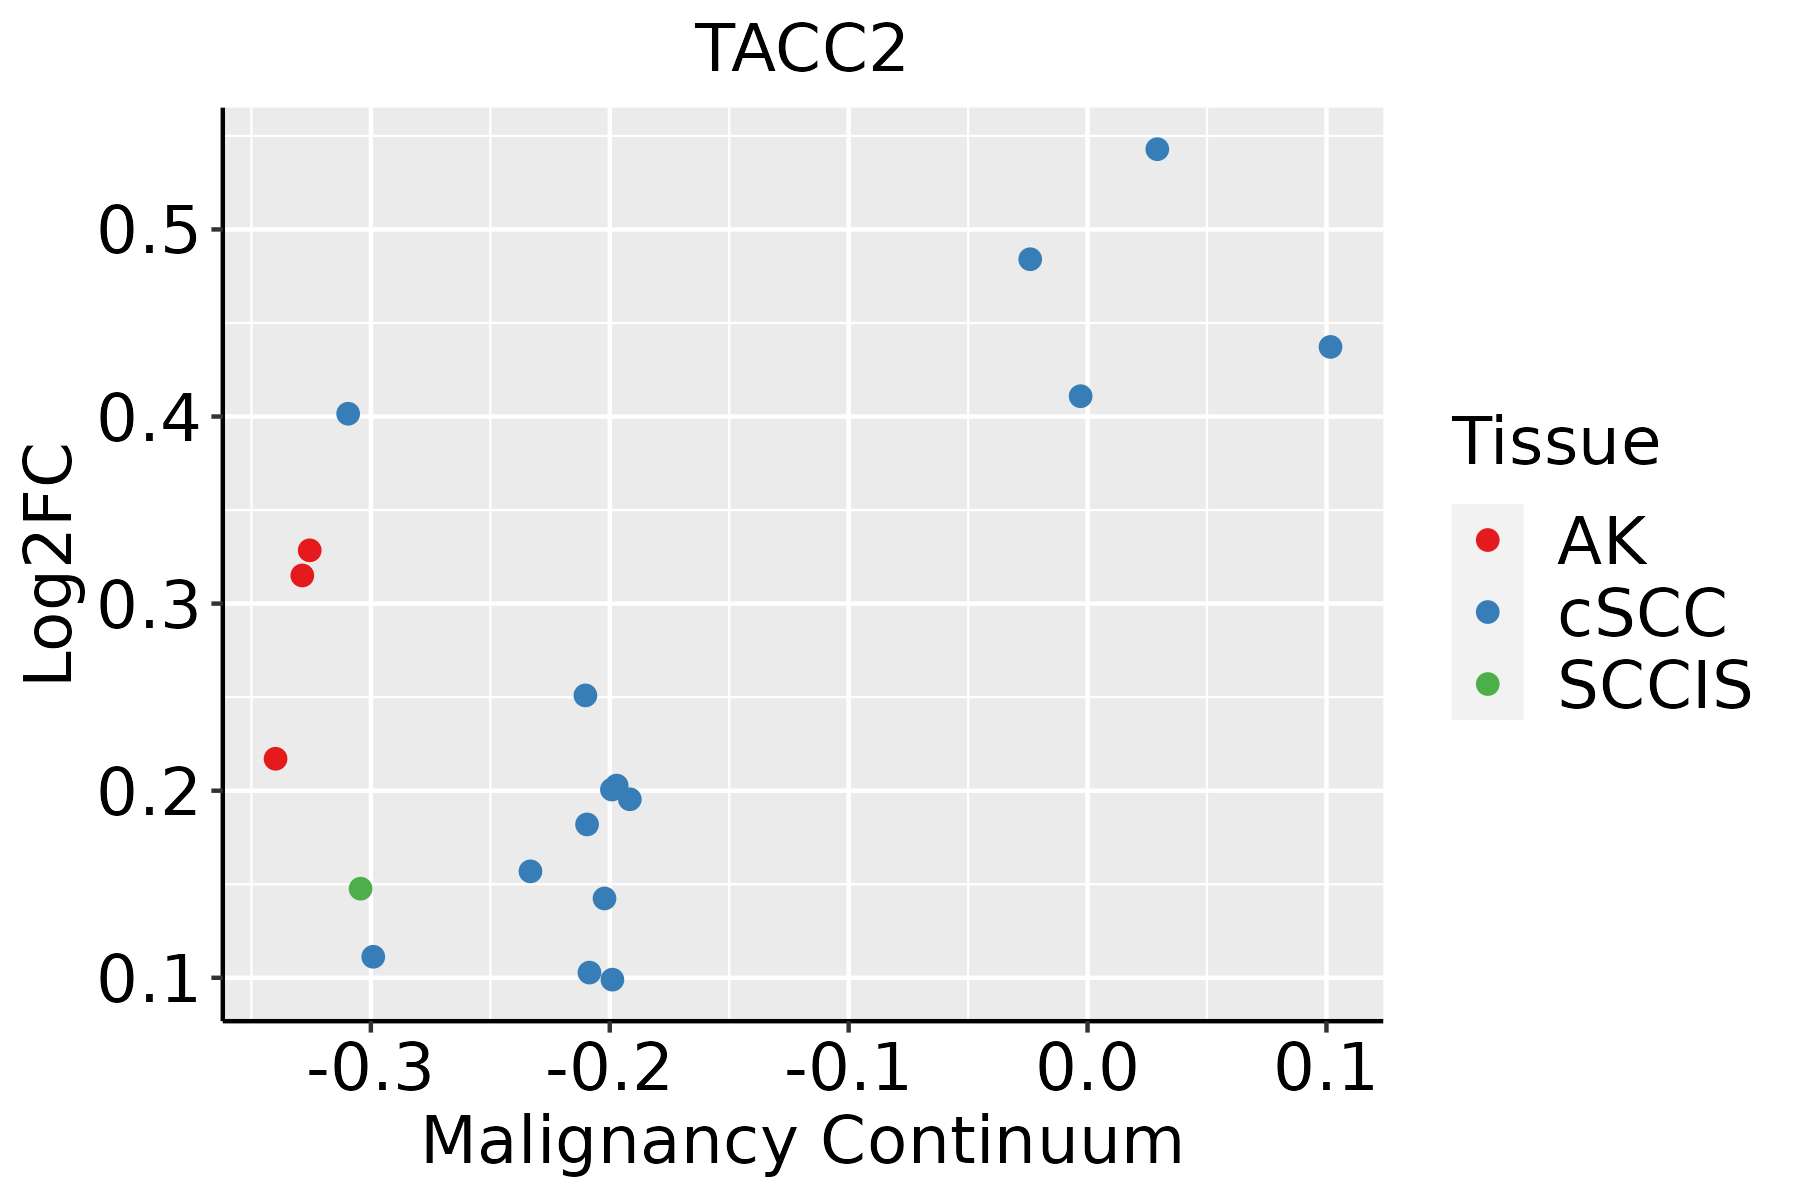 | AK: Actinic keratosis |
| cSCC: Cutaneous squamous cell carcinoma |
| SCCIS:squamous cell carcinoma in situ |
| Thyroid | 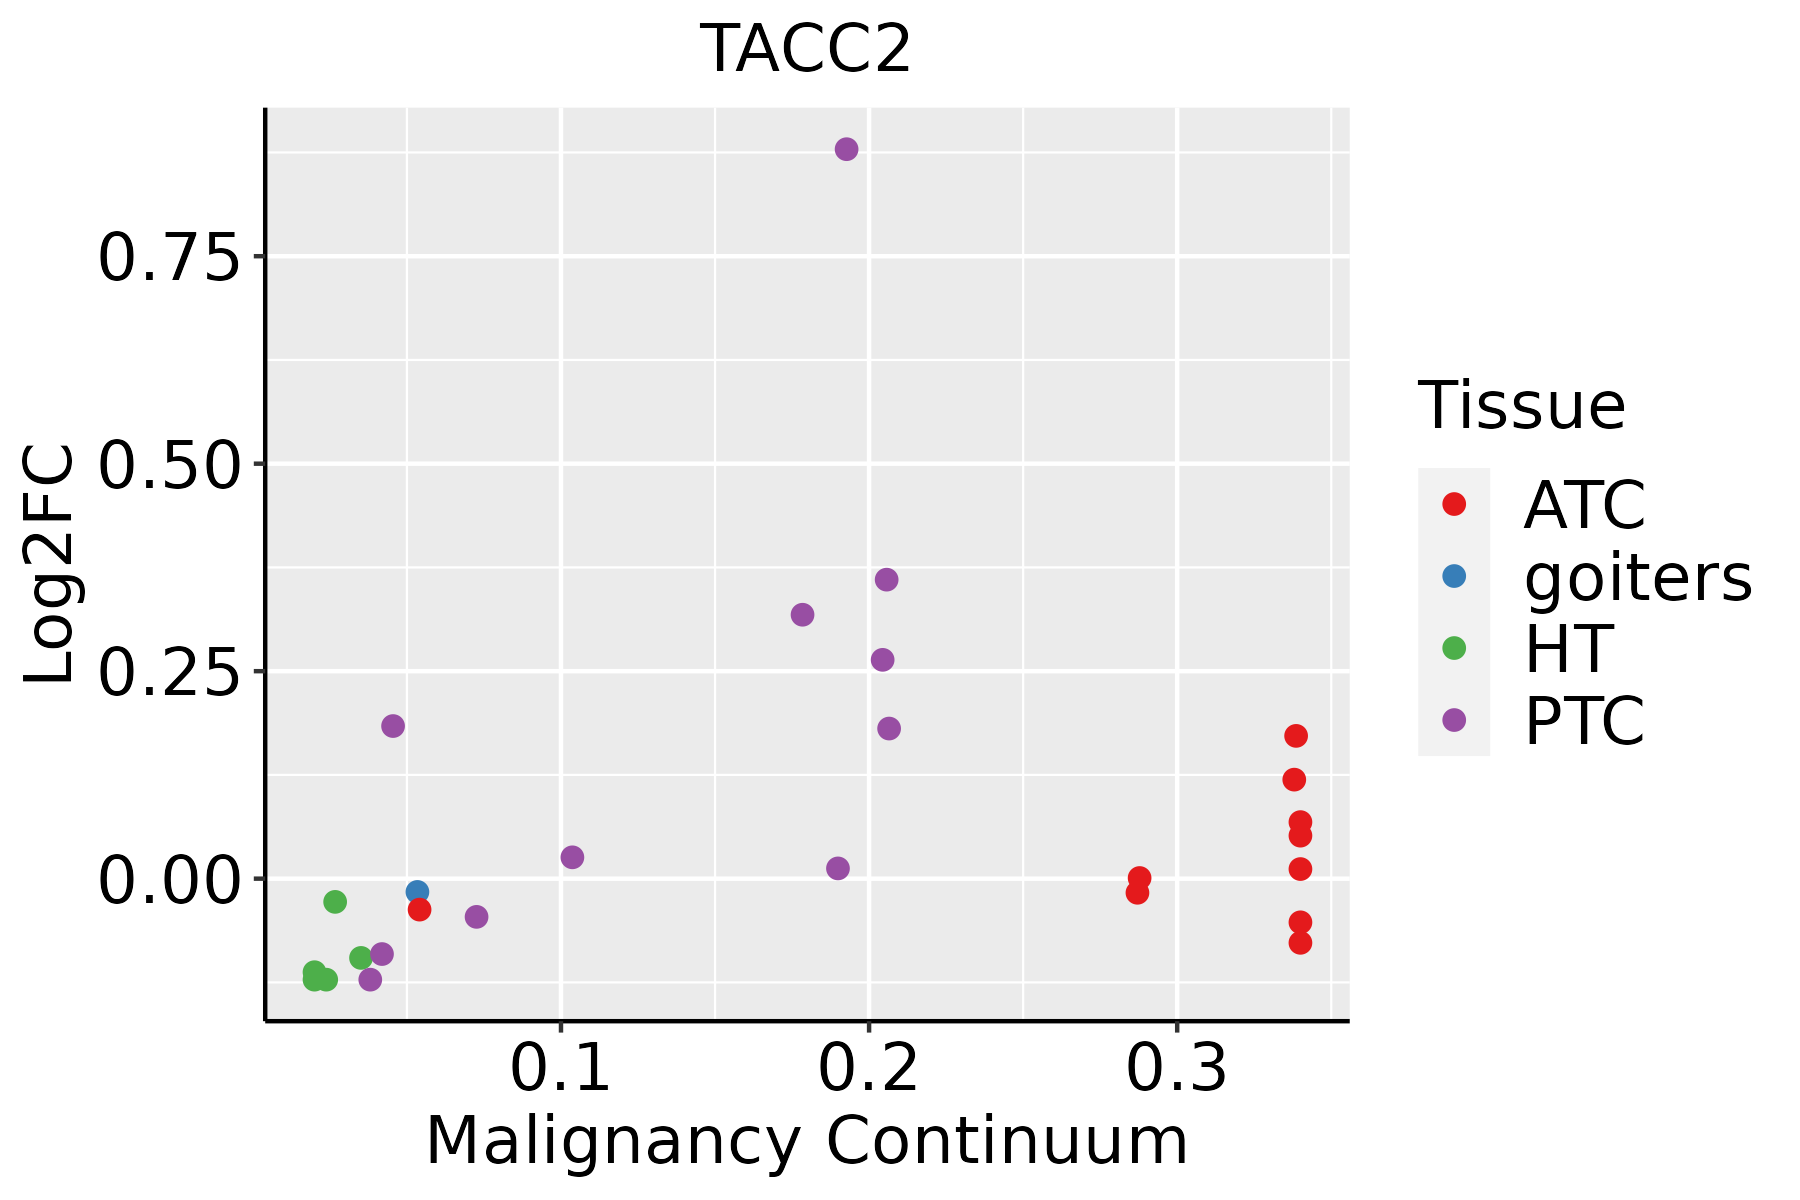 | ATC: Anaplastic thyroid cancer |
| HT: Hashimoto's thyroiditis |
| PTC: Papillary thyroid cancer |
| GO ID | Tissue | Disease Stage | Description | Gene Ratio | Bg Ratio | pvalue | p.adjust | Count |
| GO:00219874 | Endometrium | EEC | cerebral cortex development | 23/2168 | 114/18723 | 5.41e-03 | 3.32e-02 | 23 |
| GO:00070527 | Esophagus | HGIN | mitotic spindle organization | 31/2587 | 120/18723 | 3.35e-04 | 5.50e-03 | 31 |
| GO:19028507 | Esophagus | HGIN | microtubule cytoskeleton organization involved in mitosis | 36/2587 | 147/18723 | 3.61e-04 | 5.68e-03 | 36 |
| GO:00070518 | Esophagus | HGIN | spindle organization | 42/2587 | 184/18723 | 6.07e-04 | 8.49e-03 | 42 |
| GO:190285015 | Esophagus | ESCC | microtubule cytoskeleton organization involved in mitosis | 116/8552 | 147/18723 | 1.25e-16 | 9.91e-15 | 116 |
| GO:000705214 | Esophagus | ESCC | mitotic spindle organization | 97/8552 | 120/18723 | 2.17e-15 | 1.33e-13 | 97 |
| GO:000705114 | Esophagus | ESCC | spindle organization | 134/8552 | 184/18723 | 5.70e-14 | 2.87e-12 | 134 |
| GO:00215436 | Esophagus | ESCC | pallium development | 94/8552 | 169/18723 | 5.79e-03 | 2.14e-02 | 94 |
| GO:000705111 | Liver | HCC | spindle organization | 116/7958 | 184/18723 | 1.40e-08 | 3.40e-07 | 116 |
| GO:000705211 | Liver | HCC | mitotic spindle organization | 80/7958 | 120/18723 | 7.43e-08 | 1.50e-06 | 80 |
| GO:190285011 | Liver | HCC | microtubule cytoskeleton organization involved in mitosis | 93/7958 | 147/18723 | 2.91e-07 | 5.09e-06 | 93 |
| GO:00219872 | Lung | IAC | cerebral cortex development | 27/2061 | 114/18723 | 8.78e-05 | 1.77e-03 | 27 |
| GO:00215432 | Lung | IAC | pallium development | 33/2061 | 169/18723 | 7.51e-04 | 9.82e-03 | 33 |
| GO:00309002 | Lung | IAC | forebrain development | 61/2061 | 379/18723 | 1.52e-03 | 1.61e-02 | 61 |
| GO:19028503 | Lung | IAC | microtubule cytoskeleton organization involved in mitosis | 27/2061 | 147/18723 | 5.23e-03 | 3.97e-02 | 27 |
| GO:003090011 | Lung | AIS | forebrain development | 55/1849 | 379/18723 | 2.37e-03 | 2.48e-02 | 55 |
| GO:00070515 | Lung | MIAC | spindle organization | 22/967 | 184/18723 | 2.14e-04 | 7.50e-03 | 22 |
| GO:00070523 | Lung | MIAC | mitotic spindle organization | 15/967 | 120/18723 | 1.32e-03 | 2.44e-02 | 15 |
| GO:190285012 | Lung | MIAC | microtubule cytoskeleton organization involved in mitosis | 17/967 | 147/18723 | 1.55e-03 | 2.65e-02 | 17 |
| GO:00070526 | Oral cavity | OSCC | mitotic spindle organization | 85/7305 | 120/18723 | 1.44e-12 | 6.23e-11 | 85 |
| Hugo Symbol | Variant Class | Variant Classification | dbSNP RS | HGVSc | HGVSp | HGVSp Short | SWISSPROT | BIOTYPE | SIFT | PolyPhen | Tumor Sample Barcode | Tissue | Histology | Sex | Age | Stage | Therapy Types | Drugs | Outcome |
| TACC2 | SNV | Missense_Mutation | novel | c.3412N>A | p.Ala1138Thr | p.A1138T | O95359 | protein_coding | deleterious(0.03) | benign(0.031) | TCGA-A2-A0EW-01 | Breast | breast invasive carcinoma | Female | <65 | III/IV | Chemotherapy | adriamycin | PD |
| TACC2 | SNV | Missense_Mutation | rs554116886 | c.6496G>T | p.Gly2166Trp | p.G2166W | O95359 | protein_coding | deleterious(0) | possibly_damaging(0.685) | TCGA-A7-A0DB-01 | Breast | breast invasive carcinoma | Female | <65 | I/II | Hormone Therapy | arimidex | SD |
| TACC2 | SNV | Missense_Mutation | | c.781G>A | p.Glu261Lys | p.E261K | O95359 | protein_coding | deleterious(0.04) | benign(0.088) | TCGA-A8-A09G-01 | Breast | breast invasive carcinoma | Female | >=65 | III/IV | Unknown | Unknown | SD |
| TACC2 | SNV | Missense_Mutation | | c.1588G>A | p.Ala530Thr | p.A530T | O95359 | protein_coding | tolerated_low_confidence(0.23) | benign(0.066) | TCGA-A8-A09G-01 | Breast | breast invasive carcinoma | Female | >=65 | III/IV | Unknown | Unknown | SD |
| TACC2 | SNV | Missense_Mutation | rs779701973 | c.2241G>A | p.Met747Ile | p.M747I | O95359 | protein_coding | tolerated(0.05) | benign(0.007) | TCGA-A8-A09G-01 | Breast | breast invasive carcinoma | Female | >=65 | III/IV | Unknown | Unknown | SD |
| TACC2 | SNV | Missense_Mutation | | c.2788G>C | p.Glu930Gln | p.E930Q | O95359 | protein_coding | tolerated(1) | benign(0) | TCGA-A8-A09G-01 | Breast | breast invasive carcinoma | Female | >=65 | III/IV | Unknown | Unknown | SD |
| TACC2 | SNV | Missense_Mutation | | c.4128G>C | p.Arg1376Ser | p.R1376S | O95359 | protein_coding | tolerated_low_confidence(0.05) | benign(0.015) | TCGA-A8-A09G-01 | Breast | breast invasive carcinoma | Female | >=65 | III/IV | Unknown | Unknown | SD |
| TACC2 | SNV | Missense_Mutation | rs377162544 | c.3205N>A | p.Gly1069Arg | p.G1069R | O95359 | protein_coding | tolerated(1) | benign(0) | TCGA-A8-A09Z-01 | Breast | breast invasive carcinoma | Female | >=65 | I/II | Unknown | Unknown | SD |
| TACC2 | SNV | Missense_Mutation | | c.8277A>G | p.Ile2759Met | p.I2759M | O95359 | protein_coding | deleterious(0.01) | probably_damaging(0.995) | TCGA-AO-A128-01 | Breast | breast invasive carcinoma | Female | <65 | I/II | Chemotherapy | doxorubicin | SD |
| TACC2 | SNV | Missense_Mutation | novel | c.8666A>T | p.Asn2889Ile | p.N2889I | O95359 | protein_coding | deleterious(0.01) | probably_damaging(1) | TCGA-B6-A0RE-01 | Breast | breast invasive carcinoma | Female | <65 | I/II | Unknown | Unknown | SD |


