
|
|||||
|
 | |
| |
| |
| |
| |
| |
|
Gene: SUV39H2 |
Gene summary for SUV39H2 |
| Gene information | Species | Human | Gene symbol | SUV39H2 | Gene ID | 79723 |
| Gene name | SUV39H2 histone lysine methyltransferase | |
| Gene Alias | KMT1B | |
| Cytomap | 10p13 | |
| Gene Type | protein-coding | GO ID | GO:0000122 | UniProtAcc | Q9H5I1 |
Top |
Malignant transformation analysis |
| Identification of the aberrant gene expression in precancerous and cancerous lesions by comparing the gene expression of stem-like cells in diseased tissues with normal stem cells |
| Entrez ID | Symbol | Replicates | Species | Organ | Tissue | Adj P-value | Log2FC | Malignancy |
| 79723 | SUV39H2 | LZE24T | Human | Esophagus | ESCC | 7.53e-08 | 2.30e-01 | 0.0596 |
| 79723 | SUV39H2 | P2T-E | Human | Esophagus | ESCC | 3.86e-14 | 3.39e-01 | 0.1177 |
| 79723 | SUV39H2 | P4T-E | Human | Esophagus | ESCC | 8.40e-09 | 2.68e-01 | 0.1323 |
| 79723 | SUV39H2 | P5T-E | Human | Esophagus | ESCC | 1.68e-11 | 1.27e-01 | 0.1327 |
| 79723 | SUV39H2 | P8T-E | Human | Esophagus | ESCC | 1.34e-10 | 1.33e-01 | 0.0889 |
| 79723 | SUV39H2 | P9T-E | Human | Esophagus | ESCC | 8.61e-03 | 5.87e-02 | 0.1131 |
| 79723 | SUV39H2 | P10T-E | Human | Esophagus | ESCC | 4.44e-09 | 9.20e-02 | 0.116 |
| 79723 | SUV39H2 | P11T-E | Human | Esophagus | ESCC | 2.70e-02 | 1.42e-01 | 0.1426 |
| 79723 | SUV39H2 | P12T-E | Human | Esophagus | ESCC | 2.12e-07 | 1.61e-01 | 0.1122 |
| 79723 | SUV39H2 | P16T-E | Human | Esophagus | ESCC | 1.16e-14 | 1.95e-01 | 0.1153 |
| 79723 | SUV39H2 | P19T-E | Human | Esophagus | ESCC | 1.66e-02 | 3.70e-01 | 0.1662 |
| 79723 | SUV39H2 | P21T-E | Human | Esophagus | ESCC | 1.61e-08 | 2.07e-01 | 0.1617 |
| 79723 | SUV39H2 | P22T-E | Human | Esophagus | ESCC | 6.76e-08 | 6.27e-02 | 0.1236 |
| 79723 | SUV39H2 | P24T-E | Human | Esophagus | ESCC | 9.01e-06 | 1.82e-01 | 0.1287 |
| 79723 | SUV39H2 | P26T-E | Human | Esophagus | ESCC | 3.78e-10 | 2.19e-01 | 0.1276 |
| 79723 | SUV39H2 | P27T-E | Human | Esophagus | ESCC | 5.78e-05 | 1.46e-01 | 0.1055 |
| 79723 | SUV39H2 | P30T-E | Human | Esophagus | ESCC | 4.95e-02 | 2.33e-01 | 0.137 |
| 79723 | SUV39H2 | P31T-E | Human | Esophagus | ESCC | 3.58e-15 | 1.92e-01 | 0.1251 |
| 79723 | SUV39H2 | P32T-E | Human | Esophagus | ESCC | 9.96e-12 | 2.08e-01 | 0.1666 |
| 79723 | SUV39H2 | P39T-E | Human | Esophagus | ESCC | 3.30e-09 | 6.78e-02 | 0.0894 |
| Page: 1 2 3 |
| Tissue | Expression Dynamics | Abbreviation |
| Esophagus | 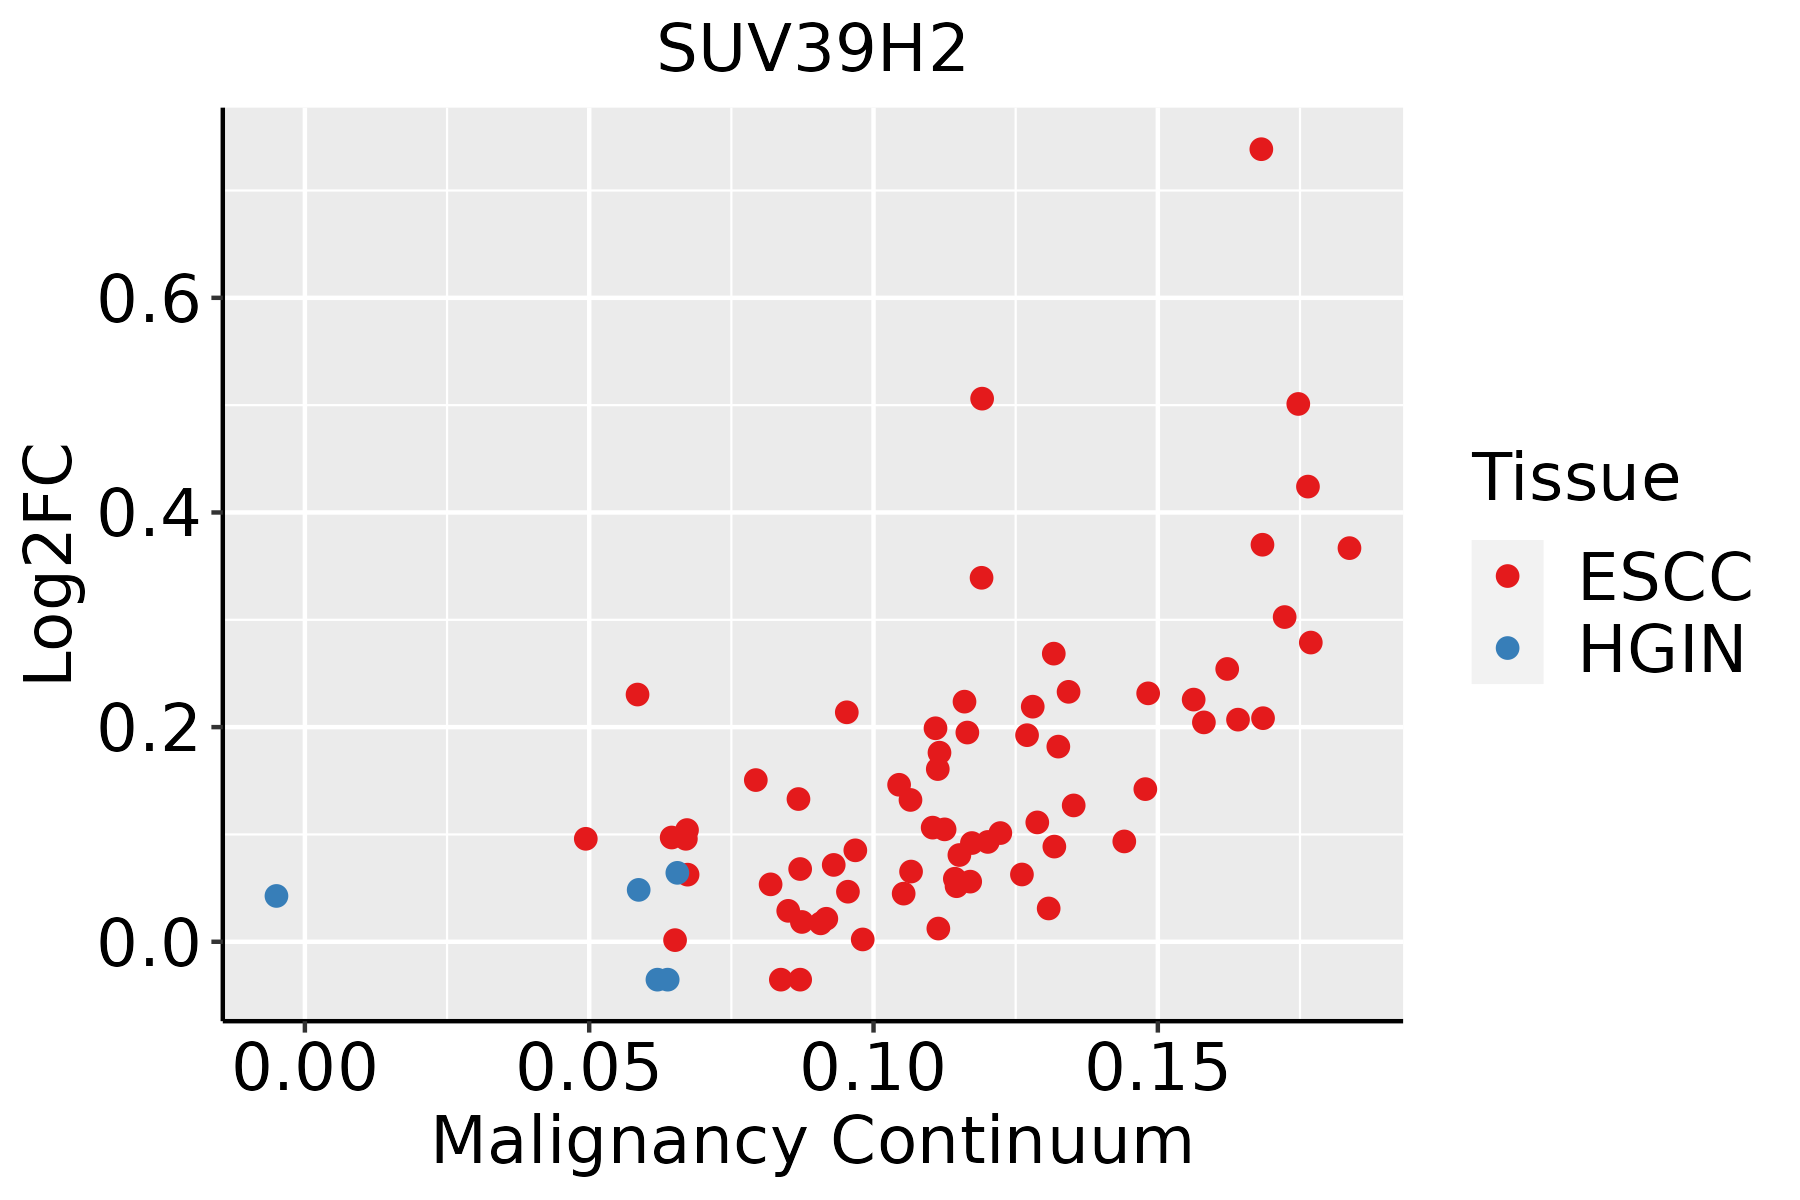 | ESCC: Esophageal squamous cell carcinoma |
| HGIN: High-grade intraepithelial neoplasias | ||
| LGIN: Low-grade intraepithelial neoplasias | ||
| Liver | 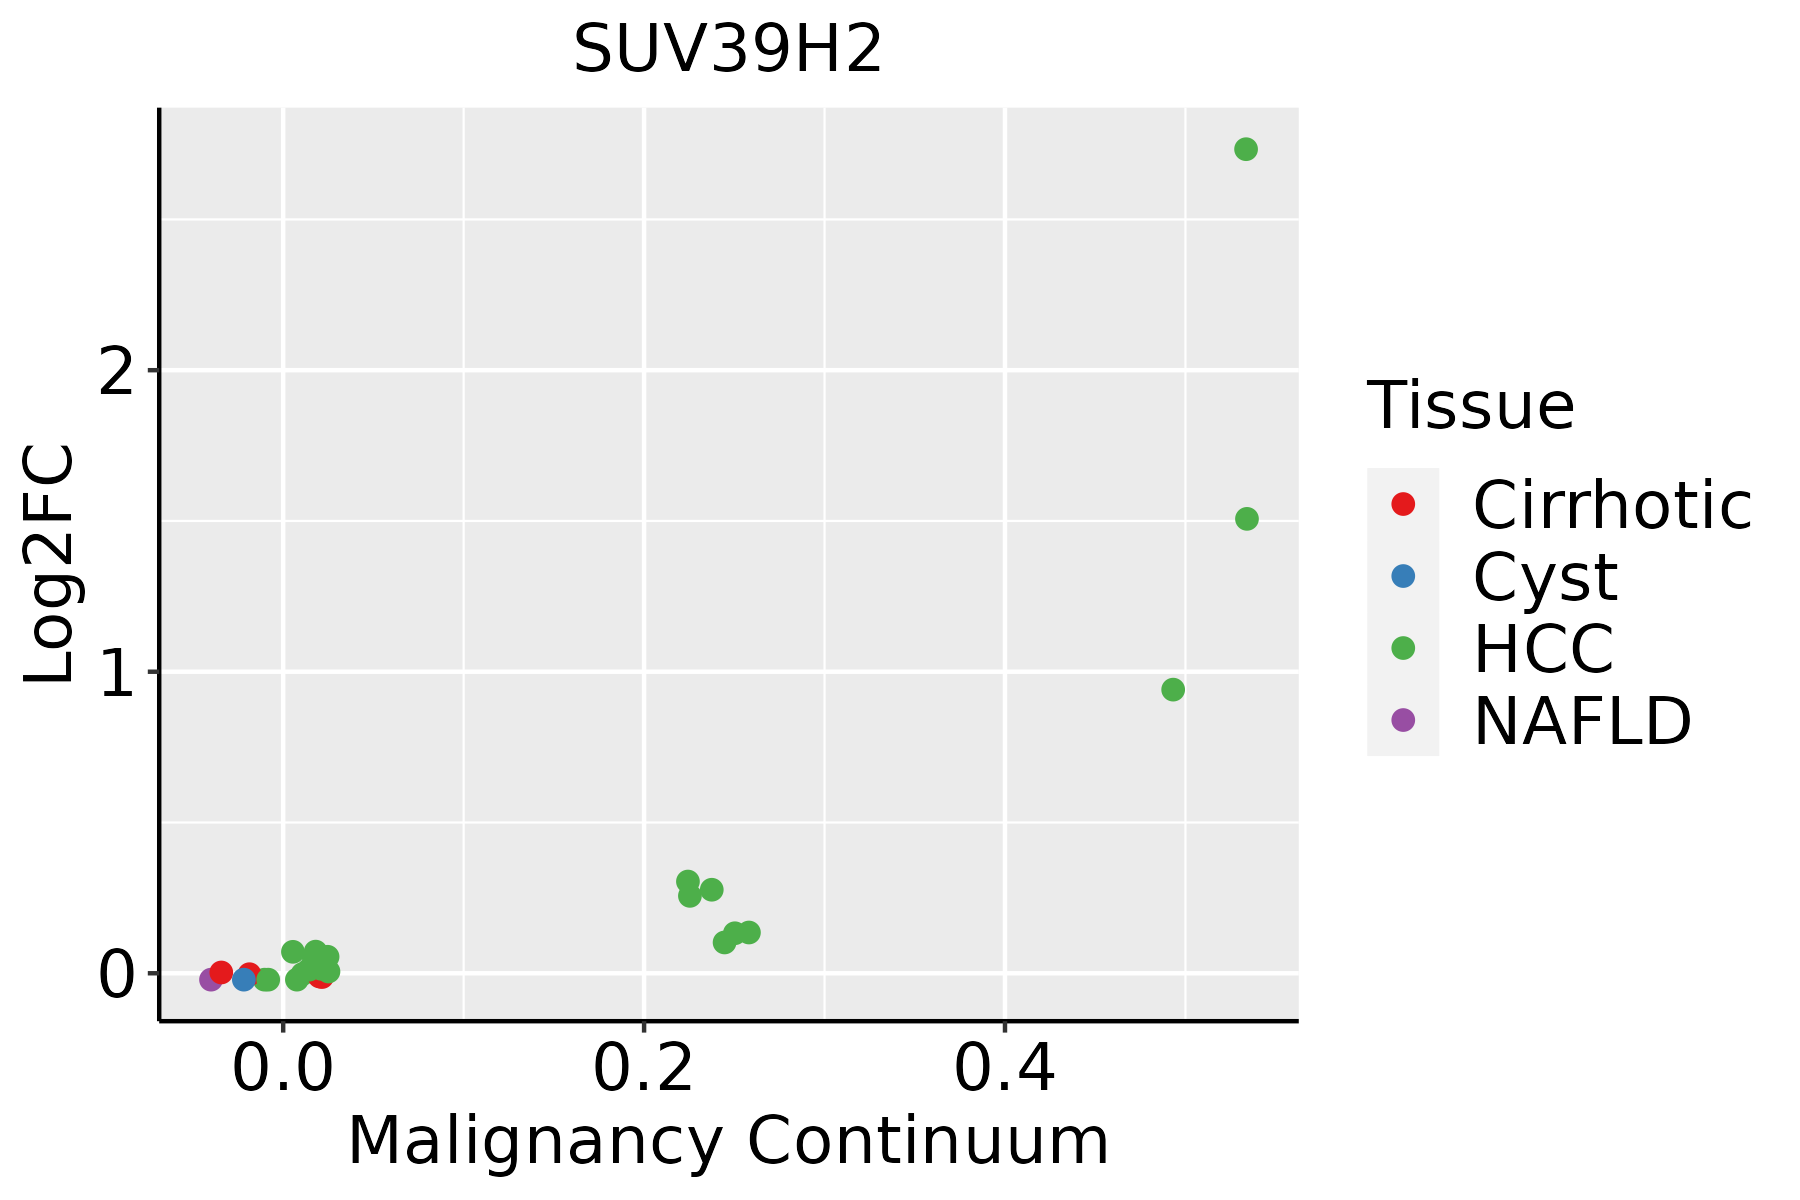 | HCC: Hepatocellular carcinoma |
| NAFLD: Non-alcoholic fatty liver disease |
| ∗log2FC in expression of this searched gene in stem-like cells from each diseased tissue sample relative to stem-like cells in normal samples in each tissue plotted against the malignancy continuum. Samples are colored based on if they are from different disease stage. |
Top |
Malignant transformation related pathway analysis |
| Find out the enriched GO biological processes and KEGG pathways involved in transition from healthy to precancer to cancer |
| Tissue | Disease Stage | Enriched GO biological Processes |
| Colorectum | AD |  |
| Colorectum | SER |  |
| Colorectum | MSS |  |
| Colorectum | MSI-H |  |
| Colorectum | FAP |  |
| ∗Top 15 enriched GO BP terms are showed in the bar plot of each disease state in each tissue. Each row represents a significant GO biological process which is colored according to the -log10(p.adjust). |
| Page: 1 2 3 4 5 6 7 8 9 |
| GO ID | Tissue | Disease Stage | Description | Gene Ratio | Bg Ratio | pvalue | p.adjust | Count |
| GO:001657021 | Liver | HCC | histone modification | 283/7958 | 463/18723 | 2.68e-16 | 2.33e-14 | 283 |
| GO:00182052 | Liver | HCC | peptidyl-lysine modification | 230/7958 | 376/18723 | 1.51e-13 | 8.32e-12 | 230 |
| GO:00434141 | Liver | HCC | macromolecule methylation | 183/7958 | 316/18723 | 2.00e-08 | 4.72e-07 | 183 |
| GO:0032259 | Liver | HCC | methylation | 206/7958 | 364/18723 | 3.35e-08 | 7.53e-07 | 206 |
| GO:00064792 | Liver | HCC | protein methylation | 111/7958 | 181/18723 | 2.36e-07 | 4.18e-06 | 111 |
| GO:00082132 | Liver | HCC | protein alkylation | 111/7958 | 181/18723 | 2.36e-07 | 4.18e-06 | 111 |
| GO:000166612 | Liver | HCC | response to hypoxia | 172/7958 | 307/18723 | 1.06e-06 | 1.59e-05 | 172 |
| GO:003629312 | Liver | HCC | response to decreased oxygen levels | 179/7958 | 322/18723 | 1.29e-06 | 1.87e-05 | 179 |
| GO:00165712 | Liver | HCC | histone methylation | 88/7958 | 141/18723 | 1.41e-06 | 2.02e-05 | 88 |
| GO:007048212 | Liver | HCC | response to oxygen levels | 191/7958 | 347/18723 | 1.42e-06 | 2.03e-05 | 191 |
| GO:00349681 | Liver | HCC | histone lysine methylation | 70/7958 | 115/18723 | 5.32e-05 | 5.04e-04 | 70 |
| GO:000762321 | Liver | HCC | circadian rhythm | 117/7958 | 210/18723 | 7.29e-05 | 6.54e-04 | 117 |
| GO:004851121 | Liver | HCC | rhythmic process | 156/7958 | 298/18723 | 3.54e-04 | 2.46e-03 | 156 |
| GO:007145311 | Liver | HCC | cellular response to oxygen levels | 98/7958 | 177/18723 | 3.63e-04 | 2.52e-03 | 98 |
| GO:003629411 | Liver | HCC | cellular response to decreased oxygen levels | 90/7958 | 161/18723 | 4.03e-04 | 2.72e-03 | 90 |
| GO:000632511 | Liver | HCC | chromatin organization | 206/7958 | 409/18723 | 7.23e-04 | 4.41e-03 | 206 |
| GO:007145611 | Liver | HCC | cellular response to hypoxia | 84/7958 | 151/18723 | 7.57e-04 | 4.56e-03 | 84 |
| GO:00180221 | Liver | HCC | peptidyl-lysine methylation | 74/7958 | 131/18723 | 8.46e-04 | 5.06e-03 | 74 |
| GO:004275211 | Liver | HCC | regulation of circadian rhythm | 65/7958 | 121/18723 | 8.25e-03 | 3.24e-02 | 65 |
| Page: 1 2 |
| Pathway ID | Tissue | Disease Stage | Description | Gene Ratio | Bg Ratio | pvalue | p.adjust | qvalue | Count |
| hsa0031010 | Esophagus | ESCC | Lysine degradation | 41/4205 | 63/8465 | 9.63e-03 | 2.27e-02 | 1.16e-02 | 41 |
| hsa0031013 | Esophagus | ESCC | Lysine degradation | 41/4205 | 63/8465 | 9.63e-03 | 2.27e-02 | 1.16e-02 | 41 |
| hsa0031041 | Liver | HCC | Lysine degradation | 47/4020 | 63/8465 | 1.02e-05 | 7.58e-05 | 4.22e-05 | 47 |
| hsa0031051 | Liver | HCC | Lysine degradation | 47/4020 | 63/8465 | 1.02e-05 | 7.58e-05 | 4.22e-05 | 47 |
| Page: 1 |
Top |
Cell-cell communication analysis |
| Identification of potential cell-cell interactions between two cell types and their ligand-receptor pairs for different disease states |
| Ligand | Receptor | LRpair | Pathway | Tissue | Disease Stage |
| Page: 1 |
Top |
Single-cell gene regulatory network inference analysis |
| Find out the significant the regulons (TFs) and the target genes of each regulon across cell types for different disease states |
| TF | Cell Type | Tissue | Disease Stage | Target Gene | RSS | Regulon Activity |
| ∗The dot plots of a searched regulon are shown for all cell subpopulations in each disease state of each tissue based on the regulon specific score inferred using pySCENIC and by calculating the average expression. |
| Page: 1 |
Top |
Somatic mutation of malignant transformation related genes |
| Annotation of somatic variants for genes involved in malignant transformation |
| Hugo Symbol | Variant Class | Variant Classification | dbSNP RS | HGVSc | HGVSp | HGVSp Short | SWISSPROT | BIOTYPE | SIFT | PolyPhen | Tumor Sample Barcode | Tissue | Histology | Sex | Age | Stage | Therapy Types | Drugs | Outcome |
| SUV39H2 | SNV | Missense_Mutation | c.767N>A | p.Arg256Gln | p.R256Q | Q9H5I1 | protein_coding | deleterious(0.04) | benign(0.047) | TCGA-AN-A046-01 | Breast | breast invasive carcinoma | Female | >=65 | I/II | Unknown | Unknown | SD | |
| SUV39H2 | insertion | Frame_Shift_Ins | novel | c.489_490insCCACTTGTTGGCTATAGACAGCAGGTGACAAATATTGAGAAACC | p.Gly164ProfsTer35 | p.G164Pfs*35 | Q9H5I1 | protein_coding | TCGA-AO-A0JF-01 | Breast | breast invasive carcinoma | Female | >=65 | I/II | Chemotherapy | doxorubicin | SD | ||
| SUV39H2 | deletion | Frame_Shift_Del | novel | c.494delC | p.Pro165HisfsTer19 | p.P165Hfs*19 | Q9H5I1 | protein_coding | TCGA-D8-A27V-01 | Breast | breast invasive carcinoma | Female | <65 | I/II | Hormone Therapy | tamoxiphen | SD | ||
| SUV39H2 | SNV | Missense_Mutation | novel | c.779G>A | p.Gly260Glu | p.G260E | Q9H5I1 | protein_coding | deleterious(0) | probably_damaging(0.948) | TCGA-2W-A8YY-01 | Cervix | cervical & endocervical cancer | Female | <65 | I/II | Chemotherapy | cisplatin | CR |
| SUV39H2 | SNV | Missense_Mutation | c.1148N>T | p.Asp383Val | p.D383V | Q9H5I1 | protein_coding | tolerated(0.17) | benign(0.007) | TCGA-FU-A23L-01 | Cervix | cervical & endocervical cancer | Female | <65 | I/II | Chemotherapy | cisplatin | CR | |
| SUV39H2 | SNV | Missense_Mutation | c.1007N>G | p.Asn336Ser | p.N336S | Q9H5I1 | protein_coding | deleterious(0.02) | probably_damaging(0.976) | TCGA-AA-3710-01 | Colorectum | colon adenocarcinoma | Female | >=65 | I/II | Unknown | Unknown | SD | |
| SUV39H2 | SNV | Missense_Mutation | c.818N>T | p.Arg273Ile | p.R273I | Q9H5I1 | protein_coding | deleterious(0) | benign(0.055) | TCGA-AA-3977-01 | Colorectum | colon adenocarcinoma | Male | >=65 | I/II | Unknown | Unknown | SD | |
| SUV39H2 | SNV | Missense_Mutation | novel | c.956C>T | p.Ala319Val | p.A319V | Q9H5I1 | protein_coding | deleterious(0.03) | probably_damaging(0.99) | TCGA-AZ-4315-01 | Colorectum | colon adenocarcinoma | Male | <65 | I/II | Unknown | Unknown | SD |
| SUV39H2 | SNV | Missense_Mutation | novel | c.821N>C | p.Met274Thr | p.M274T | Q9H5I1 | protein_coding | tolerated(0.06) | benign(0.01) | TCGA-CA-6717-01 | Colorectum | colon adenocarcinoma | Male | <65 | I/II | Chemotherapy | oxaliplatin | CR |
| SUV39H2 | SNV | Missense_Mutation | novel | c.1048N>T | p.Arg350Cys | p.R350C | Q9H5I1 | protein_coding | deleterious(0) | probably_damaging(0.975) | TCGA-A5-A0G1-01 | Endometrium | uterine corpus endometrioid carcinoma | Female | >=65 | I/II | Unknown | Unknown | SD |
| Page: 1 2 3 4 5 |
Top |
Related drugs of malignant transformation related genes |
| Identification of chemicals and drugs interact with genes involved in malignant transfromation |
| (DGIdb 4.0) |
| Entrez ID | Symbol | Category | Interaction Types | Drug Claim Name | Drug Name | PMIDs |
| Page: 1 |

Copyright 2023-Present -The University of Texas Health Science Center at Houston |