Schematic overview of the cellular and molecular mechanisms involved in the cancer progression, including the proposed cellular and molecular mechanisms in cancer cells trajectory. AT1: alveolar type 1 cells; AT2: alveolar type 2 cells; AAH: atypical adenomatous hyperplasia; AIS: adenocarcinoma in situ; MIA: minimally invasive adenocarcinoma; IA: invasive adenocarcinoma; EMT: epithelial-mesenchymal transition

Home

Download

Statistics

Help

Contact

Center for Computational Systems Medicine
leaf

Gene summary

leaf

Malignant transformation analysis

leaf

Malignant transformation related pathway analysis

leaf

Cell-cell communication analysis

leaf

Single-cell gene regulatory network inference analysis

leaf

Somatic mutation of malignant transformation related genes

leaf

Related drugs of malignant transformation related genes

Gene: SURF1

Gene summary for SURF1

check button Gene summary.

Gene informationSpeciesHuman
Gene symbol

SURF1

Gene ID

6834

Gene nameSURF1 cytochrome c oxidase assembly factor
Gene AliasCMT4K
Cytomap9q34.2
Gene Typeprotein-coding
GO ID

GO:0006091

UniProtAcc

A0A087WYS9


Top

Malignant transformation analysis

check button Identification of the aberrant gene expression in precancerous and cancerous lesions by comparing the gene expression of stem-like cells in diseased tissues with normal stem cells
check button Malignant transformation involving gene list.
Entrez IDSymbolReplicatesSpeciesOrganTissueAdj P-valueLog2FCMalignancy
6834SURF1HTA11_3410_2000001011HumanColorectumAD2.41e-021.42e-010.0155
6834SURF1HTA11_2487_2000001011HumanColorectumSER6.28e-083.73e-01-0.1808
6834SURF1HTA11_347_2000001011HumanColorectumAD3.21e-133.71e-01-0.1954
6834SURF1HTA11_2112_2000001011HumanColorectumSER1.40e-065.98e-01-0.2196
6834SURF1HTA11_3361_2000001011HumanColorectumAD5.61e-062.83e-01-0.1207
6834SURF1HTA11_83_2000001011HumanColorectumSER1.48e-023.10e-01-0.1526
6834SURF1HTA11_696_2000001011HumanColorectumAD3.12e-123.62e-01-0.1464
6834SURF1HTA11_866_2000001011HumanColorectumAD1.47e-031.84e-01-0.1001
6834SURF1HTA11_1391_2000001011HumanColorectumAD2.93e-093.73e-01-0.059
6834SURF1HTA11_5212_2000001011HumanColorectumAD1.66e-023.46e-01-0.2061
6834SURF1HTA11_5216_2000001011HumanColorectumSER4.63e-044.78e-01-0.1462
6834SURF1HTA11_546_2000001011HumanColorectumAD3.21e-053.38e-01-0.0842
6834SURF1HTA11_866_3004761011HumanColorectumAD1.69e-072.83e-010.096
6834SURF1HTA11_10623_2000001011HumanColorectumAD8.48e-074.33e-01-0.0177
6834SURF1HTA11_6801_2000001011HumanColorectumSER1.45e-043.79e-010.0171
6834SURF1HTA11_10711_2000001011HumanColorectumAD1.87e-032.03e-010.0338
6834SURF1HTA11_7696_3000711011HumanColorectumAD2.74e-082.69e-010.0674
6834SURF1HTA11_6818_2000001021HumanColorectumAD3.37e-023.07e-010.0588
6834SURF1HTA11_99999971662_82457HumanColorectumMSS5.57e-082.72e-010.3859
6834SURF1HTA11_99999974143_84620HumanColorectumMSS7.59e-123.49e-010.3005
Page: 1 2 3 4 5 6 7 8 

check button Transcriptomic changes along malignancy continuum.
TissueExpression DynamicsAbbreviation
Colorectum (GSE201348)The image shows the transcriptomic changes along malignancy continuum.log2FC in expression of this searched gene in stem-like cells from each diseased tissue sample relative to stem-like cells in normal samples in each tissue plotted against the malignancy continuum. Samples are colored based on if they are from different disease stage.FAP: Familial adenomatous polyposis
CRC: Colorectal cancer
Colorectum (HTA11)The image shows the transcriptomic changes along malignancy continuum.log2FC in expression of this searched gene in stem-like cells from each diseased tissue sample relative to stem-like cells in normal samples in each tissue plotted against the malignancy continuum. Samples are colored based on if they are from different disease stage.AD: Adenomas
SER: Sessile serrated lesions
MSI-H: Microsatellite-high colorectal cancer
MSS: Microsatellite stable colorectal cancer
EsophagusThe image shows the transcriptomic changes along malignancy continuum.log2FC in expression of this searched gene in stem-like cells from each diseased tissue sample relative to stem-like cells in normal samples in each tissue plotted against the malignancy continuum. Samples are colored based on if they are from different disease stage.
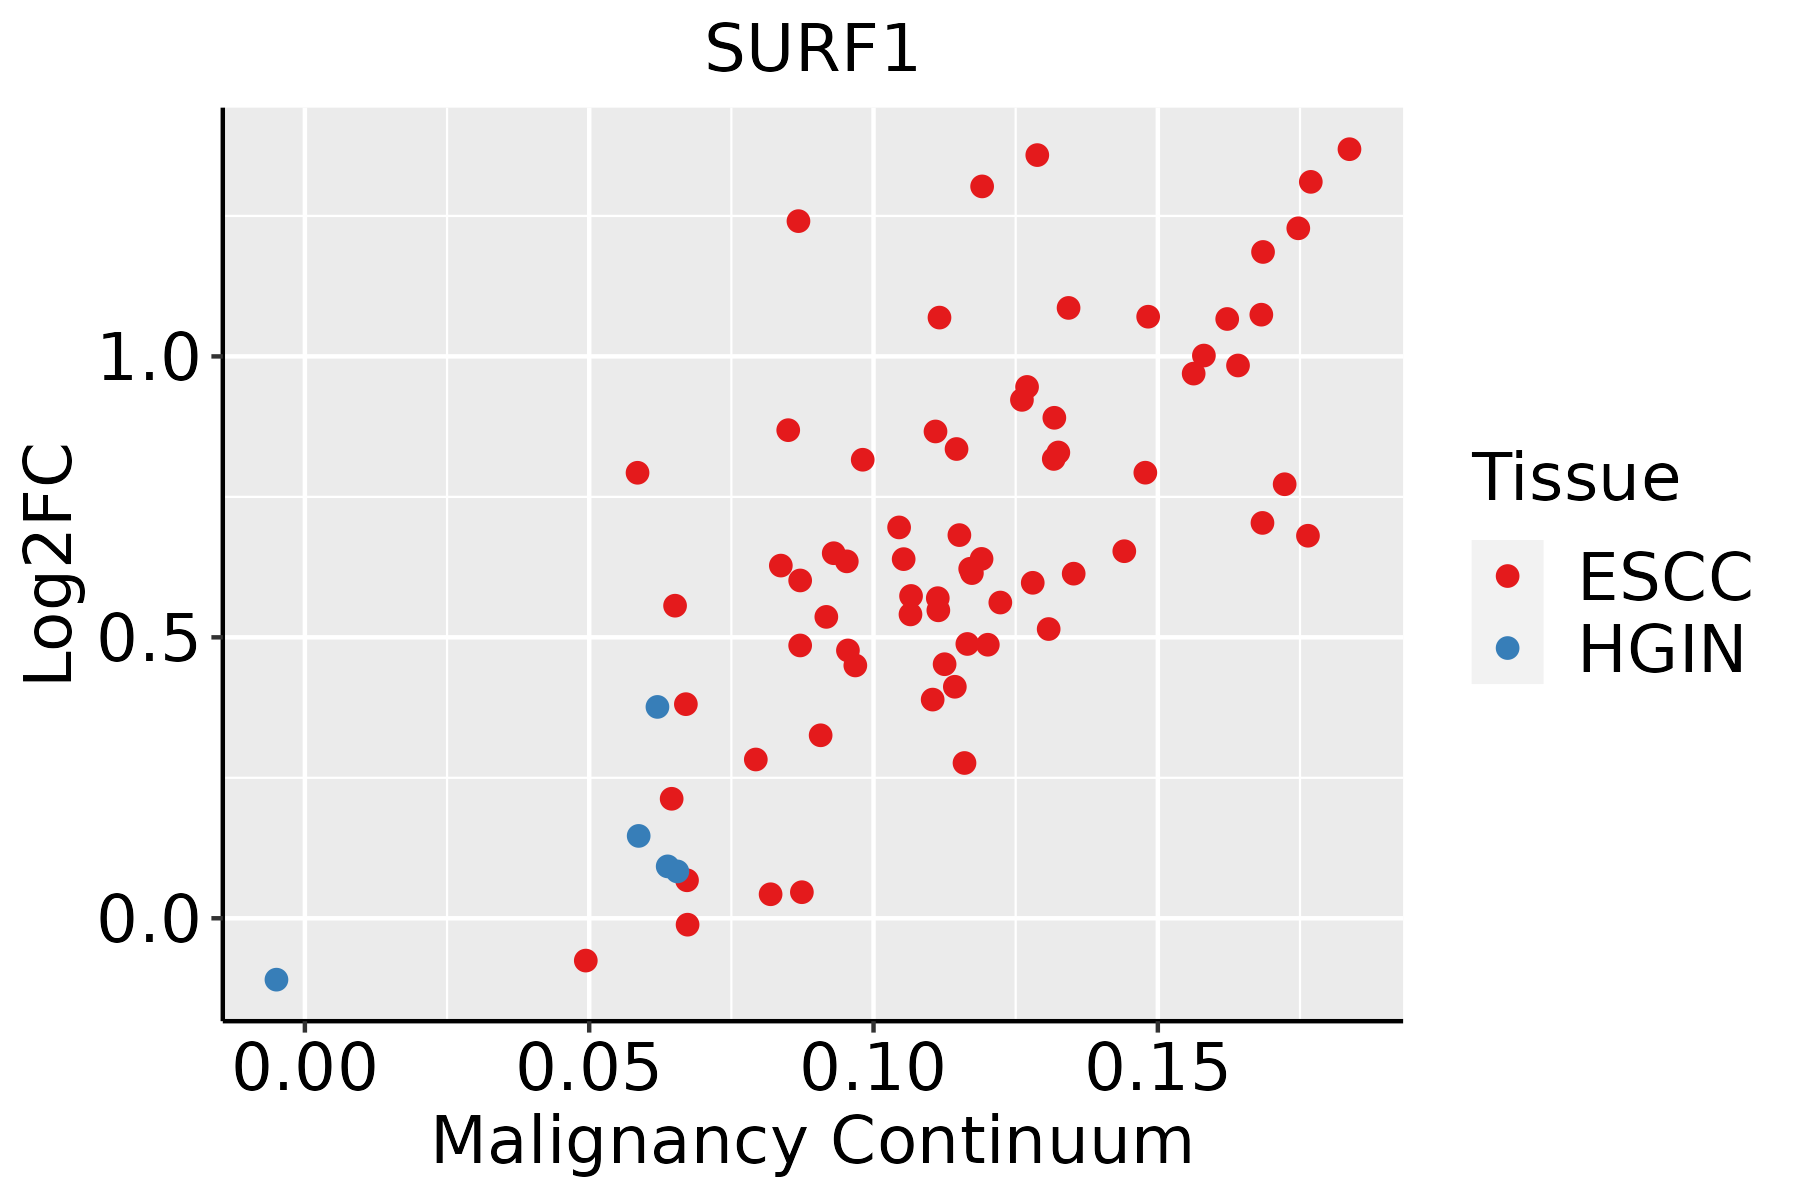
ESCC: Esophageal squamous cell carcinoma
HGIN: High-grade intraepithelial neoplasias
LGIN: Low-grade intraepithelial neoplasias
LiverThe image shows the transcriptomic changes along malignancy continuum.log2FC in expression of this searched gene in stem-like cells from each diseased tissue sample relative to stem-like cells in normal samples in each tissue plotted against the malignancy continuum. Samples are colored based on if they are from different disease stage.
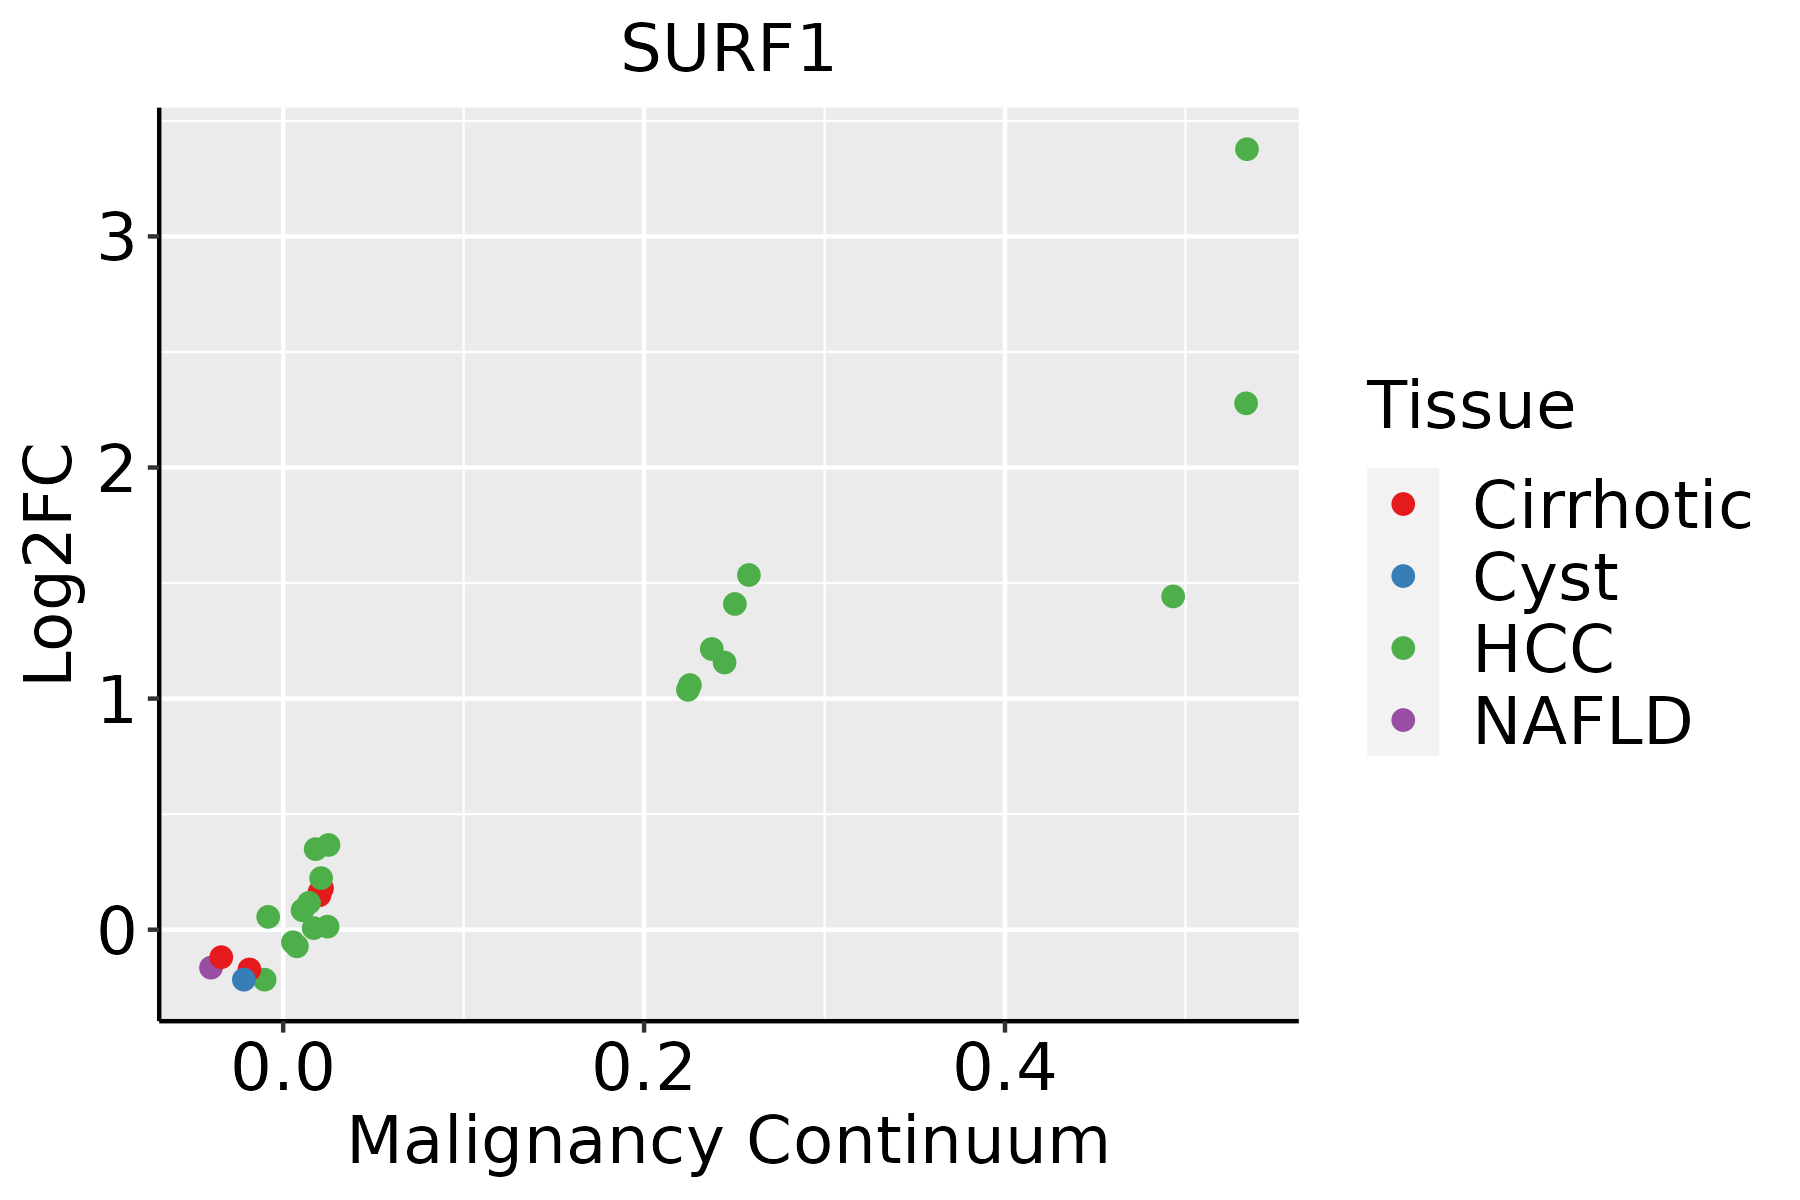
HCC: Hepatocellular carcinoma
NAFLD: Non-alcoholic fatty liver disease
Oral CavityThe image shows the transcriptomic changes along malignancy continuum.log2FC in expression of this searched gene in stem-like cells from each diseased tissue sample relative to stem-like cells in normal samples in each tissue plotted against the malignancy continuum. Samples are colored based on if they are from different disease stage.
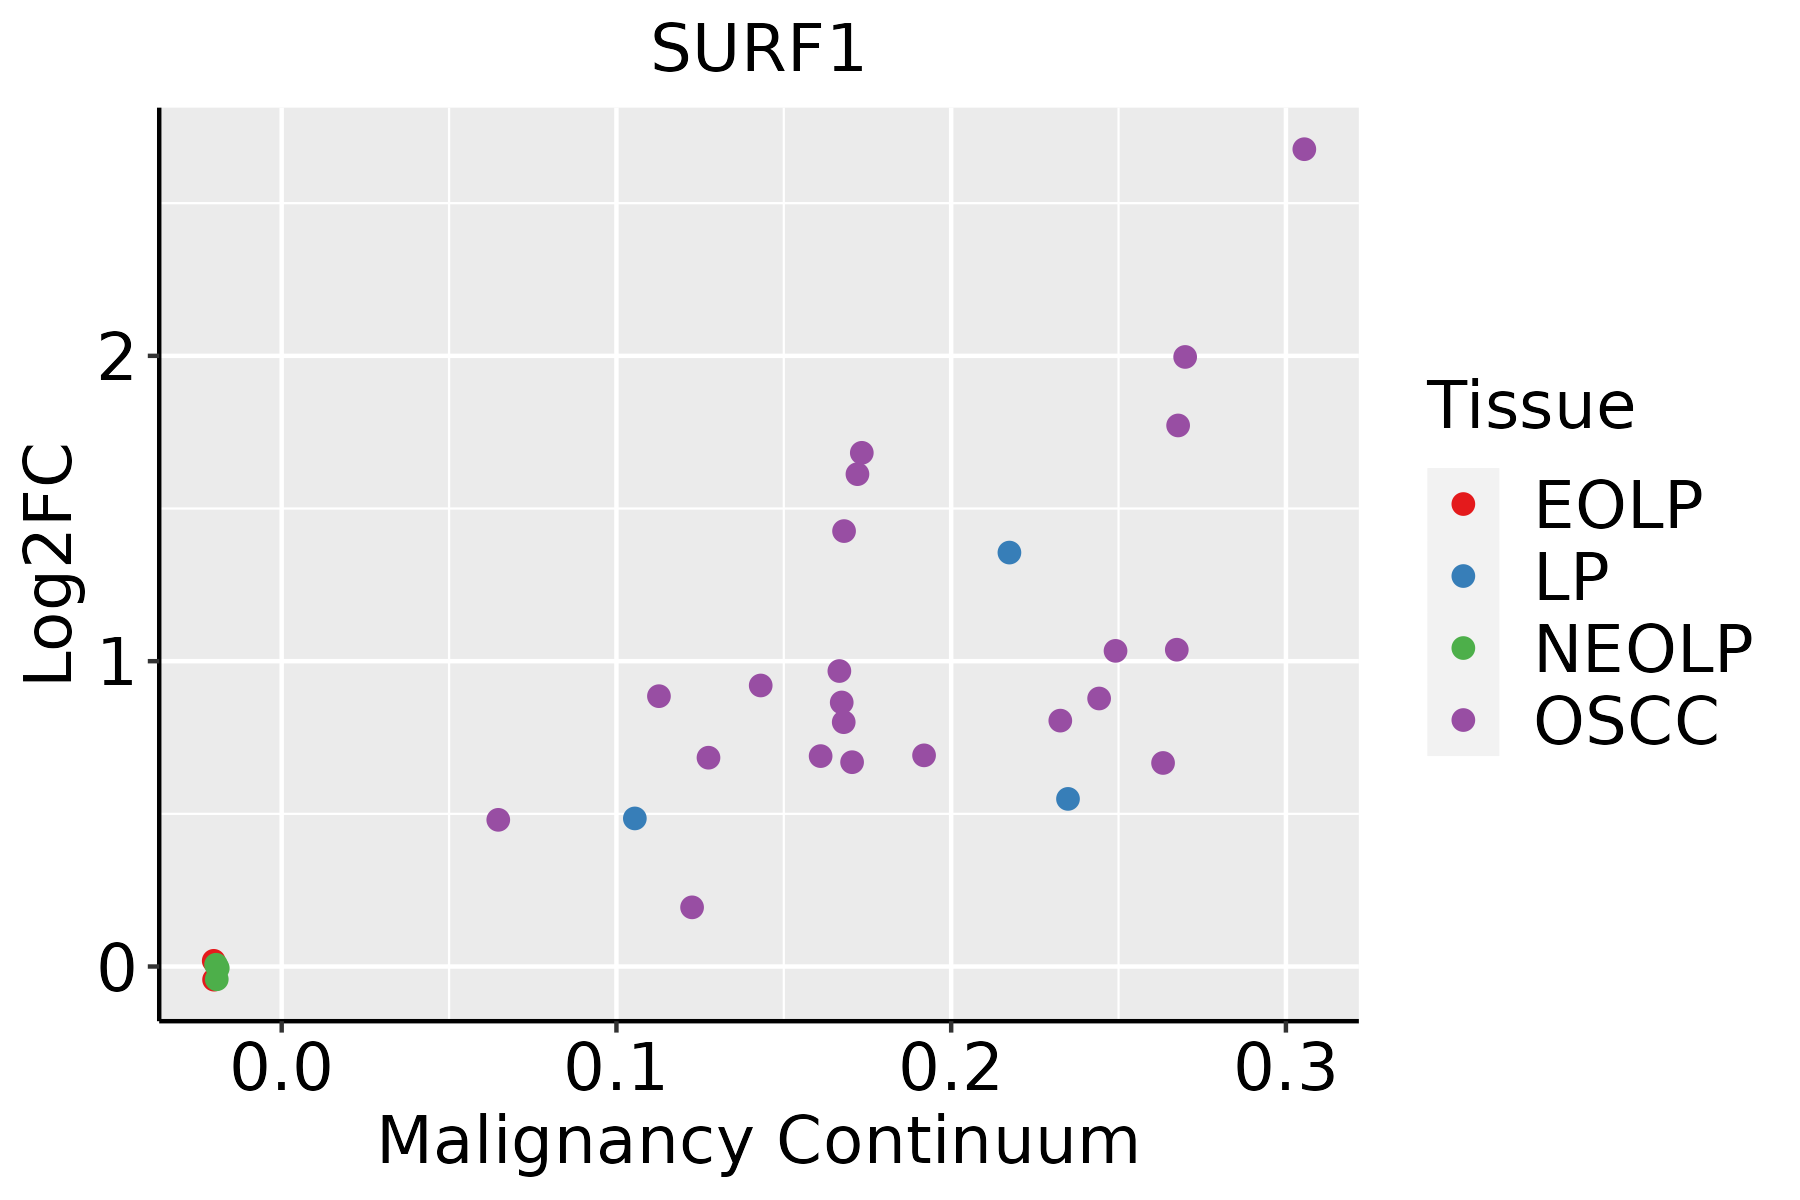
EOLP: Erosive Oral lichen planus
LP: leukoplakia
NEOLP: Non-erosive oral lichen planus
OSCC: Oral squamous cell carcinoma
ProstateThe image shows the transcriptomic changes along malignancy continuum.log2FC in expression of this searched gene in stem-like cells from each diseased tissue sample relative to stem-like cells in normal samples in each tissue plotted against the malignancy continuum. Samples are colored based on if they are from different disease stage.
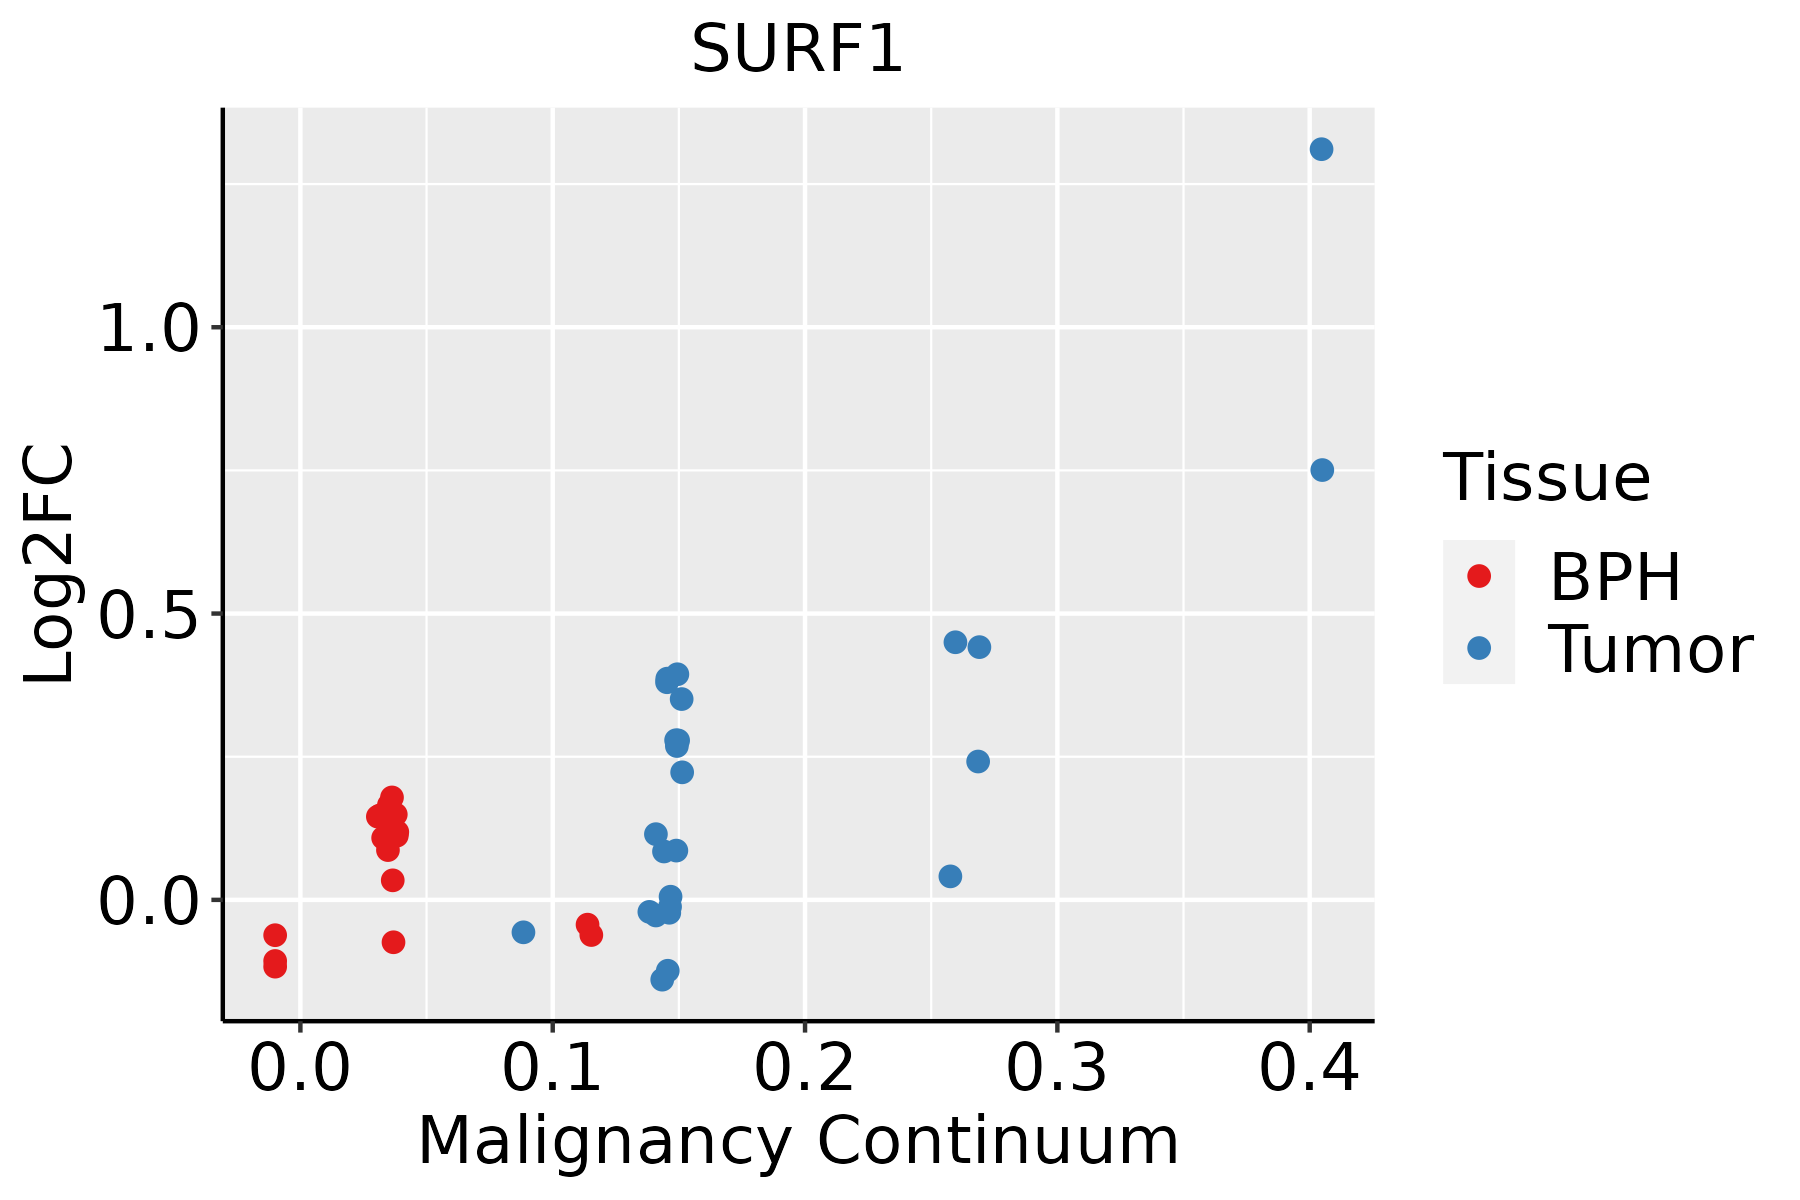
BPH: Benign Prostatic Hyperplasia
SkinThe image shows the transcriptomic changes along malignancy continuum.log2FC in expression of this searched gene in stem-like cells from each diseased tissue sample relative to stem-like cells in normal samples in each tissue plotted against the malignancy continuum. Samples are colored based on if they are from different disease stage.
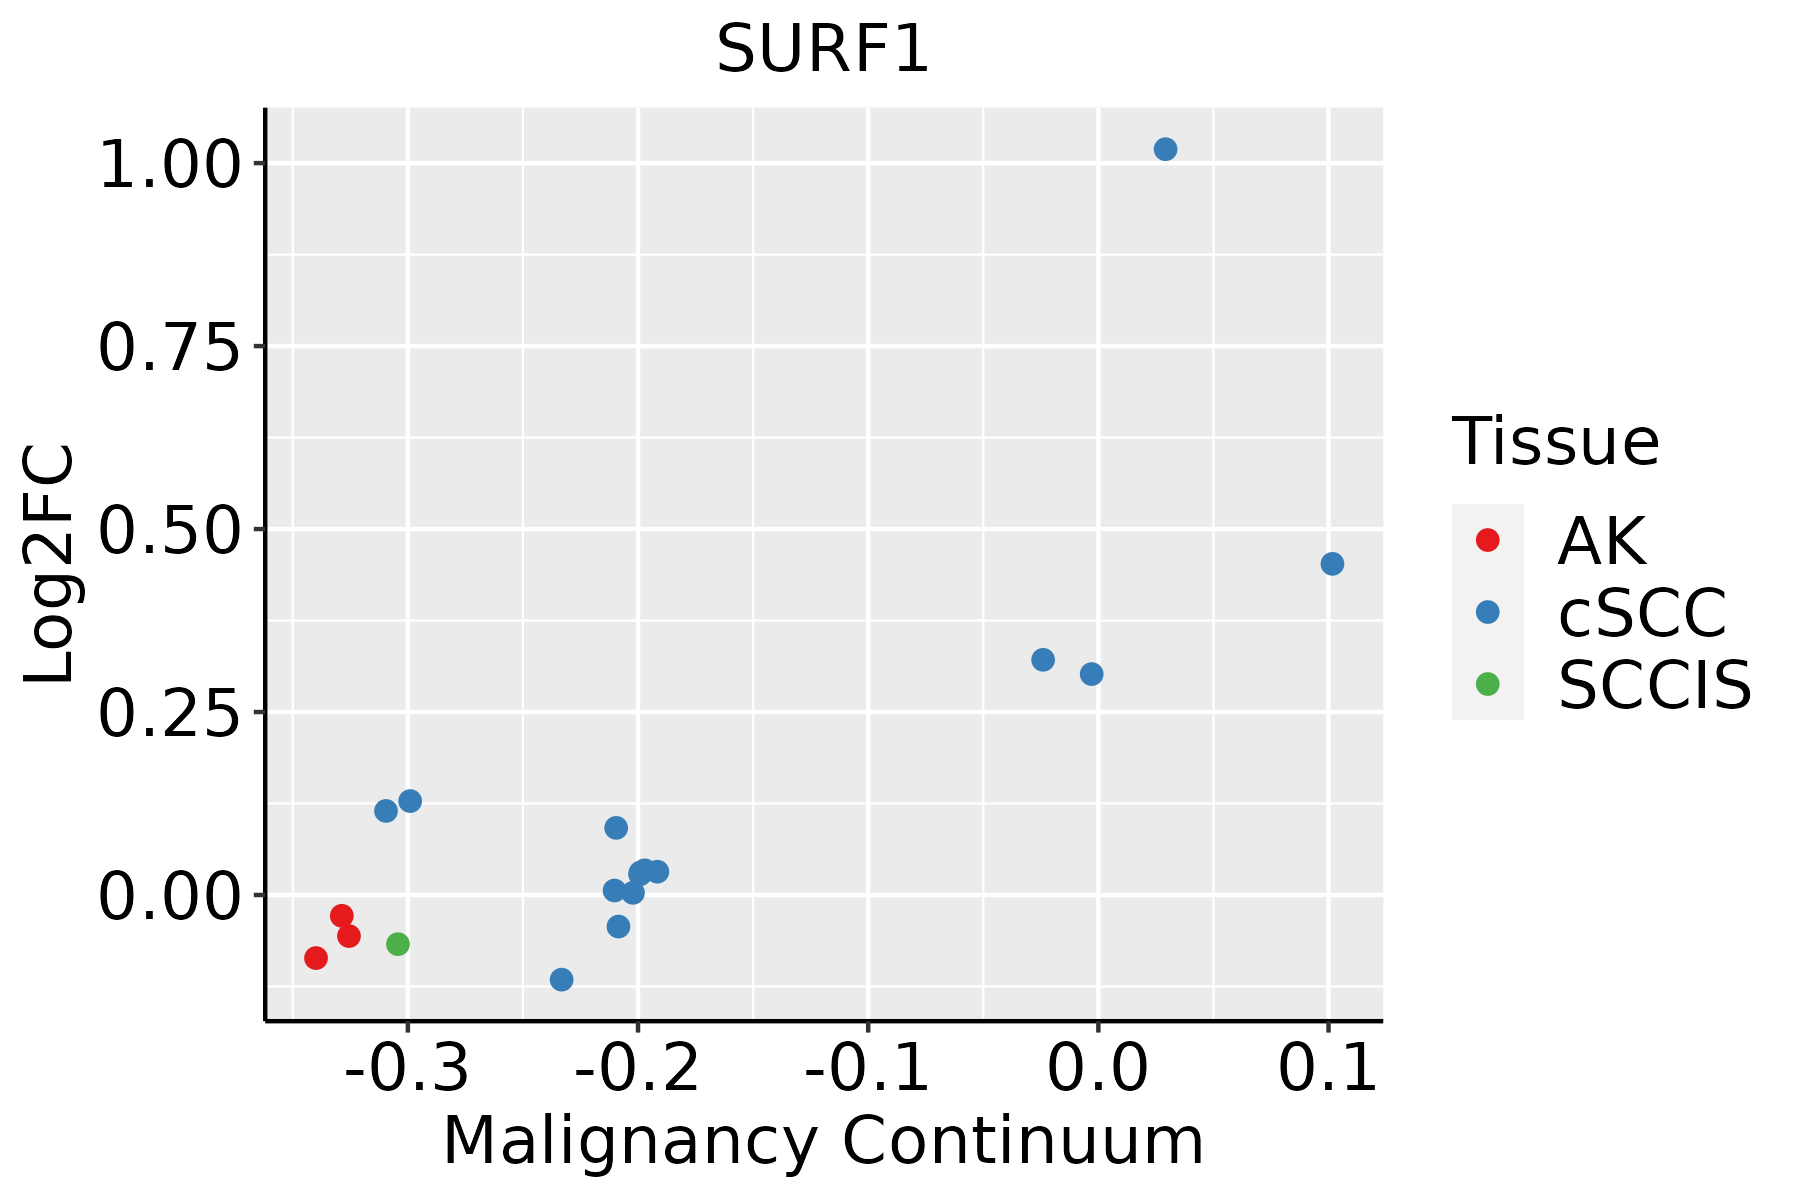
AK: Actinic keratosis
cSCC: Cutaneous squamous cell carcinoma
SCCIS:squamous cell carcinoma in situ
ThyroidThe image shows the transcriptomic changes along malignancy continuum.log2FC in expression of this searched gene in stem-like cells from each diseased tissue sample relative to stem-like cells in normal samples in each tissue plotted against the malignancy continuum. Samples are colored based on if they are from different disease stage.ATC: Anaplastic thyroid cancer
HT: Hashimoto's thyroiditis
PTC: Papillary thyroid cancer
∗log2FC in expression of this searched gene in stem-like cells from each diseased tissue sample relative to stem-like cells in normal samples in each tissue plotted against the malignancy continuum. Samples are colored based on if they are from different disease stage.

Top

Malignant transformation related pathway analysis

check buttonFind out the enriched GO biological processes and KEGG pathways involved in transition from healthy to precancer to cancer
check button Figure of enriched GO biological processes.
TissueDisease StageEnriched GO biological Processes
ColorectumADGO analysis - Figure of enriched GO biological processes: Top 15 enriched GO BP terms are showed in the bar plot of each disease state in each tissue. Each row represents a significant GO biological process which is colored according to the -log10(p.adjust).
ColorectumSERGO analysis - Figure of enriched GO biological processes: Top 15 enriched GO BP terms are showed in the bar plot of each disease state in each tissue. Each row represents a significant GO biological process which is colored according to the -log10(p.adjust).
ColorectumMSSGO analysis - Figure of enriched GO biological processes: Top 15 enriched GO BP terms are showed in the bar plot of each disease state in each tissue. Each row represents a significant GO biological process which is colored according to the -log10(p.adjust).
ColorectumMSI-HGO analysis - Figure of enriched GO biological processes: Top 15 enriched GO BP terms are showed in the bar plot of each disease state in each tissue. Each row represents a significant GO biological process which is colored according to the -log10(p.adjust).
ColorectumFAPGO analysis - Figure of enriched GO biological processes: Top 15 enriched GO BP terms are showed in the bar plot of each disease state in each tissue. Each row represents a significant GO biological process which is colored according to the -log10(p.adjust).
∗Top 15 enriched GO BP terms are showed in the bar plot of each disease state in each tissue. Each row represents a significant GO biological process which is colored according to the -log10(p.adjust).
Page: 1 2 3 4 5 6 7 8 9 

check button Enriched GO biological processes.
GO IDTissueDisease StageDescriptionGene RatioBg Ratiopvaluep.adjustCount
GO:19026002ColorectumMSSproton transmembrane transport57/3467157/187231.00e-074.81e-0657
GO:0006091110EsophagusESCCgeneration of precursor metabolites and energy331/8552490/187233.86e-238.45e-21331
GO:0045333110EsophagusESCCcellular respiration173/8552230/187234.53e-205.99e-18173
GO:0033108110EsophagusESCCmitochondrial respiratory chain complex assembly83/855293/187239.56e-191.05e-1683
GO:0009060110EsophagusESCCaerobic respiration145/8552189/187232.16e-182.21e-16145
GO:0015980110EsophagusESCCenergy derivation by oxidation of organic compounds220/8552318/187231.20e-171.09e-15220
GO:0022900110EsophagusESCCelectron transport chain133/8552175/187232.18e-161.67e-14133
GO:001700413EsophagusESCCcytochrome complex assembly34/855236/187235.08e-101.31e-0834
GO:000853512EsophagusESCCrespiratory chain complex IV assembly24/855226/187236.87e-078.99e-0624
GO:003361712EsophagusESCCmitochondrial cytochrome c oxidase assembly21/855222/187238.75e-071.13e-0521
GO:190260018EsophagusESCCproton transmembrane transport88/8552157/187235.62e-032.10e-0288
GO:000609112LiverCirrhoticgeneration of precursor metabolites and energy238/4634490/187236.85e-311.07e-27238
GO:002290012LiverCirrhoticelectron transport chain111/4634175/187231.94e-271.52e-24111
GO:00090607LiverCirrhoticaerobic respiration109/4634189/187233.88e-221.62e-19109
GO:00453337LiverCirrhoticcellular respiration122/4634230/187232.15e-206.43e-18122
GO:001598012LiverCirrhoticenergy derivation by oxidation of organic compounds154/4634318/187233.11e-208.87e-18154
GO:00331087LiverCirrhoticmitochondrial respiratory chain complex assembly64/463493/187233.85e-197.79e-1764
GO:0017004LiverCirrhoticcytochrome complex assembly22/463436/187233.92e-066.70e-0522
GO:0033617LiverCirrhoticmitochondrial cytochrome c oxidase assembly14/463422/187231.27e-041.25e-0314
GO:0008535LiverCirrhoticrespiratory chain complex IV assembly15/463426/187233.43e-042.93e-0315
Page: 1 2 3 4 5 6 

check button Enriched KEGG pathways.
Pathway IDTissueDisease StageDescriptionGene RatioBg Ratiopvaluep.adjustqvalueCount
Page: 1 

Top

Cell-cell communication analysis

check buttonIdentification of potential cell-cell interactions between two cell types and their ligand-receptor pairs for different disease states
LigandReceptorLRpairPathwayTissueDisease Stage
Page: 1 

Top

Single-cell gene regulatory network inference analysis

check buttonFind out the significant the regulons (TFs) and the target genes of each regulon across cell types for different disease states
TFCell TypeTissueDisease StageTarget GeneRSSRegulon Activity
∗The dot plots of a searched regulon are shown for all cell subpopulations in each disease state of each tissue based on the regulon specific score inferred using pySCENIC and by calculating the average expression.
Page: 1 

Top

Somatic mutation of malignant transformation related genes

check buttonAnnotation of somatic variants for genes involved in malignant transformation
Hugo SymbolVariant ClassVariant ClassificationdbSNP RSHGVScHGVSpHGVSp ShortSWISSPROTBIOTYPESIFTPolyPhenTumor Sample BarcodeTissueHistologySexAgeStageTherapy TypesDrugsOutcome
SURF1insertionFrame_Shift_Insnovelc.651_652insACCCAACGTAAAGGCCATACAGGACTp.Pro218ThrfsTer59p.P218Tfs*59Q15526protein_codingTCGA-B6-A0IA-01Breastbreast invasive carcinomaFemale<65I/IIUnknownUnknownSD
SURF1SNVMissense_Mutationrs782044026c.251N>Ap.Arg84Glnp.R84QQ15526protein_codingdeleterious(0.01)probably_damaging(0.913)TCGA-2W-A8YY-01Cervixcervical & endocervical cancerFemale<65I/IIChemotherapycisplatinCR
SURF1SNVMissense_Mutationnovelc.667G>Cp.Glu223Glnp.E223QQ15526protein_codingtolerated(0.09)benign(0.248)TCGA-C5-A2LX-01Cervixcervical & endocervical cancerFemale<65I/IIChemotherapycisplatinSD
SURF1SNVMissense_Mutationnovelc.425N>Tp.Pro142Leup.P142LQ15526protein_codingdeleterious(0)possibly_damaging(0.811)TCGA-A5-A0G2-01Endometriumuterine corpus endometrioid carcinomaFemale<65III/IVUnknownUnknownSD
SURF1SNVMissense_Mutationnovelc.689N>Ap.Arg230Glnp.R230QQ15526protein_codingdeleterious(0)probably_damaging(0.928)TCGA-AX-A2HC-01Endometriumuterine corpus endometrioid carcinomaFemale<65III/IVChemotherapypaclitaxelPD
SURF1SNVMissense_Mutationrs782024654c.269T>Cp.Leu90Prop.L90PQ15526protein_codingdeleterious(0)probably_damaging(0.996)TCGA-AX-A2HJ-01Endometriumuterine corpus endometrioid carcinomaFemale<65I/IIUnknownUnknownSD
SURF1SNVMissense_Mutationrs374365243c.250N>Tp.Arg84Trpp.R84WQ15526protein_codingtolerated(0.1)benign(0.333)TCGA-AX-A3FT-01Endometriumuterine corpus endometrioid carcinomaFemale<65I/IIUnknownUnknownSD
SURF1SNVMissense_Mutationc.647N>Cp.Phe216Serp.F216SQ15526protein_codingdeleterious(0)probably_damaging(0.997)TCGA-B5-A11E-01Endometriumuterine corpus endometrioid carcinomaFemale<65I/IIUnknownUnknownSD
SURF1SNVMissense_Mutationnovelc.886N>Ap.Gly296Argp.G296RQ15526protein_codingtolerated(1)benign(0)TCGA-EO-A22U-01Endometriumuterine corpus endometrioid carcinomaFemale>=65I/IIUnknownUnknownSD
SURF1SNVMissense_Mutationrs782453666c.184N>Ap.Leu62Ilep.L62IQ15526protein_codingdeleterious(0.04)benign(0.076)TCGA-EO-A22U-01Endometriumuterine corpus endometrioid carcinomaFemale>=65I/IIUnknownUnknownSD
Page: 1 2 

Top

Related drugs of malignant transformation related genes

check buttonIdentification of chemicals and drugs interact with genes involved in malignant transfromation
(DGIdb 4.0)
Entrez IDSymbolCategoryInteraction TypesDrug Claim NameDrug NamePMIDs
Page: 1