Schematic overview of the cellular and molecular mechanisms involved in the cancer progression, including the proposed cellular and molecular mechanisms in cancer cells trajectory. AT1: alveolar type 1 cells; AT2: alveolar type 2 cells; AAH: atypical adenomatous hyperplasia; AIS: adenocarcinoma in situ; MIA: minimally invasive adenocarcinoma; IA: invasive adenocarcinoma; EMT: epithelial-mesenchymal transition

Home

Download

Statistics

Help

Contact

Center for Computational Systems Medicine
leaf

Gene summary

leaf

Malignant transformation analysis

leaf

Malignant transformation related pathway analysis

leaf

Cell-cell communication analysis

leaf

Single-cell gene regulatory network inference analysis

leaf

Somatic mutation of malignant transformation related genes

leaf

Related drugs of malignant transformation related genes

Gene: SULF2

Gene summary for SULF2

check button Gene summary.

Gene informationSpeciesHuman
Gene symbol

SULF2

Gene ID

55959

Gene namesulfatase 2
Gene AliasHSULF-2
Cytomap20q13.12
Gene Typeprotein-coding
GO ID

GO:0001501

UniProtAcc

Q8IWU5


Top

Malignant transformation analysis

check button Identification of the aberrant gene expression in precancerous and cancerous lesions by comparing the gene expression of stem-like cells in diseased tissues with normal stem cells
check button Malignant transformation involving gene list.
Entrez IDSymbolReplicatesSpeciesOrganTissueAdj P-valueLog2FCMalignancy
55959SULF2HTA11_3410_2000001011HumanColorectumAD1.79e-10-5.02e-010.0155
55959SULF2HTA11_866_3004761011HumanColorectumAD5.22e-06-4.10e-010.096
55959SULF2HTA11_10711_2000001011HumanColorectumAD3.83e-02-4.27e-010.0338
55959SULF2HTA11_7696_3000711011HumanColorectumAD1.17e-04-3.52e-010.0674
55959SULF2HTA11_99999970781_79442HumanColorectumMSS1.81e-08-3.39e-010.294
55959SULF2F007HumanColorectumFAP3.62e-06-4.72e-010.1176
55959SULF2A002-C-010HumanColorectumFAP1.35e-19-4.65e-010.242
55959SULF2A001-C-207HumanColorectumFAP5.79e-14-5.44e-010.1278
55959SULF2A015-C-203HumanColorectumFAP2.96e-26-5.25e-01-0.1294
55959SULF2A015-C-204HumanColorectumFAP1.02e-08-4.27e-01-0.0228
55959SULF2A014-C-040HumanColorectumFAP7.68e-05-5.69e-01-0.1184
55959SULF2A002-C-201HumanColorectumFAP6.40e-15-4.68e-010.0324
55959SULF2A002-C-203HumanColorectumFAP9.02e-17-4.98e-010.2786
55959SULF2A001-C-119HumanColorectumFAP1.90e-06-4.34e-01-0.1557
55959SULF2A001-C-108HumanColorectumFAP4.46e-21-5.13e-01-0.0272
55959SULF2A002-C-021HumanColorectumFAP1.99e-02-3.05e-010.1171
55959SULF2A002-C-205HumanColorectumFAP1.46e-21-5.58e-01-0.1236
55959SULF2A001-C-104HumanColorectumFAP2.24e-10-4.45e-010.0184
55959SULF2A015-C-005HumanColorectumFAP2.01e-11-5.06e-01-0.0336
55959SULF2A015-C-006HumanColorectumFAP1.98e-09-3.21e-01-0.0994
Page: 1 2 3 4 5 6 7 8 

check button Transcriptomic changes along malignancy continuum.
TissueExpression DynamicsAbbreviation
Colorectum (GSE201348)The image shows the transcriptomic changes along malignancy continuum.log2FC in expression of this searched gene in stem-like cells from each diseased tissue sample relative to stem-like cells in normal samples in each tissue plotted against the malignancy continuum. Samples are colored based on if they are from different disease stage.FAP: Familial adenomatous polyposis
CRC: Colorectal cancer
Colorectum (HTA11)The image shows the transcriptomic changes along malignancy continuum.log2FC in expression of this searched gene in stem-like cells from each diseased tissue sample relative to stem-like cells in normal samples in each tissue plotted against the malignancy continuum. Samples are colored based on if they are from different disease stage.AD: Adenomas
SER: Sessile serrated lesions
MSI-H: Microsatellite-high colorectal cancer
MSS: Microsatellite stable colorectal cancer
EndometriumThe image shows the transcriptomic changes along malignancy continuum.log2FC in expression of this searched gene in stem-like cells from each diseased tissue sample relative to stem-like cells in normal samples in each tissue plotted against the malignancy continuum. Samples are colored based on if they are from different disease stage.
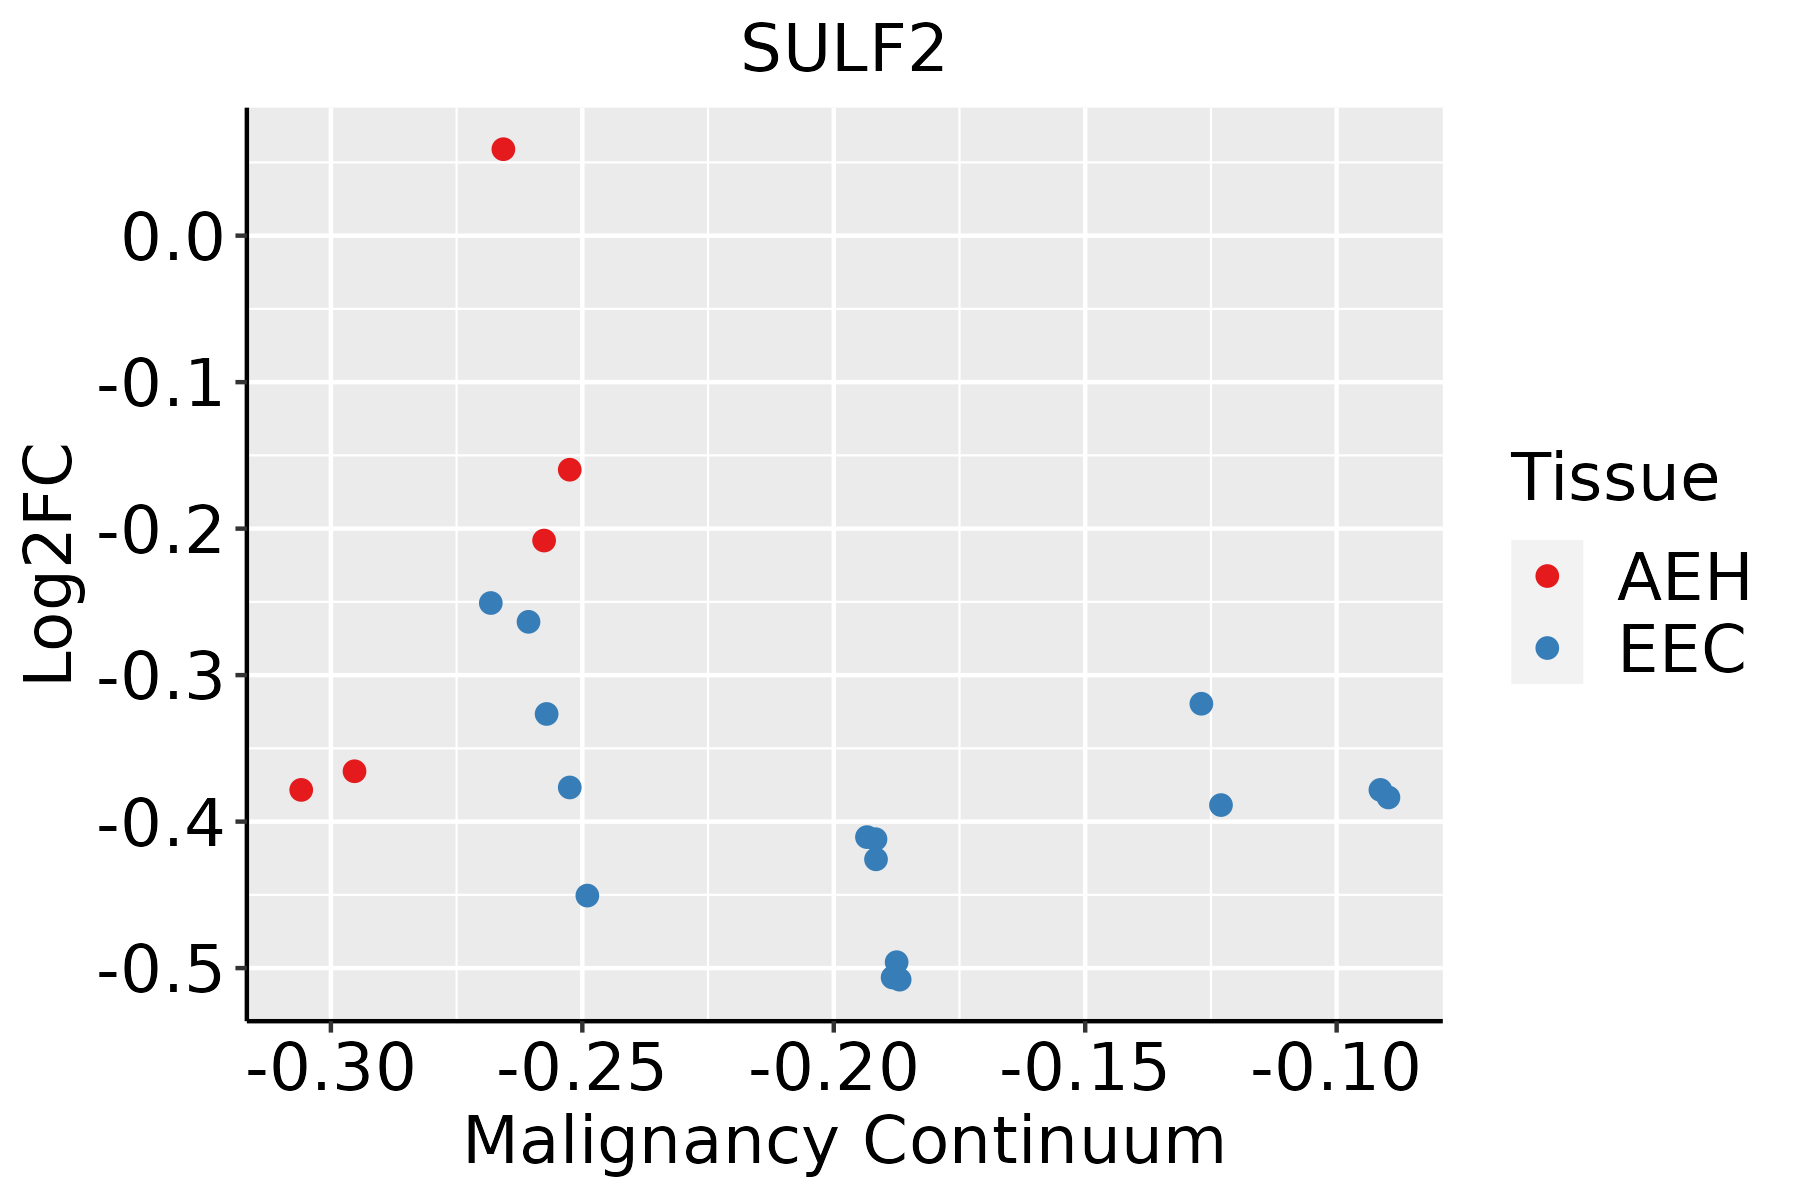
AEH: Atypical endometrial hyperplasia
EEC: Endometrioid Cancer
EsophagusThe image shows the transcriptomic changes along malignancy continuum.log2FC in expression of this searched gene in stem-like cells from each diseased tissue sample relative to stem-like cells in normal samples in each tissue plotted against the malignancy continuum. Samples are colored based on if they are from different disease stage.
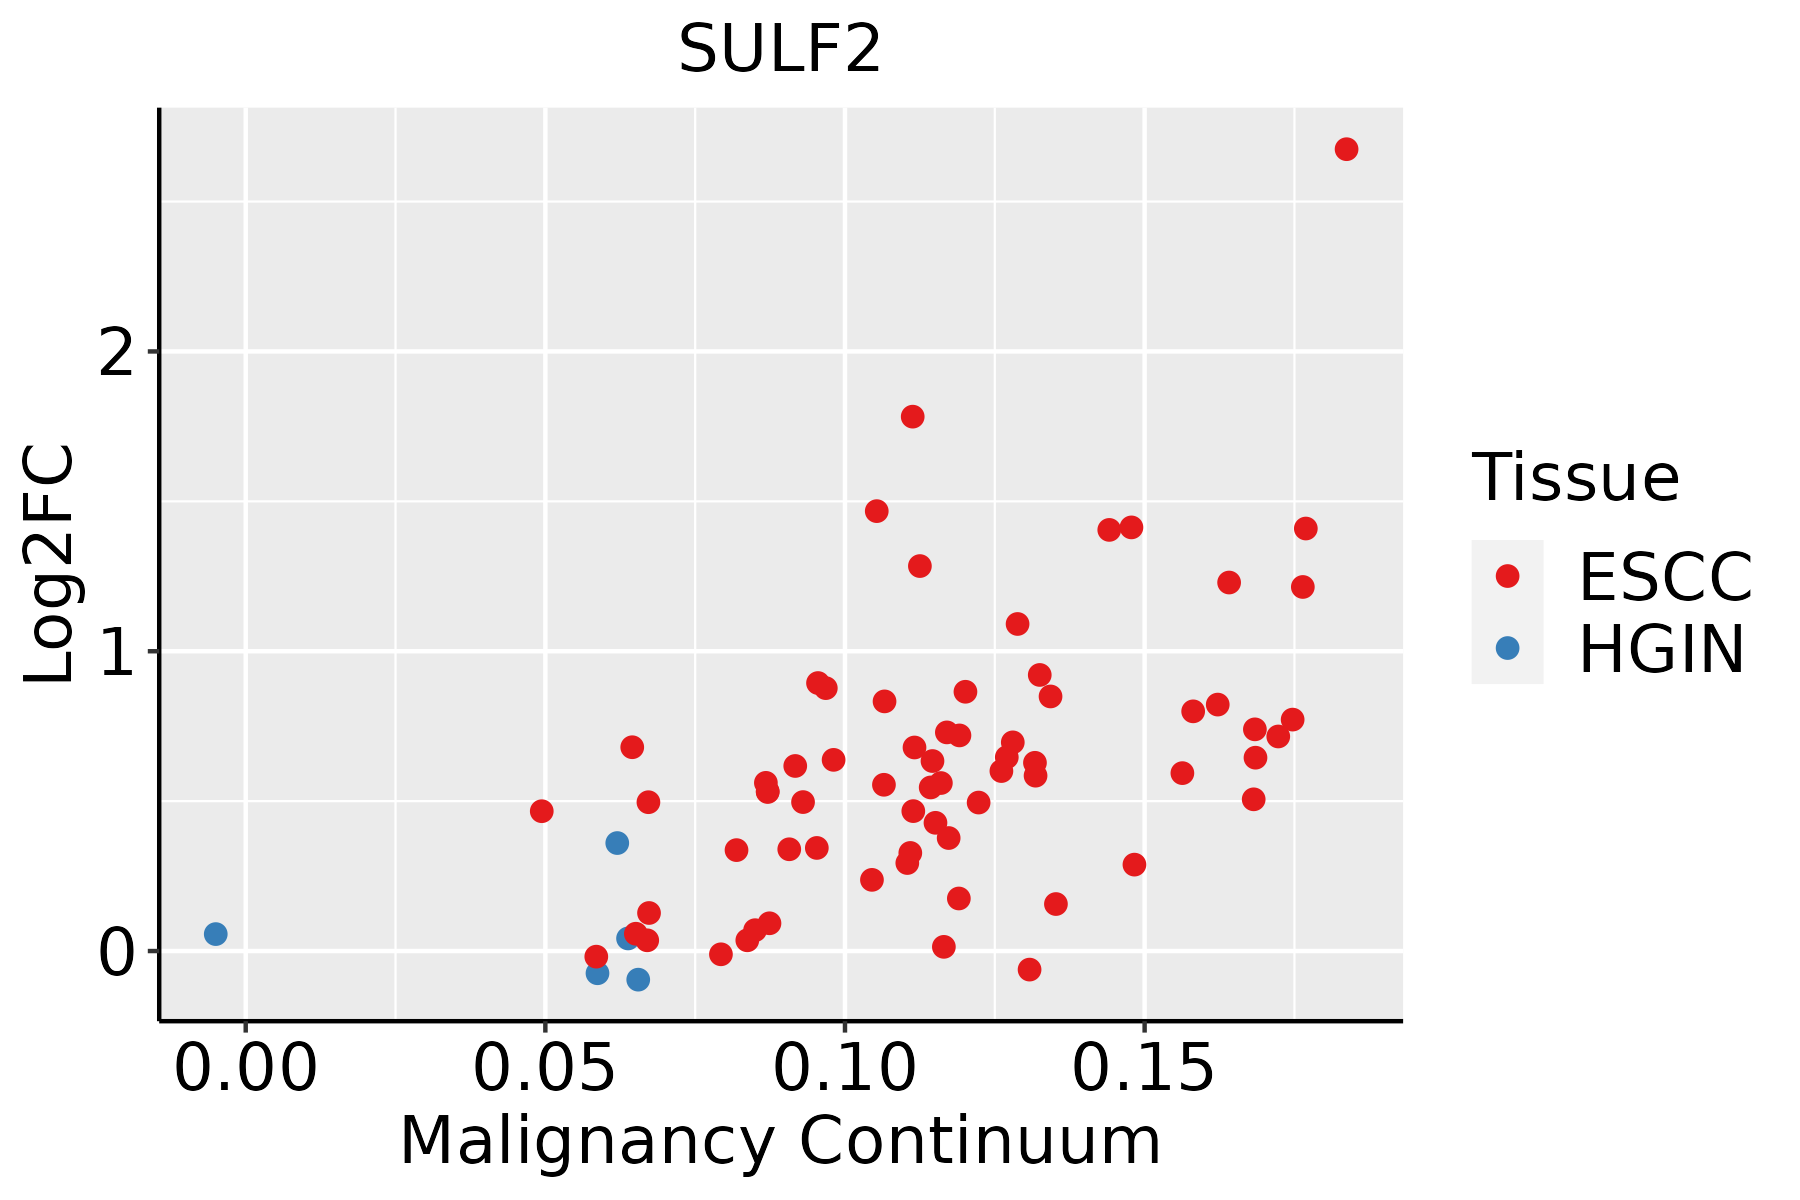
ESCC: Esophageal squamous cell carcinoma
HGIN: High-grade intraepithelial neoplasias
LGIN: Low-grade intraepithelial neoplasias
LiverThe image shows the transcriptomic changes along malignancy continuum.log2FC in expression of this searched gene in stem-like cells from each diseased tissue sample relative to stem-like cells in normal samples in each tissue plotted against the malignancy continuum. Samples are colored based on if they are from different disease stage.
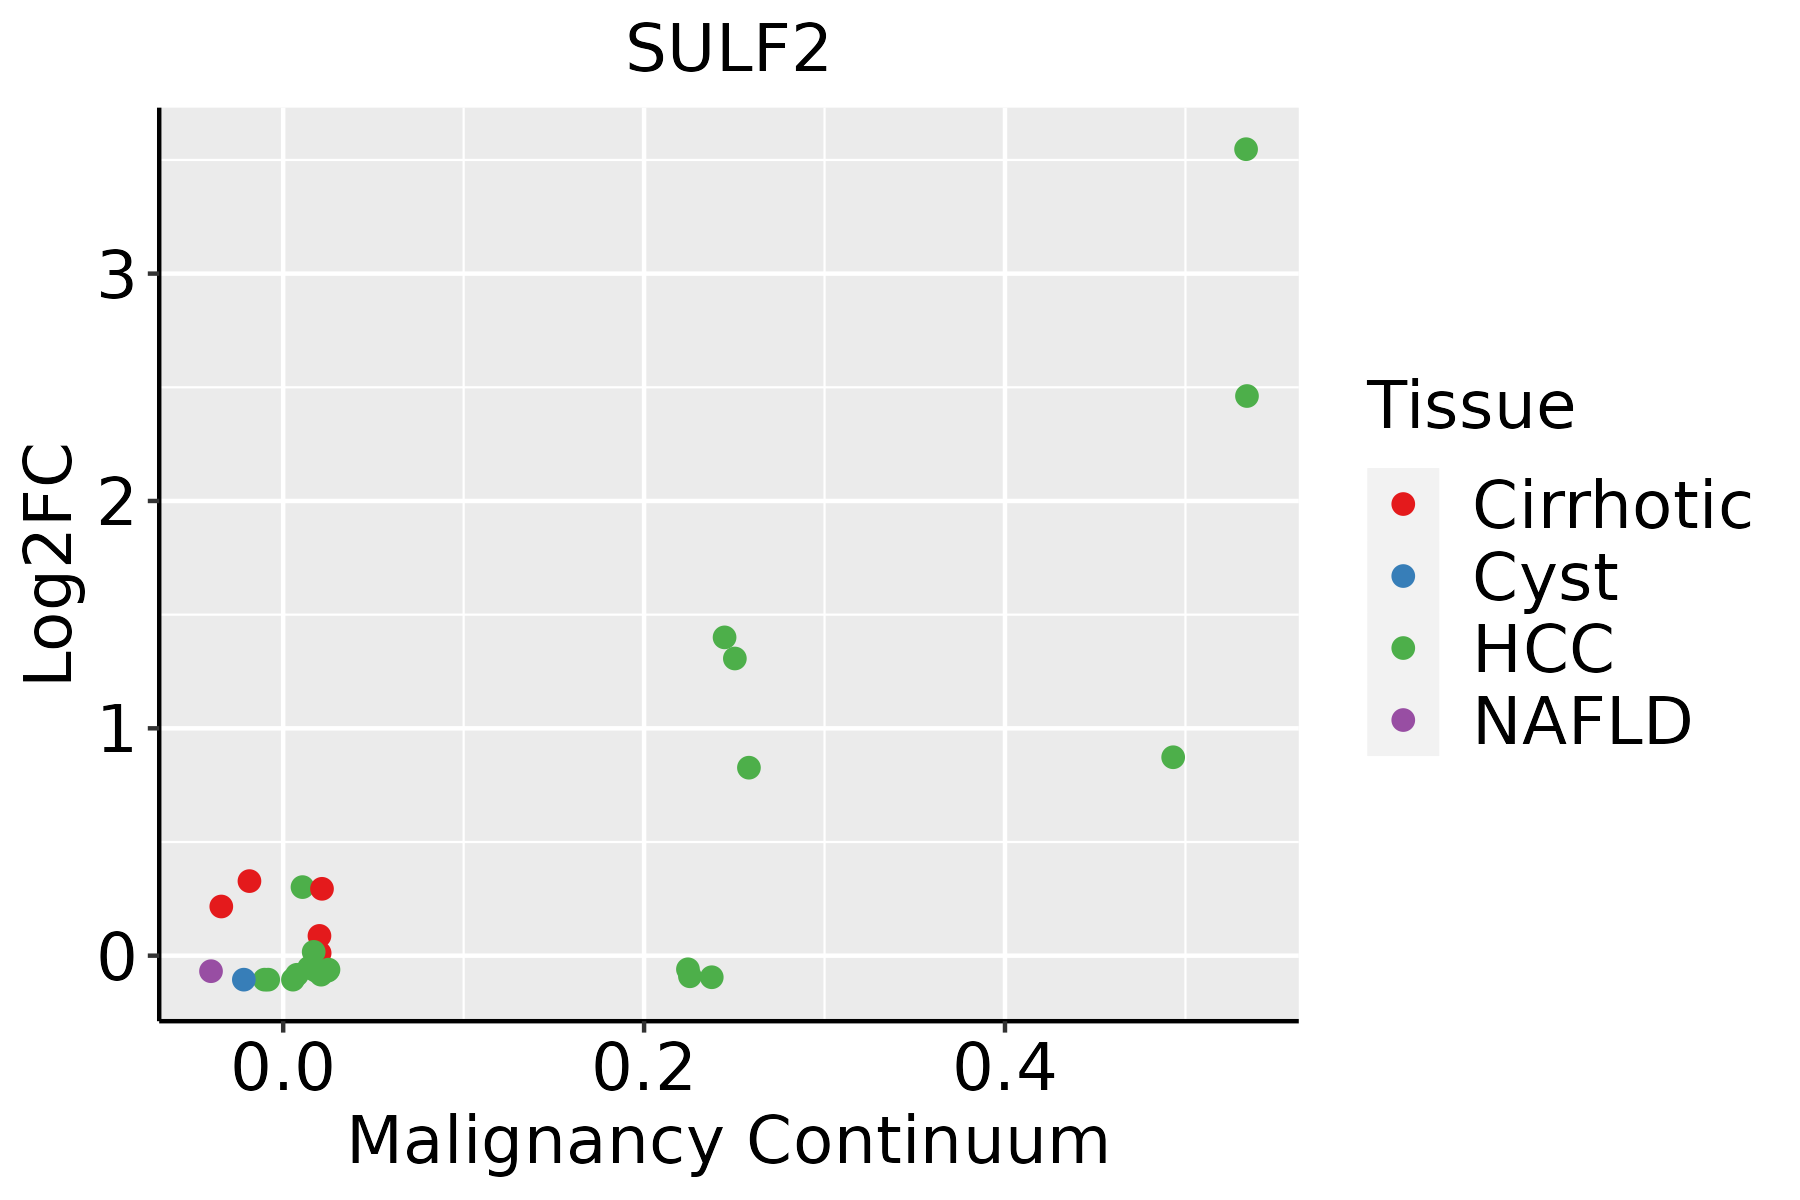
HCC: Hepatocellular carcinoma
NAFLD: Non-alcoholic fatty liver disease
Oral CavityThe image shows the transcriptomic changes along malignancy continuum.log2FC in expression of this searched gene in stem-like cells from each diseased tissue sample relative to stem-like cells in normal samples in each tissue plotted against the malignancy continuum. Samples are colored based on if they are from different disease stage.
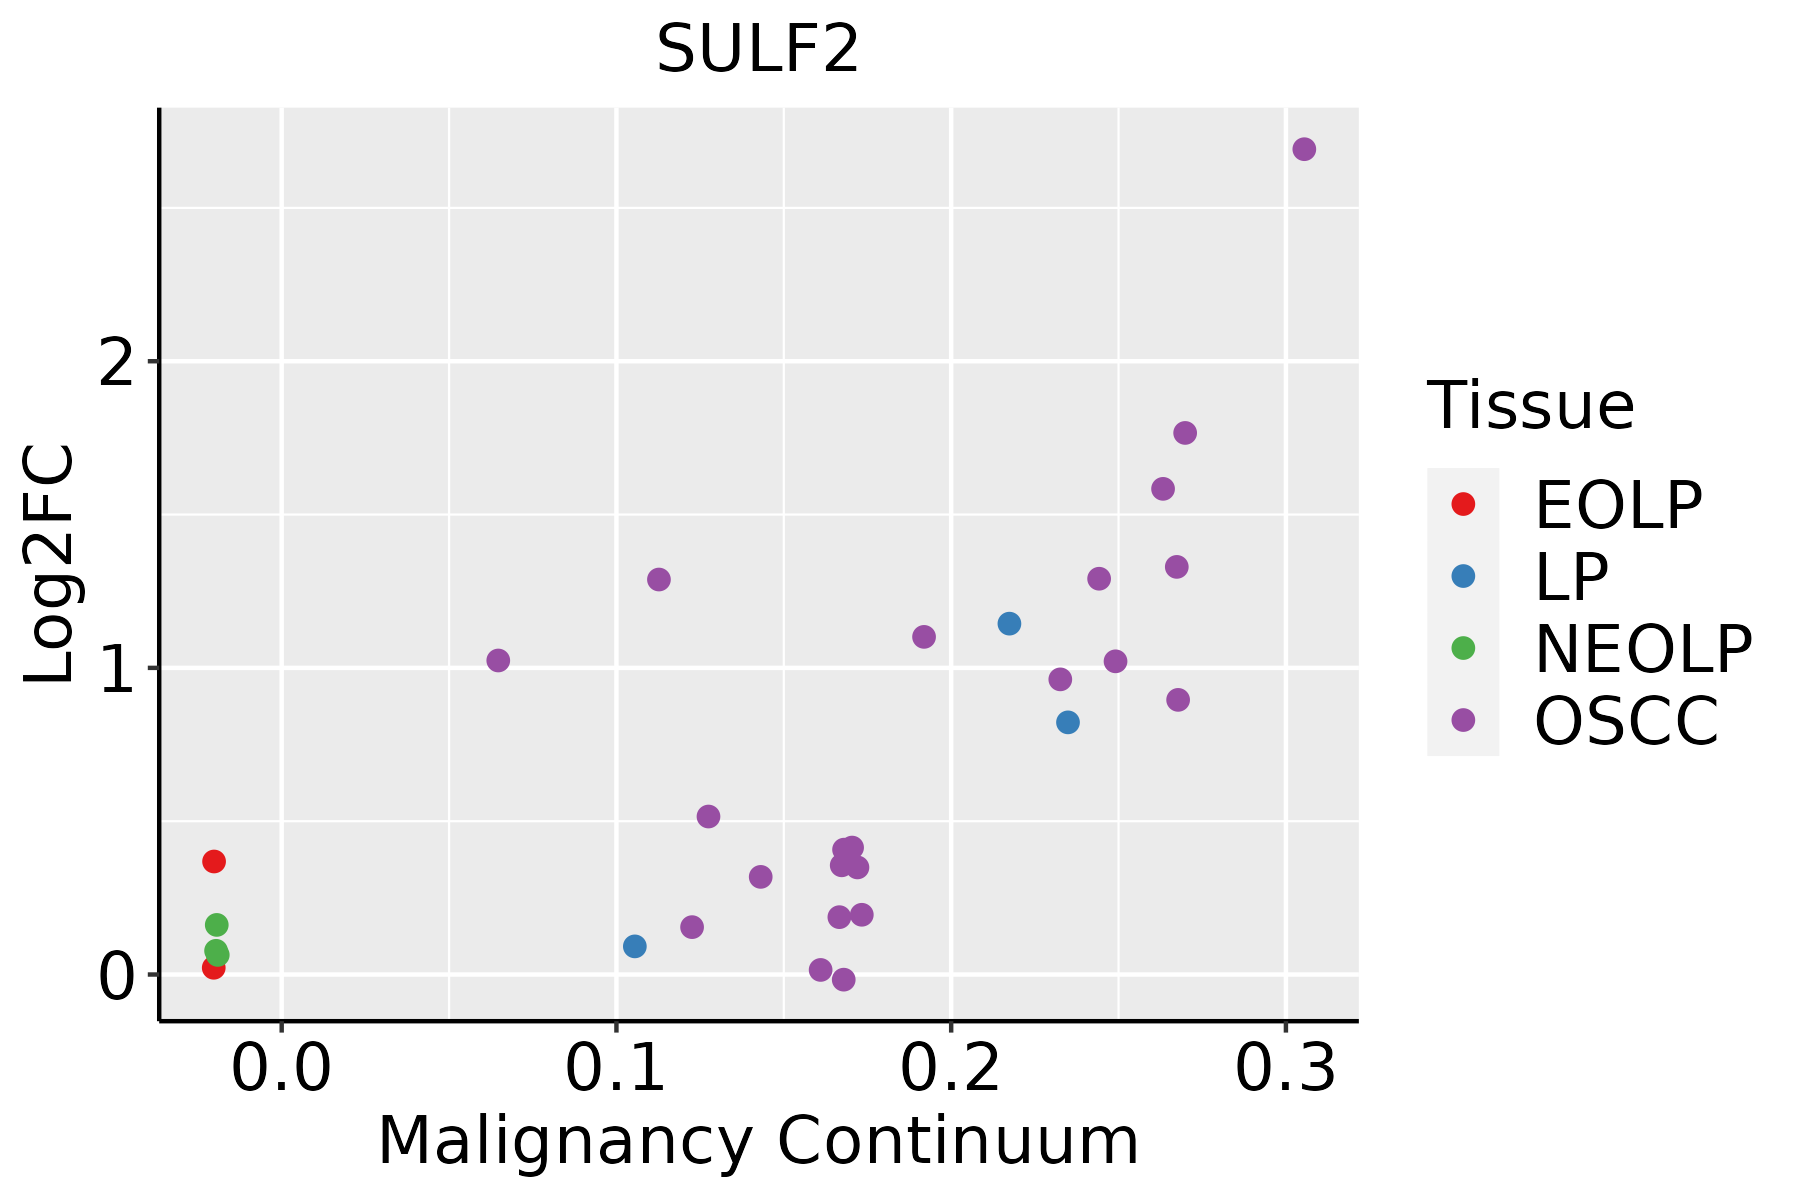
EOLP: Erosive Oral lichen planus
LP: leukoplakia
NEOLP: Non-erosive oral lichen planus
OSCC: Oral squamous cell carcinoma
SkinThe image shows the transcriptomic changes along malignancy continuum.log2FC in expression of this searched gene in stem-like cells from each diseased tissue sample relative to stem-like cells in normal samples in each tissue plotted against the malignancy continuum. Samples are colored based on if they are from different disease stage.
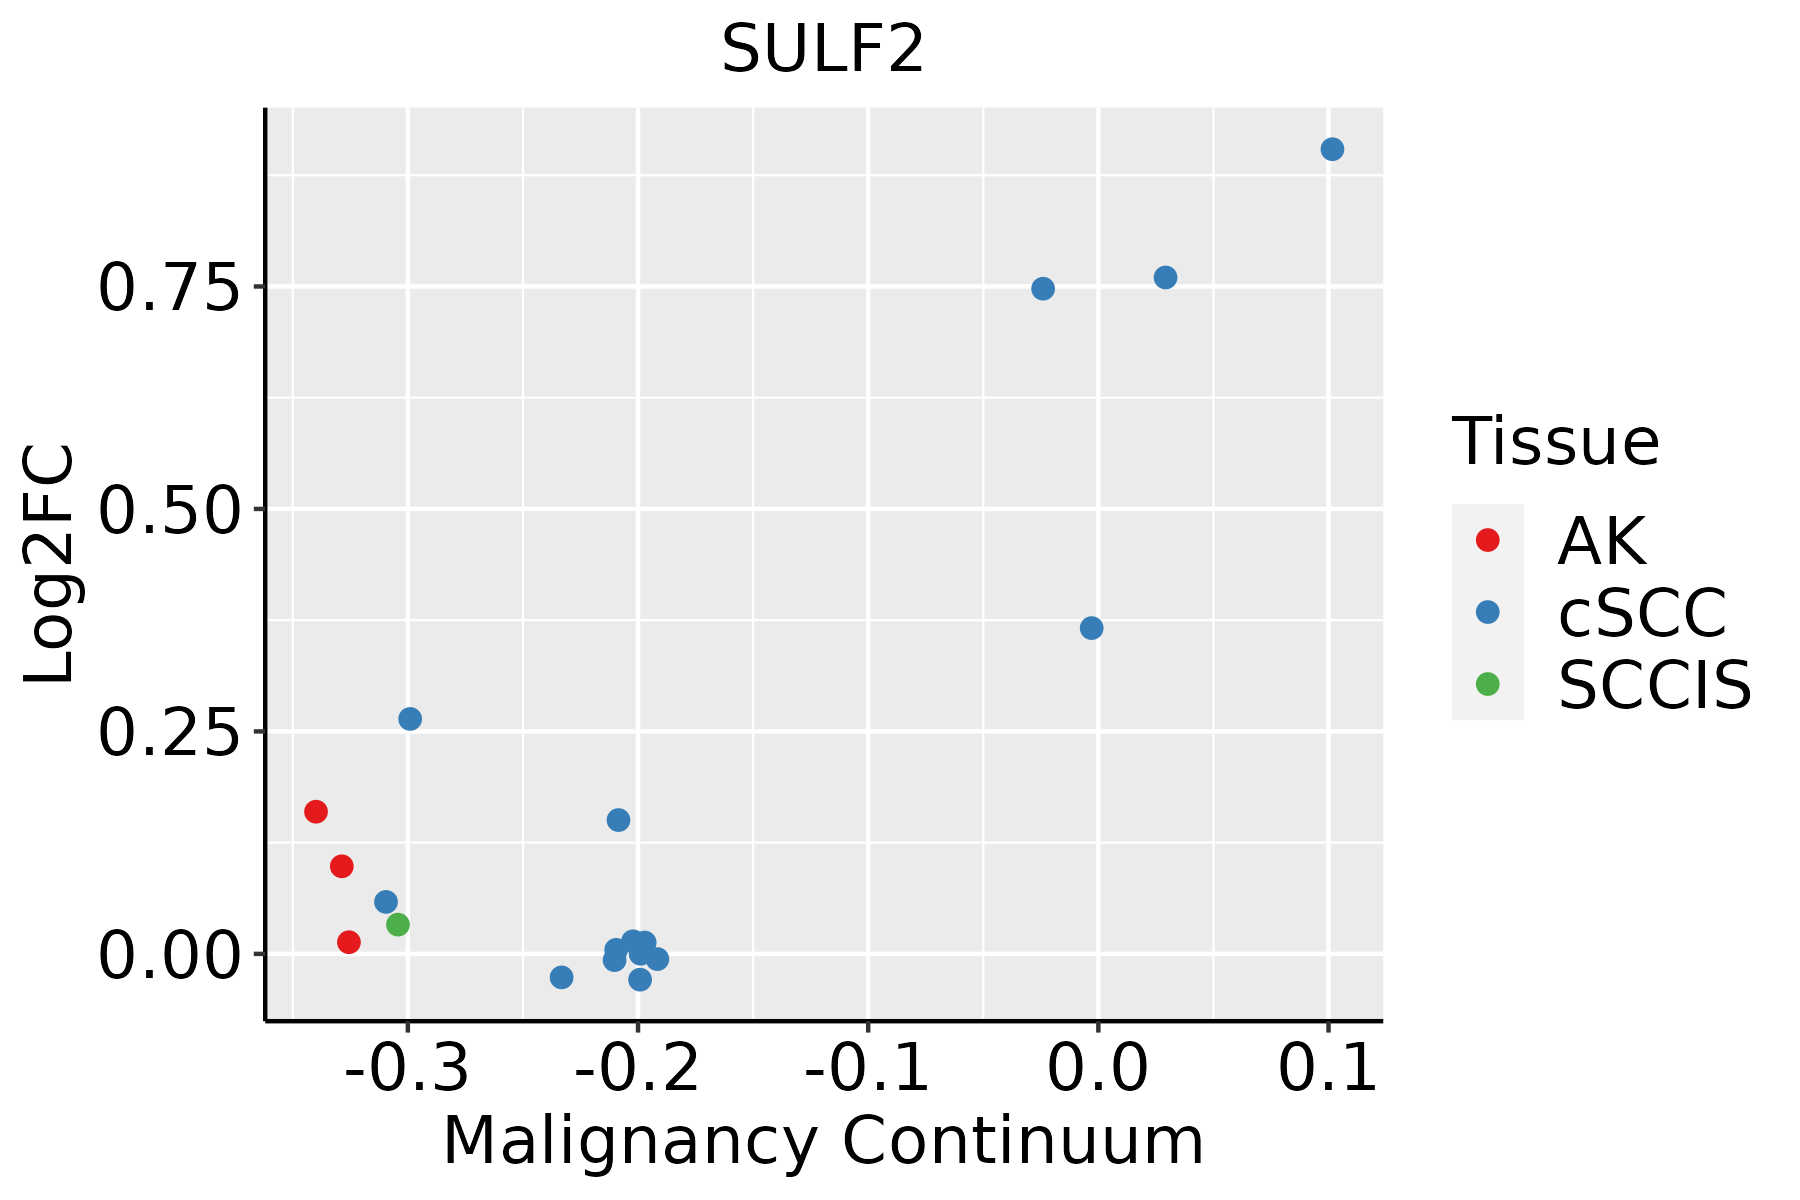
AK: Actinic keratosis
cSCC: Cutaneous squamous cell carcinoma
SCCIS:squamous cell carcinoma in situ
ThyroidThe image shows the transcriptomic changes along malignancy continuum.log2FC in expression of this searched gene in stem-like cells from each diseased tissue sample relative to stem-like cells in normal samples in each tissue plotted against the malignancy continuum. Samples are colored based on if they are from different disease stage.
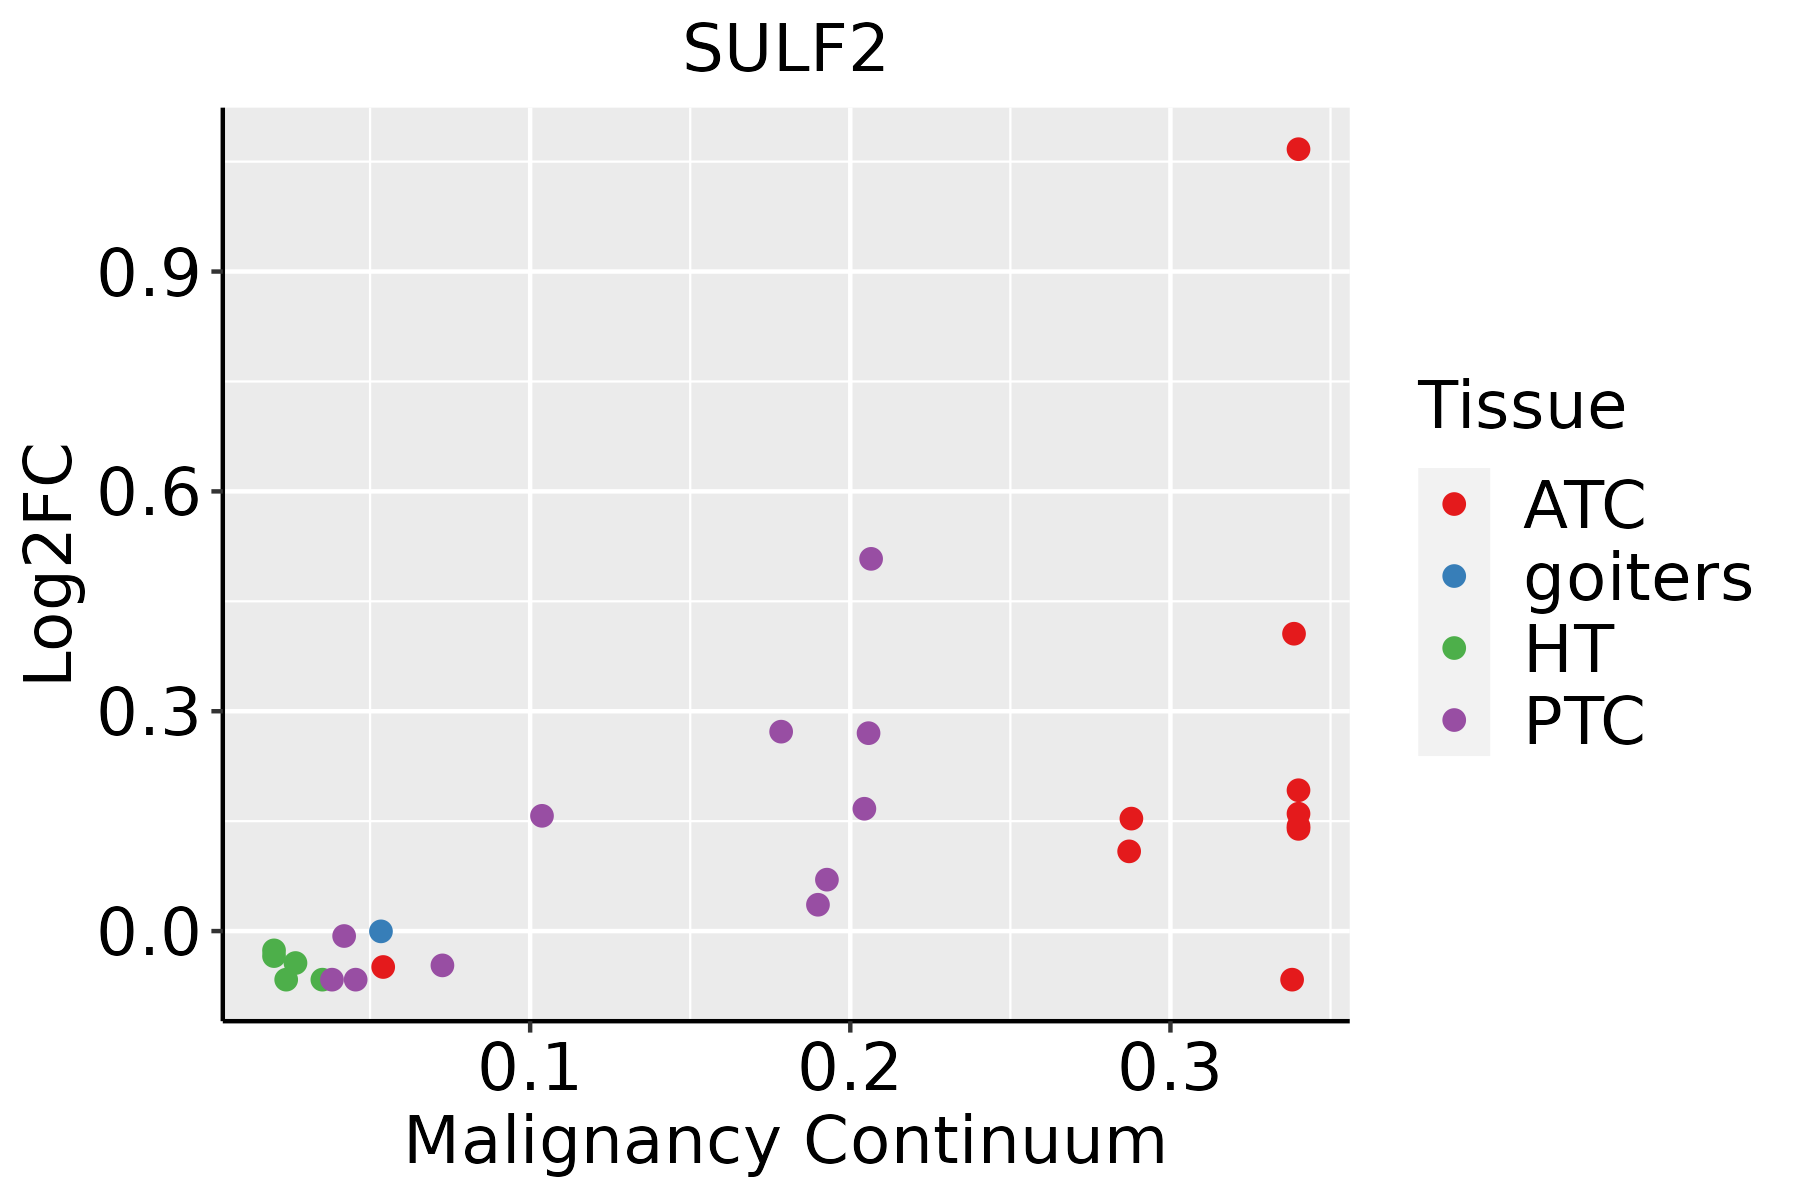
ATC: Anaplastic thyroid cancer
HT: Hashimoto's thyroiditis
PTC: Papillary thyroid cancer
∗log2FC in expression of this searched gene in stem-like cells from each diseased tissue sample relative to stem-like cells in normal samples in each tissue plotted against the malignancy continuum. Samples are colored based on if they are from different disease stage.

Top

Malignant transformation related pathway analysis

check buttonFind out the enriched GO biological processes and KEGG pathways involved in transition from healthy to precancer to cancer
check button Figure of enriched GO biological processes.
TissueDisease StageEnriched GO biological Processes
ColorectumADGO analysis - Figure of enriched GO biological processes: Top 15 enriched GO BP terms are showed in the bar plot of each disease state in each tissue. Each row represents a significant GO biological process which is colored according to the -log10(p.adjust).
ColorectumSERGO analysis - Figure of enriched GO biological processes: Top 15 enriched GO BP terms are showed in the bar plot of each disease state in each tissue. Each row represents a significant GO biological process which is colored according to the -log10(p.adjust).
ColorectumMSSGO analysis - Figure of enriched GO biological processes: Top 15 enriched GO BP terms are showed in the bar plot of each disease state in each tissue. Each row represents a significant GO biological process which is colored according to the -log10(p.adjust).
ColorectumMSI-HGO analysis - Figure of enriched GO biological processes: Top 15 enriched GO BP terms are showed in the bar plot of each disease state in each tissue. Each row represents a significant GO biological process which is colored according to the -log10(p.adjust).
ColorectumFAPGO analysis - Figure of enriched GO biological processes: Top 15 enriched GO BP terms are showed in the bar plot of each disease state in each tissue. Each row represents a significant GO biological process which is colored according to the -log10(p.adjust).
∗Top 15 enriched GO BP terms are showed in the bar plot of each disease state in each tissue. Each row represents a significant GO biological process which is colored according to the -log10(p.adjust).
Page: 1 2 3 4 5 6 7 8 9 

check button Enriched GO biological processes.
GO IDTissueDisease StageDescriptionGene RatioBg Ratiopvaluep.adjustCount
GO:00600702ColorectumMSScanonical Wnt signaling pathway86/3467303/187231.58e-053.56e-0486
GO:00608282ColorectumMSSregulation of canonical Wnt signaling pathway74/3467253/187231.99e-054.26e-0474
GO:00226122ColorectumMSSgland morphogenesis41/3467118/187232.02e-054.30e-0441
GO:00301771ColorectumMSSpositive regulation of Wnt signaling pathway44/3467140/187231.57e-042.28e-0344
GO:00974212ColorectumMSSliver regeneration16/346735/187232.07e-042.89e-0316
GO:00506731ColorectumMSSepithelial cell proliferation108/3467437/187236.76e-047.30e-03108
GO:00311001ColorectumMSSanimal organ regeneration25/346776/187231.91e-031.66e-0225
GO:00902631ColorectumMSSpositive regulation of canonical Wnt signaling pathway32/3467106/187232.41e-031.96e-0232
GO:00030121ColorectumMSSmuscle system process105/3467452/187236.39e-034.26e-02105
GO:0001655ColorectumMSSurogenital system development81/3467338/187236.88e-034.43e-0281
GO:0050678ColorectumMSSregulation of epithelial cell proliferation90/3467381/187236.92e-034.45e-0290
GO:0031099ColorectumMSSregeneration51/3467198/187236.99e-034.49e-0251
GO:00487324ColorectumFAPgland development103/2622436/187233.61e-083.12e-06103
GO:00160553ColorectumFAPWnt signaling pathway104/2622444/187234.92e-083.92e-06104
GO:01987383ColorectumFAPcell-cell signaling by wnt104/2622446/187236.26e-084.54e-06104
GO:00301113ColorectumFAPregulation of Wnt signaling pathway81/2622328/187231.44e-079.03e-0681
GO:00608283ColorectumFAPregulation of canonical Wnt signaling pathway62/2622253/187235.26e-061.69e-0462
GO:00600703ColorectumFAPcanonical Wnt signaling pathway71/2622303/187236.23e-061.96e-0471
GO:00610084ColorectumFAPhepaticobiliary system development41/2622150/187231.32e-053.55e-0441
GO:00018894ColorectumFAPliver development40/2622147/187231.88e-054.70e-0440
Page: 1 2 3 4 5 6 7 8 9 10 11 12 13 14 15 16 17 

check button Enriched KEGG pathways.
Pathway IDTissueDisease StageDescriptionGene RatioBg Ratiopvaluep.adjustqvalueCount
Page: 1 

Top

Cell-cell communication analysis

check buttonIdentification of potential cell-cell interactions between two cell types and their ligand-receptor pairs for different disease states
LigandReceptorLRpairPathwayTissueDisease Stage
Page: 1 

Top

Single-cell gene regulatory network inference analysis

check buttonFind out the significant the regulons (TFs) and the target genes of each regulon across cell types for different disease states
TFCell TypeTissueDisease StageTarget GeneRSSRegulon Activity
∗The dot plots of a searched regulon are shown for all cell subpopulations in each disease state of each tissue based on the regulon specific score inferred using pySCENIC and by calculating the average expression.
Page: 1 

Top

Somatic mutation of malignant transformation related genes

check buttonAnnotation of somatic variants for genes involved in malignant transformation
Hugo SymbolVariant ClassVariant ClassificationdbSNP RSHGVScHGVSpHGVSp ShortSWISSPROTBIOTYPESIFTPolyPhenTumor Sample BarcodeTissueHistologySexAgeStageTherapy TypesDrugsOutcome
SULF2SNVMissense_Mutationrs367871609c.518N>Tp.Thr173Metp.T173MQ8IWU5protein_codingdeleterious(0)probably_damaging(0.995)TCGA-A8-A09Z-01Breastbreast invasive carcinomaFemale>=65I/IIUnknownUnknownSD
SULF2SNVMissense_Mutationc.1203G>Cp.Leu401Phep.L401FQ8IWU5protein_codingtolerated(0.21)benign(0.035)TCGA-AC-A23H-01Breastbreast invasive carcinomaFemale>=65I/IIUnknownUnknownPD
SULF2SNVMissense_Mutationrs149787530c.1492G>Ap.Gly498Argp.G498RQ8IWU5protein_codingtolerated(0.48)benign(0.009)TCGA-AO-A128-01Breastbreast invasive carcinomaFemale<65I/IIChemotherapydoxorubicinSD
SULF2SNVMissense_Mutationrs781507832c.1181N>Ap.Arg394Glnp.R394QQ8IWU5protein_codingtolerated(0.08)benign(0.017)TCGA-BH-A0HI-01Breastbreast invasive carcinomaFemale>=65I/IIHormone TherapyarimidexSD
SULF2SNVMissense_Mutationc.955N>Ap.Gly319Serp.G319SQ8IWU5protein_codingdeleterious(0)probably_damaging(1)TCGA-D8-A1XY-01Breastbreast invasive carcinomaFemale>=65I/IIChemotherapytamoxiphenSD
SULF2insertionFrame_Shift_Insnovelc.454_455insTCCAGTTTGGGGTTATTACAAATAGCGCTGCTGAp.Tyr152PhefsTer25p.Y152Ffs*25Q8IWU5protein_codingTCGA-AN-A03X-01Breastbreast invasive carcinomaFemale>=65I/IIUnknownUnknownSD
SULF2insertionFrame_Shift_Insnovelc.511_512insGCCGGGTGTGTTGGCACATGCCTGTGGACCCAGCTACTAGAGAGp.Asn171SerfsTer24p.N171Sfs*24Q8IWU5protein_codingTCGA-AN-A0FX-01Breastbreast invasive carcinomaFemale<65I/IIUnknownUnknownSD
SULF2SNVMissense_Mutationnovelc.502N>Tp.Arg168Cysp.R168CQ8IWU5protein_codingdeleterious(0)probably_damaging(1)TCGA-2W-A8YY-01Cervixcervical & endocervical cancerFemale<65I/IIChemotherapycisplatinCR
SULF2SNVMissense_Mutationnovelc.1225N>Tp.Arg409Trpp.R409WQ8IWU5protein_codingdeleterious(0)probably_damaging(1)TCGA-EA-A410-01Cervixcervical & endocervical cancerFemale<65I/IIUnknownUnknownSD
SULF2SNVMissense_Mutationc.439N>Ap.Glu147Lysp.E147KQ8IWU5protein_codingtolerated(0.07)probably_damaging(0.998)TCGA-EK-A2PG-01Cervixcervical & endocervical cancerFemale>=65I/IIUnknownUnknownSD
Page: 1 2 3 4 5 6 7 8 9 10 

Top

Related drugs of malignant transformation related genes

check buttonIdentification of chemicals and drugs interact with genes involved in malignant transfromation
(DGIdb 4.0)
Entrez IDSymbolCategoryInteraction TypesDrug Claim NameDrug NamePMIDs
Page: 1