
|
|||||
|
 | |
| |
| |
| |
| |
| |
|
Gene: SPN |
Gene summary for SPN |
| Gene information | Species | Human | Gene symbol | SPN | Gene ID | 6693 |
| Gene name | sialophorin | |
| Gene Alias | CD43 | |
| Cytomap | 16p11.2 | |
| Gene Type | protein-coding | GO ID | GO:0001775 | UniProtAcc | A0A024R629 |
Top |
Malignant transformation analysis |
| Identification of the aberrant gene expression in precancerous and cancerous lesions by comparing the gene expression of stem-like cells in diseased tissues with normal stem cells |
| Entrez ID | Symbol | Replicates | Species | Organ | Tissue | Adj P-value | Log2FC | Malignancy |
| 6693 | SPN | HCC1 | Human | Liver | HCC | 1.44e-10 | 1.53e+00 | 0.5336 |
| 6693 | SPN | HCC2 | Human | Liver | HCC | 8.86e-28 | 2.18e+00 | 0.5341 |
| 6693 | SPN | HCC5 | Human | Liver | HCC | 4.03e-14 | 1.63e+00 | 0.4932 |
| Page: 1 |
| Tissue | Expression Dynamics | Abbreviation |
| Liver | 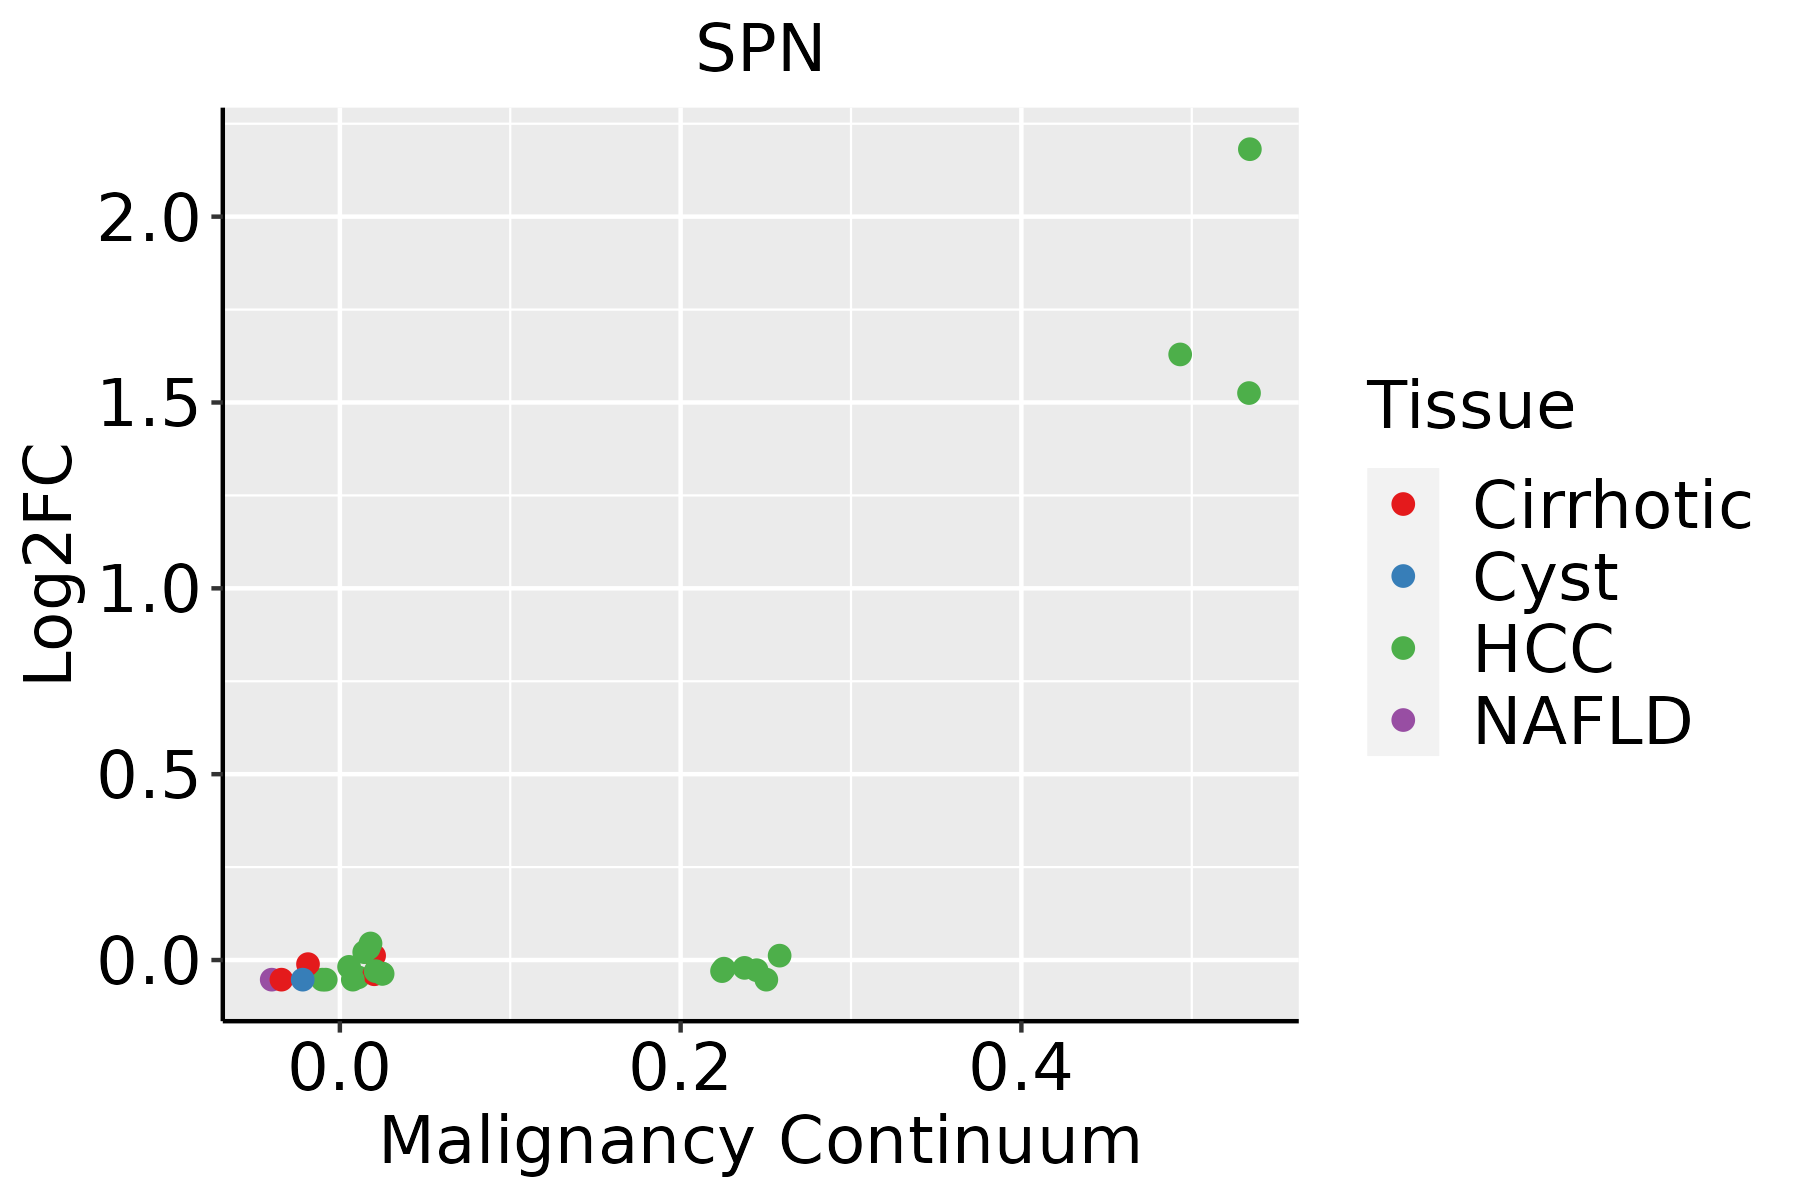 | HCC: Hepatocellular carcinoma |
| NAFLD: Non-alcoholic fatty liver disease |
| ∗log2FC in expression of this searched gene in stem-like cells from each diseased tissue sample relative to stem-like cells in normal samples in each tissue plotted against the malignancy continuum. Samples are colored based on if they are from different disease stage. |
Top |
Malignant transformation related pathway analysis |
| Find out the enriched GO biological processes and KEGG pathways involved in transition from healthy to precancer to cancer |
| Tissue | Disease Stage | Enriched GO biological Processes |
| Colorectum | AD |  |
| Colorectum | SER |  |
| Colorectum | MSS |  |
| Colorectum | MSI-H |  |
| Colorectum | FAP |  |
| ∗Top 15 enriched GO BP terms are showed in the bar plot of each disease state in each tissue. Each row represents a significant GO biological process which is colored according to the -log10(p.adjust). |
| Page: 1 2 3 4 5 6 7 8 9 |
| GO ID | Tissue | Disease Stage | Description | Gene Ratio | Bg Ratio | pvalue | p.adjust | Count |
| GO:19019883 | Esophagus | ESCC | negative regulation of cell cycle phase transition | 151/8552 | 249/18723 | 1.28e-06 | 1.57e-05 | 151 |
| GO:0048872111 | Esophagus | ESCC | homeostasis of number of cells | 163/8552 | 272/18723 | 1.40e-06 | 1.69e-05 | 163 |
| GO:00715609 | Esophagus | ESCC | cellular response to transforming growth factor beta stimulus | 151/8552 | 250/18723 | 1.78e-06 | 2.10e-05 | 151 |
| GO:004593013 | Esophagus | ESCC | negative regulation of mitotic cell cycle | 143/8552 | 235/18723 | 1.84e-06 | 2.15e-05 | 143 |
| GO:000150317 | Esophagus | ESCC | ossification | 232/8552 | 408/18723 | 3.00e-06 | 3.40e-05 | 232 |
| GO:00182099 | Esophagus | ESCC | peptidyl-serine modification | 196/8552 | 338/18723 | 3.07e-06 | 3.47e-05 | 196 |
| GO:001810515 | Esophagus | ESCC | peptidyl-serine phosphorylation | 184/8552 | 315/18723 | 3.22e-06 | 3.61e-05 | 184 |
| GO:190199113 | Esophagus | ESCC | negative regulation of mitotic cell cycle phase transition | 112/8552 | 179/18723 | 3.69e-06 | 4.03e-05 | 112 |
| GO:005101727 | Esophagus | ESCC | actin filament bundle assembly | 100/8552 | 157/18723 | 3.87e-06 | 4.17e-05 | 100 |
| GO:004586018 | Esophagus | ESCC | positive regulation of protein kinase activity | 219/8552 | 386/18723 | 6.91e-06 | 6.97e-05 | 219 |
| GO:00464673 | Esophagus | ESCC | membrane lipid biosynthetic process | 91/8552 | 142/18723 | 7.19e-06 | 7.19e-05 | 91 |
| GO:003367420 | Esophagus | ESCC | positive regulation of kinase activity | 260/8552 | 467/18723 | 7.26e-06 | 7.22e-05 | 260 |
| GO:00071799 | Esophagus | ESCC | transforming growth factor beta receptor signaling pathway | 121/8552 | 198/18723 | 8.26e-06 | 8.03e-05 | 121 |
| GO:00103891 | Esophagus | ESCC | regulation of G2/M transition of mitotic cell cycle | 64/8552 | 94/18723 | 9.21e-06 | 8.82e-05 | 64 |
| GO:006157227 | Esophagus | ESCC | actin filament bundle organization | 101/8552 | 161/18723 | 9.22e-06 | 8.82e-05 | 101 |
| GO:19027491 | Esophagus | ESCC | regulation of cell cycle G2/M phase transition | 68/8552 | 102/18723 | 1.48e-05 | 1.33e-04 | 68 |
| GO:00066652 | Esophagus | ESCC | sphingolipid metabolic process | 96/8552 | 155/18723 | 3.21e-05 | 2.66e-04 | 96 |
| GO:004477312 | Esophagus | ESCC | mitotic DNA damage checkpoint | 54/8552 | 81/18723 | 1.09e-04 | 7.64e-04 | 54 |
| GO:00447745 | Esophagus | ESCC | mitotic DNA integrity checkpoint | 56/8552 | 85/18723 | 1.34e-04 | 9.09e-04 | 56 |
| GO:000717810 | Esophagus | ESCC | transmembrane receptor protein serine/threonine kinase signaling pathway | 195/8552 | 355/18723 | 2.58e-04 | 1.58e-03 | 195 |
| Page: 1 2 3 4 5 6 7 8 9 |
| Pathway ID | Tissue | Disease Stage | Description | Gene Ratio | Bg Ratio | pvalue | p.adjust | qvalue | Count |
| Page: 1 |
Top |
Cell-cell communication analysis |
| Identification of potential cell-cell interactions between two cell types and their ligand-receptor pairs for different disease states |
| Ligand | Receptor | LRpair | Pathway | Tissue | Disease Stage |
| ICAM1 | SPN | ICAM1_SPN | ICAM | Breast | ADJ |
| ICAM1 | SPN | ICAM1_SPN | ICAM | Breast | DCIS |
| SIGLEC1 | SPN | SIGLEC1_SPN | SN | Breast | DCIS |
| ICAM1 | SPN | ICAM1_SPN | ICAM | Breast | Healthy |
| SIGLEC1 | SPN | SIGLEC1_SPN | SN | Breast | Healthy |
| ICAM1 | SPN | ICAM1_SPN | ICAM | Breast | IDC |
| SIGLEC1 | SPN | SIGLEC1_SPN | SN | Breast | IDC |
| ICAM1 | SPN | ICAM1_SPN | ICAM | Cervix | ADJ |
| ICAM1 | SPN | ICAM1_SPN | ICAM | Cervix | CC |
| SIGLEC1 | SPN | SIGLEC1_SPN | SN | Cervix | CC |
| ICAM1 | SPN | ICAM1_SPN | ICAM | Cervix | Precancer |
| ICAM1 | SPN | ICAM1_SPN | ICAM | Endometrium | ADJ |
| ICAM1 | SPN | ICAM1_SPN | ICAM | Endometrium | AEH |
| ICAM1 | SPN | ICAM1_SPN | ICAM | Endometrium | Healthy |
| ICAM1 | SPN | ICAM1_SPN | ICAM | Esophagus | ESCC |
| ICAM1 | SPN | ICAM1_SPN | ICAM | HNSCC | ADJ |
| SIGLEC1 | SPN | SIGLEC1_SPN | SN | HNSCC | ADJ |
| ICAM1 | SPN | ICAM1_SPN | ICAM | HNSCC | Healthy |
| ICAM1 | SPN | ICAM1_SPN | ICAM | HNSCC | OSCC |
| SIGLEC1 | SPN | SIGLEC1_SPN | SN | HNSCC | OSCC |
| Page: 1 |
Top |
Single-cell gene regulatory network inference analysis |
| Find out the significant the regulons (TFs) and the target genes of each regulon across cell types for different disease states |
| TF | Cell Type | Tissue | Disease Stage | Target Gene | RSS | Regulon Activity |
| ∗The dot plots of a searched regulon are shown for all cell subpopulations in each disease state of each tissue based on the regulon specific score inferred using pySCENIC and by calculating the average expression. |
| Page: 1 |
Top |
Somatic mutation of malignant transformation related genes |
| Annotation of somatic variants for genes involved in malignant transformation |
| Hugo Symbol | Variant Class | Variant Classification | dbSNP RS | HGVSc | HGVSp | HGVSp Short | SWISSPROT | BIOTYPE | SIFT | PolyPhen | Tumor Sample Barcode | Tissue | Histology | Sex | Age | Stage | Therapy Types | Drugs | Outcome |
| SPN | SNV | Missense_Mutation | c.475N>C | p.Glu159Gln | p.E159Q | P16150 | protein_coding | deleterious(0.04) | benign(0.144) | TCGA-A8-A08L-01 | Breast | breast invasive carcinoma | Female | >=65 | III/IV | Unknown | Unknown | SD | |
| SPN | SNV | Missense_Mutation | c.745G>C | p.Asp249His | p.D249H | P16150 | protein_coding | tolerated(0.19) | benign(0.017) | TCGA-Q1-A73O-01 | Cervix | cervical & endocervical cancer | Female | <65 | I/II | Chemotherapy | cisplatin | CR | |
| SPN | SNV | Missense_Mutation | c.230N>A | p.Leu77His | p.L77H | P16150 | protein_coding | tolerated(0.55) | benign(0.275) | TCGA-A6-5661-01 | Colorectum | colon adenocarcinoma | Female | >=65 | I/II | Unknown | Unknown | SD | |
| SPN | SNV | Missense_Mutation | rs756568331 | c.419C>T | p.Pro140Leu | p.P140L | P16150 | protein_coding | tolerated(1) | benign(0) | TCGA-AD-6895-01 | Colorectum | colon adenocarcinoma | Male | >=65 | III/IV | Unknown | Unknown | SD |
| SPN | SNV | Missense_Mutation | rs868529835 | c.736C>T | p.Arg246Trp | p.R246W | P16150 | protein_coding | deleterious(0.02) | possibly_damaging(0.533) | TCGA-CA-6717-01 | Colorectum | colon adenocarcinoma | Male | <65 | I/II | Chemotherapy | oxaliplatin | CR |
| SPN | SNV | Missense_Mutation | rs779631820 | c.833N>A | p.Arg278His | p.R278H | P16150 | protein_coding | tolerated(0.08) | benign(0.061) | TCGA-D5-6928-01 | Colorectum | colon adenocarcinoma | Male | >=65 | I/II | Unknown | Unknown | SD |
| SPN | SNV | Missense_Mutation | rs181483014 | c.737G>A | p.Arg246Gln | p.R246Q | P16150 | protein_coding | tolerated(0.62) | benign(0.006) | TCGA-NH-A5IV-01 | Colorectum | colon adenocarcinoma | Female | >=65 | I/II | Unknown | Unknown | SD |
| SPN | SNV | Missense_Mutation | c.49G>A | p.Ala17Thr | p.A17T | P16150 | protein_coding | tolerated(0.15) | benign(0.003) | TCGA-AH-6643-01 | Colorectum | rectum adenocarcinoma | Male | <65 | III/IV | Chemotherapy | oxaliplatin | PD | |
| SPN | SNV | Missense_Mutation | novel | c.610N>T | p.Pro204Ser | p.P204S | P16150 | protein_coding | tolerated(0.14) | benign(0.013) | TCGA-A5-A0G1-01 | Endometrium | uterine corpus endometrioid carcinoma | Female | >=65 | I/II | Unknown | Unknown | SD |
| SPN | SNV | Missense_Mutation | c.742C>A | p.Pro248Thr | p.P248T | P16150 | protein_coding | deleterious(0.04) | possibly_damaging(0.496) | TCGA-A5-A0GB-01 | Endometrium | uterine corpus endometrioid carcinoma | Female | >=65 | I/II | Unknown | Unknown | SD |
| Page: 1 2 3 4 |
Top |
Related drugs of malignant transformation related genes |
| Identification of chemicals and drugs interact with genes involved in malignant transfromation |
| (DGIdb 4.0) |
| Entrez ID | Symbol | Category | Interaction Types | Drug Claim Name | Drug Name | PMIDs |
| Page: 1 |

Copyright 2023-Present -The University of Texas Health Science Center at Houston |