
|
|||||
|
 | |
| |
| |
| |
| |
| |
|
Gene: SOX17 |
Gene summary for SOX17 |
| Gene information | Species | Human | Gene symbol | SOX17 | Gene ID | 64321 |
| Gene name | SRY-box transcription factor 17 | |
| Gene Alias | VUR3 | |
| Cytomap | 8q11.23 | |
| Gene Type | protein-coding | GO ID | GO:0000003 | UniProtAcc | Q9H6I2 |
Top |
Malignant transformation analysis |
| Identification of the aberrant gene expression in precancerous and cancerous lesions by comparing the gene expression of stem-like cells in diseased tissues with normal stem cells |
| Entrez ID | Symbol | Replicates | Species | Organ | Tissue | Adj P-value | Log2FC | Malignancy |
| 64321 | SOX17 | AEH-subject3 | Human | Endometrium | AEH | 1.35e-05 | 4.51e-01 | -0.2576 |
| 64321 | SOX17 | EEC-subject3 | Human | Endometrium | EEC | 1.12e-04 | -3.65e-03 | -0.2525 |
| 64321 | SOX17 | GSM5276934 | Human | Endometrium | EEC | 5.47e-13 | -5.30e-01 | -0.0913 |
| 64321 | SOX17 | GSM5276935 | Human | Endometrium | EEC | 5.66e-08 | 3.42e-01 | -0.123 |
| 64321 | SOX17 | GSM5276937 | Human | Endometrium | EEC | 2.85e-09 | -5.16e-01 | -0.0897 |
| 64321 | SOX17 | GSM6177620_NYU_UCEC1_lib1_lib1 | Human | Endometrium | EEC | 1.33e-06 | -4.17e-02 | -0.1869 |
| 64321 | SOX17 | GSM6177620_NYU_UCEC1_lib2_lib2 | Human | Endometrium | EEC | 7.42e-07 | -1.16e-01 | -0.1875 |
| 64321 | SOX17 | GSM6177620_NYU_UCEC1_lib3_lib3 | Human | Endometrium | EEC | 2.83e-06 | -1.01e-02 | -0.1883 |
| 64321 | SOX17 | GSM6177621_NYU_UCEC2_lib1_lib1 | Human | Endometrium | EEC | 2.06e-42 | 8.78e-01 | -0.1934 |
| 64321 | SOX17 | GSM6177622_NYU_UCEC3_lib1_lib1 | Human | Endometrium | EEC | 9.05e-10 | 8.27e-02 | -0.1917 |
| 64321 | SOX17 | GSM6177622_NYU_UCEC3_lib2_lib2 | Human | Endometrium | EEC | 3.89e-13 | 7.92e-02 | -0.1916 |
| Page: 1 |
| Tissue | Expression Dynamics | Abbreviation |
| Endometrium | 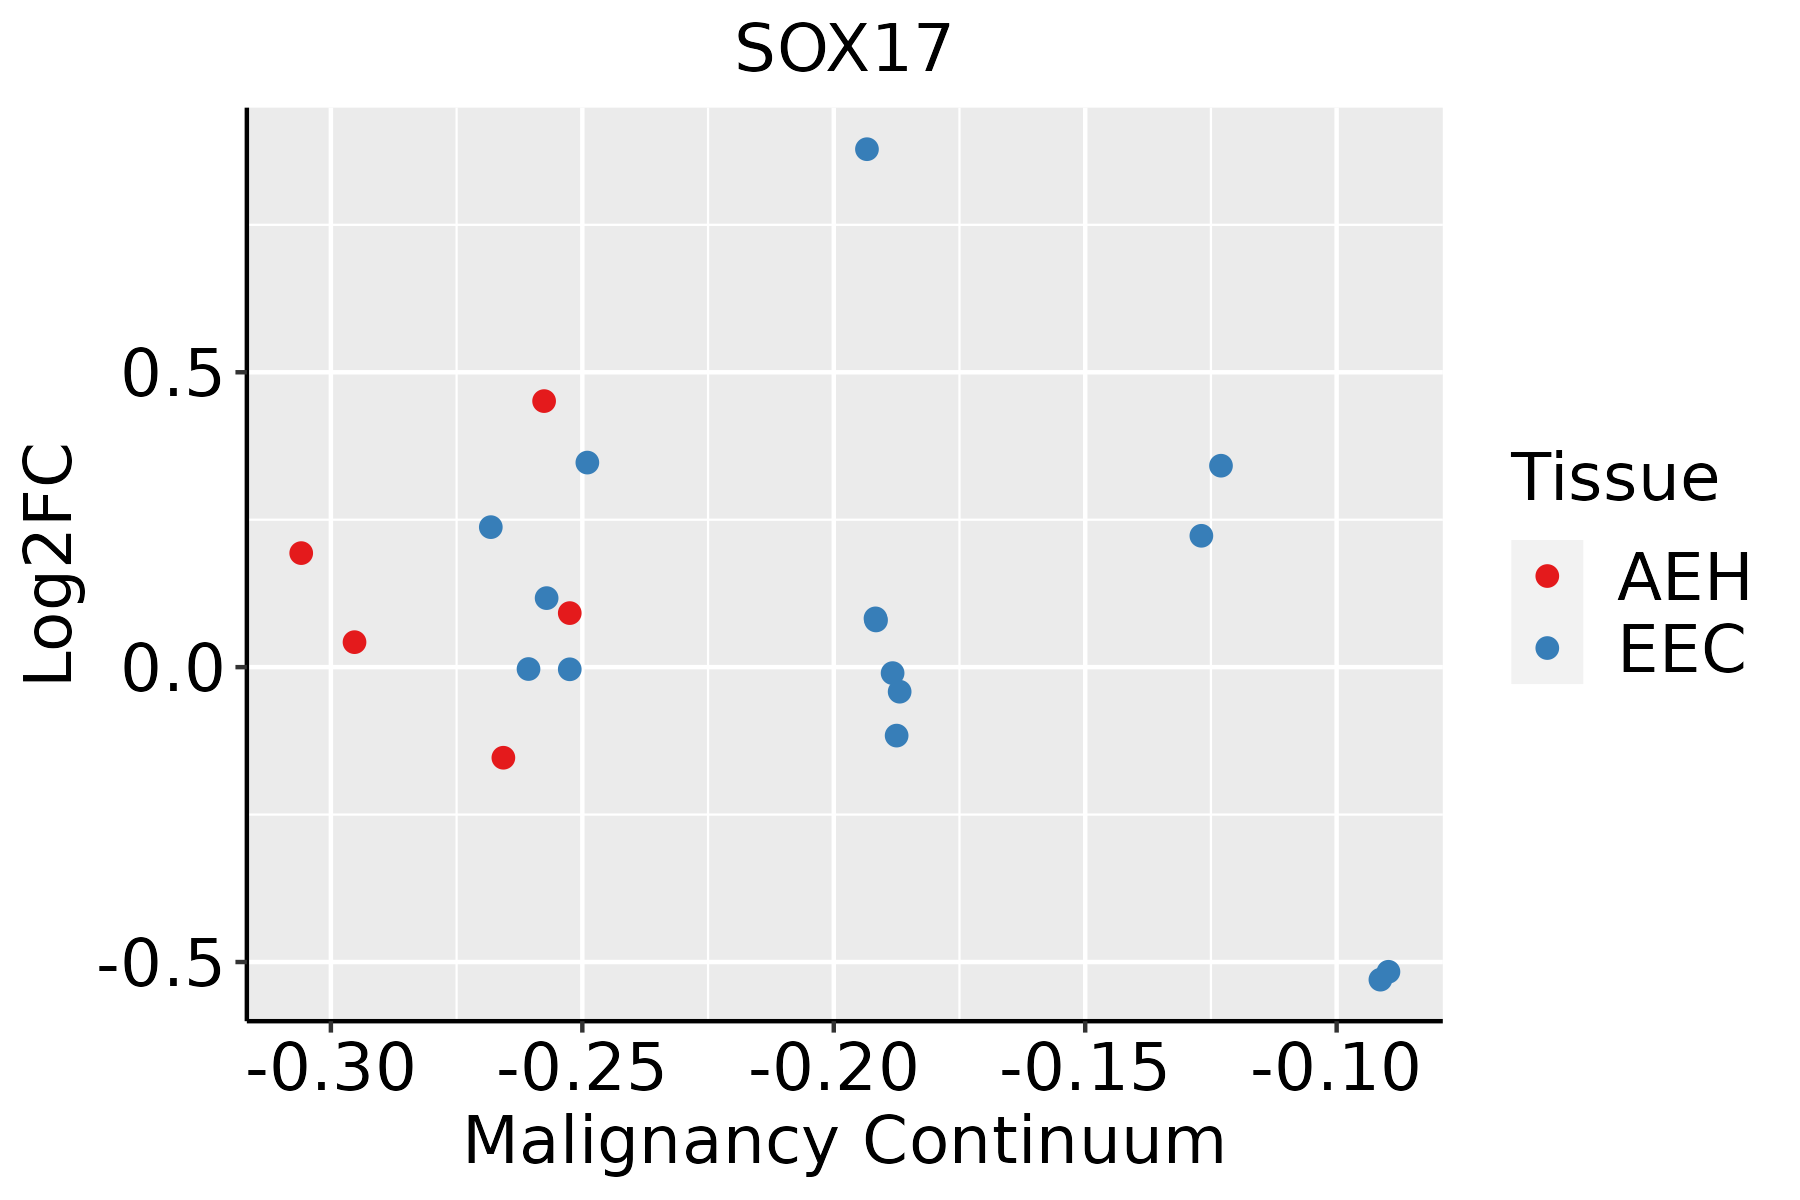 | AEH: Atypical endometrial hyperplasia |
| EEC: Endometrioid Cancer |
| ∗log2FC in expression of this searched gene in stem-like cells from each diseased tissue sample relative to stem-like cells in normal samples in each tissue plotted against the malignancy continuum. Samples are colored based on if they are from different disease stage. |
Top |
Malignant transformation related pathway analysis |
| Find out the enriched GO biological processes and KEGG pathways involved in transition from healthy to precancer to cancer |
| Tissue | Disease Stage | Enriched GO biological Processes |
| Colorectum | AD |  |
| Colorectum | SER |  |
| Colorectum | MSS |  |
| Colorectum | MSI-H |  |
| Colorectum | FAP |  |
| ∗Top 15 enriched GO BP terms are showed in the bar plot of each disease state in each tissue. Each row represents a significant GO biological process which is colored according to the -log10(p.adjust). |
| Page: 1 2 3 4 5 6 7 8 9 |
| GO ID | Tissue | Disease Stage | Description | Gene Ratio | Bg Ratio | pvalue | p.adjust | Count |
| GO:00459956 | Endometrium | AEH | regulation of embryonic development | 18/2100 | 64/18723 | 1.65e-04 | 2.15e-03 | 18 |
| GO:00459264 | Endometrium | AEH | negative regulation of growth | 47/2100 | 249/18723 | 2.36e-04 | 2.84e-03 | 47 |
| GO:19908235 | Endometrium | AEH | response to leukemia inhibitory factor | 23/2100 | 95/18723 | 2.65e-04 | 3.09e-03 | 23 |
| GO:00488635 | Endometrium | AEH | stem cell differentiation | 40/2100 | 206/18723 | 3.67e-04 | 3.99e-03 | 40 |
| GO:006100810 | Endometrium | AEH | hepaticobiliary system development | 31/2100 | 150/18723 | 5.41e-04 | 5.45e-03 | 31 |
| GO:00301785 | Endometrium | AEH | negative regulation of Wnt signaling pathway | 34/2100 | 170/18723 | 5.63e-04 | 5.62e-03 | 34 |
| GO:19908305 | Endometrium | AEH | cellular response to leukemia inhibitory factor | 22/2100 | 94/18723 | 5.89e-04 | 5.82e-03 | 22 |
| GO:00030072 | Endometrium | AEH | heart morphogenesis | 45/2100 | 246/18723 | 6.41e-04 | 6.23e-03 | 45 |
| GO:00303082 | Endometrium | AEH | negative regulation of cell growth | 36/2100 | 188/18723 | 9.15e-04 | 8.37e-03 | 36 |
| GO:00900902 | Endometrium | AEH | negative regulation of canonical Wnt signaling pathway | 28/2100 | 137/18723 | 1.17e-03 | 1.01e-02 | 28 |
| GO:00454467 | Endometrium | AEH | endothelial cell differentiation | 24/2100 | 118/18723 | 2.71e-03 | 1.96e-02 | 24 |
| GO:00316484 | Endometrium | AEH | protein destabilization | 12/2100 | 46/18723 | 3.91e-03 | 2.64e-02 | 12 |
| GO:00513022 | Endometrium | AEH | regulation of cell division | 32/2100 | 177/18723 | 4.33e-03 | 2.86e-02 | 32 |
| GO:0001824 | Endometrium | AEH | blastocyst development | 21/2100 | 106/18723 | 6.61e-03 | 3.90e-02 | 21 |
| GO:004217617 | Endometrium | EEC | regulation of protein catabolic process | 103/2168 | 391/18723 | 3.54e-16 | 1.52e-13 | 103 |
| GO:003164717 | Endometrium | EEC | regulation of protein stability | 80/2168 | 298/18723 | 2.48e-13 | 5.96e-11 | 80 |
| GO:005082117 | Endometrium | EEC | protein stabilization | 56/2168 | 191/18723 | 2.32e-11 | 3.39e-09 | 56 |
| GO:000989617 | Endometrium | EEC | positive regulation of catabolic process | 108/2168 | 492/18723 | 2.55e-11 | 3.64e-09 | 108 |
| GO:004573217 | Endometrium | EEC | positive regulation of protein catabolic process | 59/2168 | 231/18723 | 2.69e-09 | 2.01e-07 | 59 |
| GO:003011113 | Endometrium | EEC | regulation of Wnt signaling pathway | 74/2168 | 328/18723 | 1.03e-08 | 6.47e-07 | 74 |
| Page: 1 2 3 4 |
| Pathway ID | Tissue | Disease Stage | Description | Gene Ratio | Bg Ratio | pvalue | p.adjust | qvalue | Count |
| hsa0431010 | Endometrium | AEH | Wnt signaling pathway | 37/1197 | 171/8465 | 4.68e-03 | 2.53e-02 | 1.86e-02 | 37 |
| hsa0431013 | Endometrium | AEH | Wnt signaling pathway | 37/1197 | 171/8465 | 4.68e-03 | 2.53e-02 | 1.86e-02 | 37 |
| hsa0431022 | Endometrium | EEC | Wnt signaling pathway | 40/1237 | 171/8465 | 1.37e-03 | 8.99e-03 | 6.70e-03 | 40 |
| hsa0431032 | Endometrium | EEC | Wnt signaling pathway | 40/1237 | 171/8465 | 1.37e-03 | 8.99e-03 | 6.70e-03 | 40 |
| Page: 1 |
Top |
Cell-cell communication analysis |
| Identification of potential cell-cell interactions between two cell types and their ligand-receptor pairs for different disease states |
| Ligand | Receptor | LRpair | Pathway | Tissue | Disease Stage |
| Page: 1 |
Top |
Single-cell gene regulatory network inference analysis |
| Find out the significant the regulons (TFs) and the target genes of each regulon across cell types for different disease states |
| TF | Cell Type | Tissue | Disease Stage | Target Gene | RSS | Regulon Activity |
| SOX17 | MVA | Endometrium | EEC | SRP14,SLC9A3R2,GLUL, etc. | 2.11e-01 |  |
| SOX17 | MVA | Endometrium | Healthy | SRP14,SLC9A3R2,GLUL, etc. | 2.25e-01 |  |
| SOX17 | MVA | Lung | AAH | AIF1L,FAM107A,HEY1, etc. | 3.94e-01 |  |
| SOX17 | INCAF | Lung | ADJ | AIF1L,FAM107A,HEY1, etc. | 9.70e-02 |  |
| SOX17 | PVA | Lung | AIS | AIF1L,FAM107A,HEY1, etc. | 2.15e-01 |  |
| SOX17 | MVA | Lung | AIS | AIF1L,FAM107A,HEY1, etc. | 4.51e-01 | |
| SOX17 | INCAF | Lung | IAC | AIF1L,FAM107A,HEY1, etc. | 1.72e-01 |  |
| SOX17 | PVA | Lung | MIAC | AIF1L,FAM107A,HEY1, etc. | 1.01e-01 |  |
| SOX17 | MVA | Lung | MIAC | AIF1L,FAM107A,HEY1, etc. | 5.43e-01 | |
| SOX17 | END | Oral cavity | EOLP | ICAM2,CLDN5,SLC9A3R2, etc. | 3.99e-01 |  |
| ∗The dot plots of a searched regulon are shown for all cell subpopulations in each disease state of each tissue based on the regulon specific score inferred using pySCENIC and by calculating the average expression. |
| Page: 1 2 3 |
Top |
Somatic mutation of malignant transformation related genes |
| Annotation of somatic variants for genes involved in malignant transformation |
| Hugo Symbol | Variant Class | Variant Classification | dbSNP RS | HGVSc | HGVSp | HGVSp Short | SWISSPROT | BIOTYPE | SIFT | PolyPhen | Tumor Sample Barcode | Tissue | Histology | Sex | Age | Stage | Therapy Types | Drugs | Outcome |
| SOX17 | SNV | Missense_Mutation | rs780271052 | c.1181C>T | p.Ala394Val | p.A394V | Q9H6I2 | protein_coding | tolerated(0.17) | benign(0.009) | TCGA-EA-A410-01 | Cervix | cervical & endocervical cancer | Female | <65 | I/II | Unknown | Unknown | SD |
| SOX17 | SNV | Missense_Mutation | c.287N>G | p.Ala96Gly | p.A96G | Q9H6I2 | protein_coding | deleterious(0) | probably_damaging(0.998) | TCGA-EA-A4BA-01 | Cervix | cervical & endocervical cancer | Female | <65 | I/II | Chemotherapy | carboplatin | CR | |
| SOX17 | insertion | In_Frame_Ins | novel | c.362_363insAGA | p.Glu122dup | p.E122dup | Q9H6I2 | protein_coding | TCGA-IR-A3LI-01 | Cervix | cervical & endocervical cancer | Female | <65 | I/II | Chemotherapy | cisplatin | CR | ||
| SOX17 | SNV | Missense_Mutation | rs759612481 | c.143N>T | p.Ala48Val | p.A48V | Q9H6I2 | protein_coding | tolerated(0.16) | benign(0.001) | TCGA-A6-2677-01 | Colorectum | colon adenocarcinoma | Female | >=65 | III/IV | Ancillary | leucovorin | SD |
| SOX17 | SNV | Missense_Mutation | c.1079G>A | p.Arg360His | p.R360H | Q9H6I2 | protein_coding | deleterious(0.04) | possibly_damaging(0.511) | TCGA-A6-6653-01 | Colorectum | colon adenocarcinoma | Male | >=65 | I/II | Unknown | Unknown | SD | |
| SOX17 | SNV | Missense_Mutation | c.1054G>T | p.Ala352Ser | p.A352S | Q9H6I2 | protein_coding | tolerated(0.5) | benign(0.014) | TCGA-AA-A01V-01 | Colorectum | colon adenocarcinoma | Male | <65 | I/II | Unknown | Unknown | SD | |
| SOX17 | SNV | Missense_Mutation | c.1213N>A | p.Ala405Thr | p.A405T | Q9H6I2 | protein_coding | deleterious(0.02) | probably_damaging(0.98) | TCGA-CM-4743-01 | Colorectum | colon adenocarcinoma | Male | >=65 | I/II | Chemotherapy | capecitabine | SD | |
| SOX17 | SNV | Missense_Mutation | c.343C>T | p.Arg115Trp | p.R115W | Q9H6I2 | protein_coding | deleterious(0) | probably_damaging(0.998) | TCGA-CM-5349-01 | Colorectum | colon adenocarcinoma | Female | >=65 | I/II | Unknown | Unknown | SD | |
| SOX17 | SNV | Missense_Mutation | c.220N>A | p.Ala74Thr | p.A74T | Q9H6I2 | protein_coding | deleterious(0) | probably_damaging(0.999) | TCGA-CM-6171-01 | Colorectum | colon adenocarcinoma | Female | >=65 | I/II | Unknown | Unknown | SD | |
| SOX17 | SNV | Missense_Mutation | c.469C>T | p.His157Tyr | p.H157Y | Q9H6I2 | protein_coding | deleterious(0.02) | possibly_damaging(0.527) | TCGA-F4-6856-01 | Colorectum | colon adenocarcinoma | Male | <65 | I/II | Ancillary | leucovorin | CR |
| Page: 1 2 3 4 5 6 7 |
Top |
Related drugs of malignant transformation related genes |
| Identification of chemicals and drugs interact with genes involved in malignant transfromation |
| (DGIdb 4.0) |
| Entrez ID | Symbol | Category | Interaction Types | Drug Claim Name | Drug Name | PMIDs |
| Page: 1 |

Copyright 2023-Present -The University of Texas Health Science Center at Houston |