
|
|||||
|
 | |
| |
| |
| |
| |
| |
|
Gene: SOST |
Gene summary for SOST |
| Gene information | Species | Human | Gene symbol | SOST | Gene ID | 50964 |
| Gene name | sclerostin | |
| Gene Alias | CDD | |
| Cytomap | 17q21.31 | |
| Gene Type | protein-coding | GO ID | GO:0001503 | UniProtAcc | Q9BQB4 |
Top |
Malignant transformation analysis |
| Identification of the aberrant gene expression in precancerous and cancerous lesions by comparing the gene expression of stem-like cells in diseased tissues with normal stem cells |
| Entrez ID | Symbol | Replicates | Species | Organ | Tissue | Adj P-value | Log2FC | Malignancy |
| 50964 | SOST | LZE2T | Human | Esophagus | ESCC | 2.18e-04 | 4.66e-01 | 0.082 |
| 50964 | SOST | LZE4T | Human | Esophagus | ESCC | 1.47e-07 | 4.66e-01 | 0.0811 |
| 50964 | SOST | P9T-E | Human | Esophagus | ESCC | 1.34e-08 | 3.02e-01 | 0.1131 |
| 50964 | SOST | P10T-E | Human | Esophagus | ESCC | 1.69e-116 | 2.72e+00 | 0.116 |
| 50964 | SOST | P12T-E | Human | Esophagus | ESCC | 6.38e-31 | 7.78e-01 | 0.1122 |
| 50964 | SOST | P20T-E | Human | Esophagus | ESCC | 9.73e-30 | 1.11e+00 | 0.1124 |
| 50964 | SOST | P22T-E | Human | Esophagus | ESCC | 4.41e-07 | 2.06e-01 | 0.1236 |
| 50964 | SOST | P30T-E | Human | Esophagus | ESCC | 6.41e-46 | 2.58e+00 | 0.137 |
| 50964 | SOST | P52T-E | Human | Esophagus | ESCC | 1.88e-04 | 2.56e-01 | 0.1555 |
| 50964 | SOST | P56T-E | Human | Esophagus | ESCC | 2.13e-21 | 3.65e+00 | 0.1613 |
| 50964 | SOST | P61T-E | Human | Esophagus | ESCC | 9.48e-22 | 6.14e-01 | 0.099 |
| 50964 | SOST | P62T-E | Human | Esophagus | ESCC | 8.84e-38 | 1.45e+00 | 0.1302 |
| 50964 | SOST | P79T-E | Human | Esophagus | ESCC | 7.90e-03 | 1.61e-01 | 0.1154 |
| 50964 | SOST | P104T-E | Human | Esophagus | ESCC | 5.97e-09 | 3.87e-01 | 0.0931 |
| Page: 1 |
| Tissue | Expression Dynamics | Abbreviation |
| Esophagus | 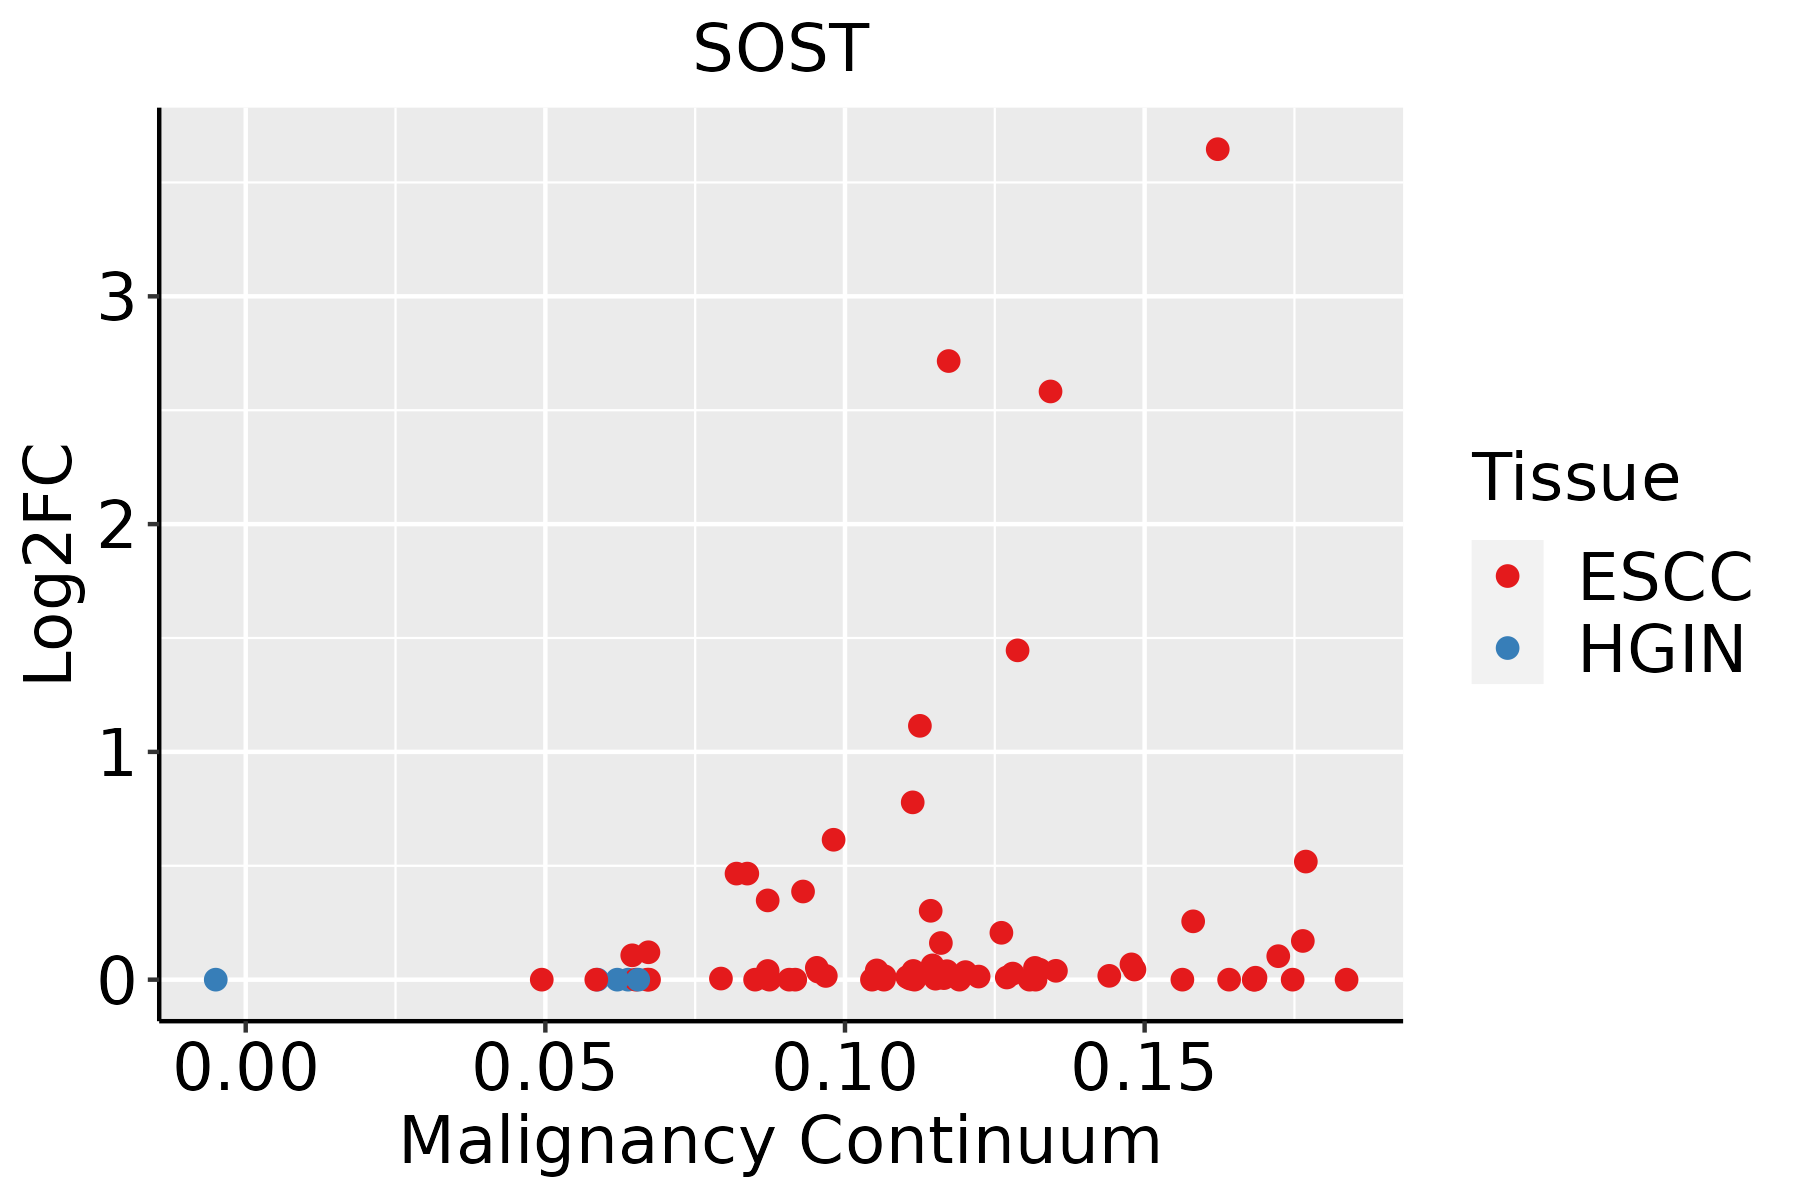 | ESCC: Esophageal squamous cell carcinoma |
| HGIN: High-grade intraepithelial neoplasias | ||
| LGIN: Low-grade intraepithelial neoplasias |
| ∗log2FC in expression of this searched gene in stem-like cells from each diseased tissue sample relative to stem-like cells in normal samples in each tissue plotted against the malignancy continuum. Samples are colored based on if they are from different disease stage. |
Top |
Malignant transformation related pathway analysis |
| Find out the enriched GO biological processes and KEGG pathways involved in transition from healthy to precancer to cancer |
| Tissue | Disease Stage | Enriched GO biological Processes |
| Colorectum | AD |  |
| Colorectum | SER |  |
| Colorectum | MSS |  |
| Colorectum | MSI-H |  |
| Colorectum | FAP |  |
| ∗Top 15 enriched GO BP terms are showed in the bar plot of each disease state in each tissue. Each row represents a significant GO biological process which is colored according to the -log10(p.adjust). |
| Page: 1 2 3 4 5 6 7 8 9 |
| GO ID | Tissue | Disease Stage | Description | Gene Ratio | Bg Ratio | pvalue | p.adjust | Count |
| GO:00611807 | Esophagus | ESCC | mammary gland epithelium development | 43/8552 | 67/18723 | 1.73e-03 | 7.97e-03 | 43 |
| GO:00301788 | Esophagus | ESCC | negative regulation of Wnt signaling pathway | 97/8552 | 170/18723 | 1.81e-03 | 8.31e-03 | 97 |
| GO:00454454 | Esophagus | ESCC | myoblast differentiation | 52/8552 | 84/18723 | 1.98e-03 | 8.90e-03 | 52 |
| GO:00423033 | Esophagus | ESCC | molting cycle | 64/8552 | 107/18723 | 2.24e-03 | 9.85e-03 | 64 |
| GO:00426333 | Esophagus | ESCC | hair cycle | 64/8552 | 107/18723 | 2.24e-03 | 9.85e-03 | 64 |
| GO:00900905 | Esophagus | ESCC | negative regulation of canonical Wnt signaling pathway | 78/8552 | 137/18723 | 5.17e-03 | 1.95e-02 | 78 |
| GO:00604435 | Esophagus | ESCC | mammary gland morphogenesis | 28/8552 | 43/18723 | 7.98e-03 | 2.84e-02 | 28 |
| GO:001605518 | Skin | AK | Wnt signaling pathway | 98/1910 | 444/18723 | 9.39e-14 | 3.09e-11 | 98 |
| GO:000854417 | Skin | AK | epidermis development | 79/1910 | 324/18723 | 1.04e-13 | 3.25e-11 | 79 |
| GO:019873818 | Skin | AK | cell-cell signaling by wnt | 98/1910 | 446/18723 | 1.26e-13 | 3.72e-11 | 98 |
| GO:00435889 | Skin | AK | skin development | 67/1910 | 263/18723 | 9.02e-13 | 2.14e-10 | 67 |
| GO:004873226 | Skin | AK | gland development | 93/1910 | 436/18723 | 3.24e-12 | 7.10e-10 | 93 |
| GO:003011118 | Skin | AK | regulation of Wnt signaling pathway | 73/1910 | 328/18723 | 9.27e-11 | 1.52e-08 | 73 |
| GO:006007017 | Skin | AK | canonical Wnt signaling pathway | 67/1910 | 303/18723 | 7.30e-10 | 7.45e-08 | 67 |
| GO:006082818 | Skin | AK | regulation of canonical Wnt signaling pathway | 57/1910 | 253/18723 | 6.57e-09 | 4.47e-07 | 57 |
| GO:002261217 | Skin | AK | gland morphogenesis | 32/1910 | 118/18723 | 1.68e-07 | 7.09e-06 | 32 |
| GO:00423034 | Skin | AK | molting cycle | 29/1910 | 107/18723 | 6.35e-07 | 2.20e-05 | 29 |
| GO:00426334 | Skin | AK | hair cycle | 29/1910 | 107/18723 | 6.35e-07 | 2.20e-05 | 29 |
| GO:00987733 | Skin | AK | skin epidermis development | 25/1910 | 85/18723 | 7.05e-07 | 2.41e-05 | 25 |
| GO:00019423 | Skin | AK | hair follicle development | 24/1910 | 81/18723 | 1.01e-06 | 3.21e-05 | 24 |
| Page: 1 2 3 4 |
| Pathway ID | Tissue | Disease Stage | Description | Gene Ratio | Bg Ratio | pvalue | p.adjust | qvalue | Count |
| hsa0492816 | Esophagus | ESCC | Parathyroid hormone synthesis, secretion and action | 66/4205 | 106/8465 | 5.86e-03 | 1.47e-02 | 7.51e-03 | 66 |
| hsa0492817 | Esophagus | ESCC | Parathyroid hormone synthesis, secretion and action | 66/4205 | 106/8465 | 5.86e-03 | 1.47e-02 | 7.51e-03 | 66 |
| Page: 1 |
Top |
Cell-cell communication analysis |
| Identification of potential cell-cell interactions between two cell types and their ligand-receptor pairs for different disease states |
| Ligand | Receptor | LRpair | Pathway | Tissue | Disease Stage |
| Page: 1 |
Top |
Single-cell gene regulatory network inference analysis |
| Find out the significant the regulons (TFs) and the target genes of each regulon across cell types for different disease states |
| TF | Cell Type | Tissue | Disease Stage | Target Gene | RSS | Regulon Activity |
| ∗The dot plots of a searched regulon are shown for all cell subpopulations in each disease state of each tissue based on the regulon specific score inferred using pySCENIC and by calculating the average expression. |
| Page: 1 |
Top |
Somatic mutation of malignant transformation related genes |
| Annotation of somatic variants for genes involved in malignant transformation |
| Hugo Symbol | Variant Class | Variant Classification | dbSNP RS | HGVSc | HGVSp | HGVSp Short | SWISSPROT | BIOTYPE | SIFT | PolyPhen | Tumor Sample Barcode | Tissue | Histology | Sex | Age | Stage | Therapy Types | Drugs | Outcome |
| SOST | SNV | Missense_Mutation | novel | c.94G>T | p.Asp32Tyr | p.D32Y | Q9BQB4 | protein_coding | deleterious(0) | probably_damaging(0.999) | TCGA-AA-3867-01 | Colorectum | colon adenocarcinoma | Male | >=65 | III/IV | Unknown | Unknown | PD |
| SOST | SNV | Missense_Mutation | rs200581535 | c.101N>T | p.Thr34Met | p.T34M | Q9BQB4 | protein_coding | deleterious(0) | probably_damaging(0.999) | TCGA-AA-3950-01 | Colorectum | colon adenocarcinoma | Female | >=65 | I/II | Unknown | Unknown | SD |
| SOST | SNV | Missense_Mutation | rs541123476 | c.176N>T | p.Ala59Val | p.A59V | Q9BQB4 | protein_coding | deleterious(0) | probably_damaging(0.969) | TCGA-AJ-A3BH-01 | Endometrium | uterine corpus endometrioid carcinoma | Female | Unknown | I/II | Unknown | Unknown | SD |
| SOST | SNV | Missense_Mutation | rs750840300 | c.172N>T | p.Arg58Trp | p.R58W | Q9BQB4 | protein_coding | deleterious(0) | possibly_damaging(0.872) | TCGA-AP-A051-01 | Endometrium | uterine corpus endometrioid carcinoma | Female | >=65 | I/II | Unknown | Unknown | SD |
| SOST | SNV | Missense_Mutation | rs770960308 | c.83N>T | p.Ala28Val | p.A28V | Q9BQB4 | protein_coding | tolerated(0.49) | benign(0.006) | TCGA-AX-A0J1-01 | Endometrium | uterine corpus endometrioid carcinoma | Female | >=65 | I/II | Unknown | Unknown | SD |
| SOST | SNV | Missense_Mutation | novel | c.96T>A | p.Asp32Glu | p.D32E | Q9BQB4 | protein_coding | deleterious(0) | probably_damaging(0.977) | TCGA-BW-A5NP-01 | Liver | liver hepatocellular carcinoma | Female | <65 | III/IV | Targeted Molecular therapy | sorafenib | PD |
| SOST | SNV | Missense_Mutation | novel | c.522N>A | p.His174Gln | p.H174Q | Q9BQB4 | protein_coding | deleterious(0.03) | benign(0.432) | TCGA-05-4424-01 | Lung | lung adenocarcinoma | Male | >=65 | I/II | Targeted Molecular therapy | erlotinib | SD |
| SOST | SNV | Missense_Mutation | c.458C>T | p.Ala153Val | p.A153V | Q9BQB4 | protein_coding | deleterious(0.02) | benign(0.04) | TCGA-78-7220-01 | Lung | lung adenocarcinoma | Female | <65 | III/IV | Unknown | Unknown | PD | |
| SOST | SNV | Missense_Mutation | c.457G>A | p.Ala153Thr | p.A153T | Q9BQB4 | protein_coding | tolerated(1) | benign(0.001) | TCGA-78-7220-01 | Lung | lung adenocarcinoma | Female | <65 | III/IV | Unknown | Unknown | PD | |
| SOST | SNV | Missense_Mutation | rs762683331 | c.115G>A | p.Glu39Lys | p.E39K | Q9BQB4 | protein_coding | tolerated(0.15) | benign(0.124) | TCGA-95-7039-01 | Lung | lung adenocarcinoma | Female | <65 | I/II | Unknown | Unknown | PD |
| Page: 1 2 |
Top |
Related drugs of malignant transformation related genes |
| Identification of chemicals and drugs interact with genes involved in malignant transfromation |
| (DGIdb 4.0) |
| Entrez ID | Symbol | Category | Interaction Types | Drug Claim Name | Drug Name | PMIDs |
| 50964 | SOST | DRUGGABLE GENOME | LY2541546 | |||
| 50964 | SOST | DRUGGABLE GENOME | inhibitor | CHEMBL1742993 | BLOSOZUMAB | |
| 50964 | SOST | DRUGGABLE GENOME | BPS-804 | SETRUSUMAB | ||
| 50964 | SOST | DRUGGABLE GENOME | inhibitor | CHEMBL2107874 | ROMOSOZUMAB | |
| 50964 | SOST | DRUGGABLE GENOME | AMG 167 | 23807838 | ||
| 50964 | SOST | DRUGGABLE GENOME | Romosozumab | ROMOSOZUMAB |
| Page: 1 |

Copyright 2023-Present -The University of Texas Health Science Center at Houston |