Schematic overview of the cellular and molecular mechanisms involved in the cancer progression, including the proposed cellular and molecular mechanisms in cancer cells trajectory. AT1: alveolar type 1 cells; AT2: alveolar type 2 cells; AAH: atypical adenomatous hyperplasia; AIS: adenocarcinoma in situ; MIA: minimally invasive adenocarcinoma; IA: invasive adenocarcinoma; EMT: epithelial-mesenchymal transition

Home

Download

Statistics

Help

Contact

Center for Computational Systems Medicine
leaf

Gene summary

leaf

Malignant transformation analysis

leaf

Malignant transformation related pathway analysis

leaf

Cell-cell communication analysis

leaf

Single-cell gene regulatory network inference analysis

leaf

Somatic mutation of malignant transformation related genes

leaf

Related drugs of malignant transformation related genes

Gene: SLC35B2

Gene summary for SLC35B2

check button Gene summary.

Gene informationSpeciesHuman
Gene symbol

SLC35B2

Gene ID

347734

Gene namesolute carrier family 35 member B2
Gene AliasPAPST1
Cytomap6p21.1
Gene Typeprotein-coding
GO ID

GO:0006082

UniProtAcc

Q8TB61


Top

Malignant transformation analysis

check button Identification of the aberrant gene expression in precancerous and cancerous lesions by comparing the gene expression of stem-like cells in diseased tissues with normal stem cells
check button Malignant transformation involving gene list.
Entrez IDSymbolReplicatesSpeciesOrganTissueAdj P-valueLog2FCMalignancy
347734SLC35B2HTA11_3410_2000001011HumanColorectumAD1.02e-031.66e-010.0155
347734SLC35B2HTA11_2487_2000001011HumanColorectumSER6.65e-032.19e-01-0.1808
347734SLC35B2HTA11_1938_2000001011HumanColorectumAD1.75e-093.58e-01-0.0811
347734SLC35B2HTA11_78_2000001011HumanColorectumAD7.86e-062.99e-01-0.1088
347734SLC35B2HTA11_347_2000001011HumanColorectumAD3.90e-041.92e-01-0.1954
347734SLC35B2HTA11_696_2000001011HumanColorectumAD2.06e-092.41e-01-0.1464
347734SLC35B2HTA11_1391_2000001011HumanColorectumAD7.81e-052.55e-01-0.059
347734SLC35B2HTA11_866_3004761011HumanColorectumAD1.22e-062.64e-010.096
347734SLC35B2HTA11_4255_2000001011HumanColorectumSER9.21e-034.02e-010.0446
347734SLC35B2HTA11_10711_2000001011HumanColorectumAD7.24e-042.26e-010.0338
347734SLC35B2HTA11_7696_3000711011HumanColorectumAD2.62e-082.55e-010.0674
347734SLC35B2HTA11_99999970781_79442HumanColorectumMSS7.95e-142.80e-010.294
347734SLC35B2HTA11_99999965062_69753HumanColorectumMSI-H4.18e-055.23e-010.3487
347734SLC35B2HTA11_99999965104_69814HumanColorectumMSS1.37e-114.52e-010.281
347734SLC35B2HTA11_99999971662_82457HumanColorectumMSS2.98e-112.98e-010.3859
347734SLC35B2HTA11_99999973899_84307HumanColorectumMSS1.55e-053.09e-010.2585
347734SLC35B2HTA11_99999974143_84620HumanColorectumMSS2.62e-112.54e-010.3005
347734SLC35B2LZE2THumanEsophagusESCC4.54e-026.62e-010.082
347734SLC35B2LZE4THumanEsophagusESCC2.98e-041.46e-010.0811
347734SLC35B2LZE7THumanEsophagusESCC4.85e-054.91e-010.0667
Page: 1 2 3 4 5 6 7 

check button Transcriptomic changes along malignancy continuum.
TissueExpression DynamicsAbbreviation
Colorectum (GSE201348)The image shows the transcriptomic changes along malignancy continuum.log2FC in expression of this searched gene in stem-like cells from each diseased tissue sample relative to stem-like cells in normal samples in each tissue plotted against the malignancy continuum. Samples are colored based on if they are from different disease stage.FAP: Familial adenomatous polyposis
CRC: Colorectal cancer
Colorectum (HTA11)The image shows the transcriptomic changes along malignancy continuum.log2FC in expression of this searched gene in stem-like cells from each diseased tissue sample relative to stem-like cells in normal samples in each tissue plotted against the malignancy continuum. Samples are colored based on if they are from different disease stage.AD: Adenomas
SER: Sessile serrated lesions
MSI-H: Microsatellite-high colorectal cancer
MSS: Microsatellite stable colorectal cancer
EsophagusThe image shows the transcriptomic changes along malignancy continuum.log2FC in expression of this searched gene in stem-like cells from each diseased tissue sample relative to stem-like cells in normal samples in each tissue plotted against the malignancy continuum. Samples are colored based on if they are from different disease stage.ESCC: Esophageal squamous cell carcinoma
HGIN: High-grade intraepithelial neoplasias
LGIN: Low-grade intraepithelial neoplasias
LiverThe image shows the transcriptomic changes along malignancy continuum.log2FC in expression of this searched gene in stem-like cells from each diseased tissue sample relative to stem-like cells in normal samples in each tissue plotted against the malignancy continuum. Samples are colored based on if they are from different disease stage.
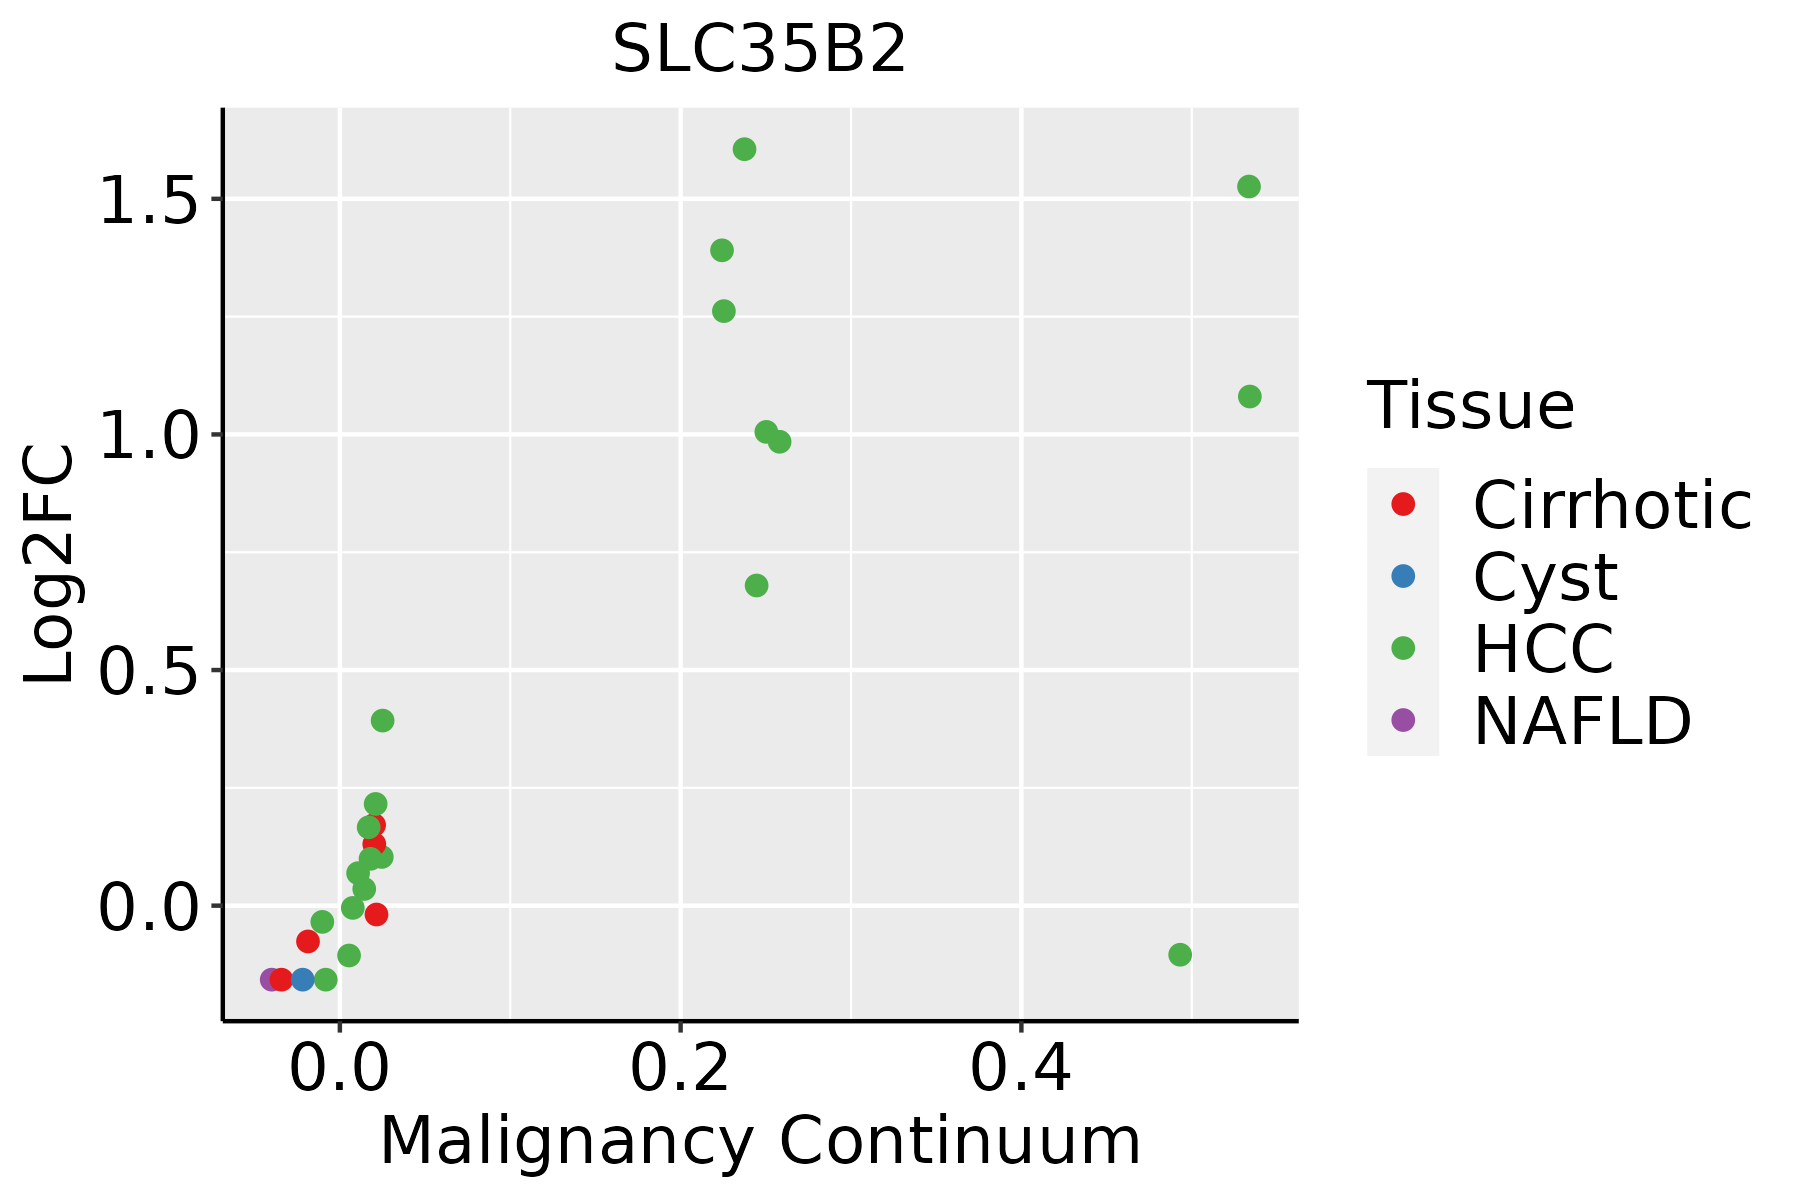
HCC: Hepatocellular carcinoma
NAFLD: Non-alcoholic fatty liver disease
Oral CavityThe image shows the transcriptomic changes along malignancy continuum.log2FC in expression of this searched gene in stem-like cells from each diseased tissue sample relative to stem-like cells in normal samples in each tissue plotted against the malignancy continuum. Samples are colored based on if they are from different disease stage.
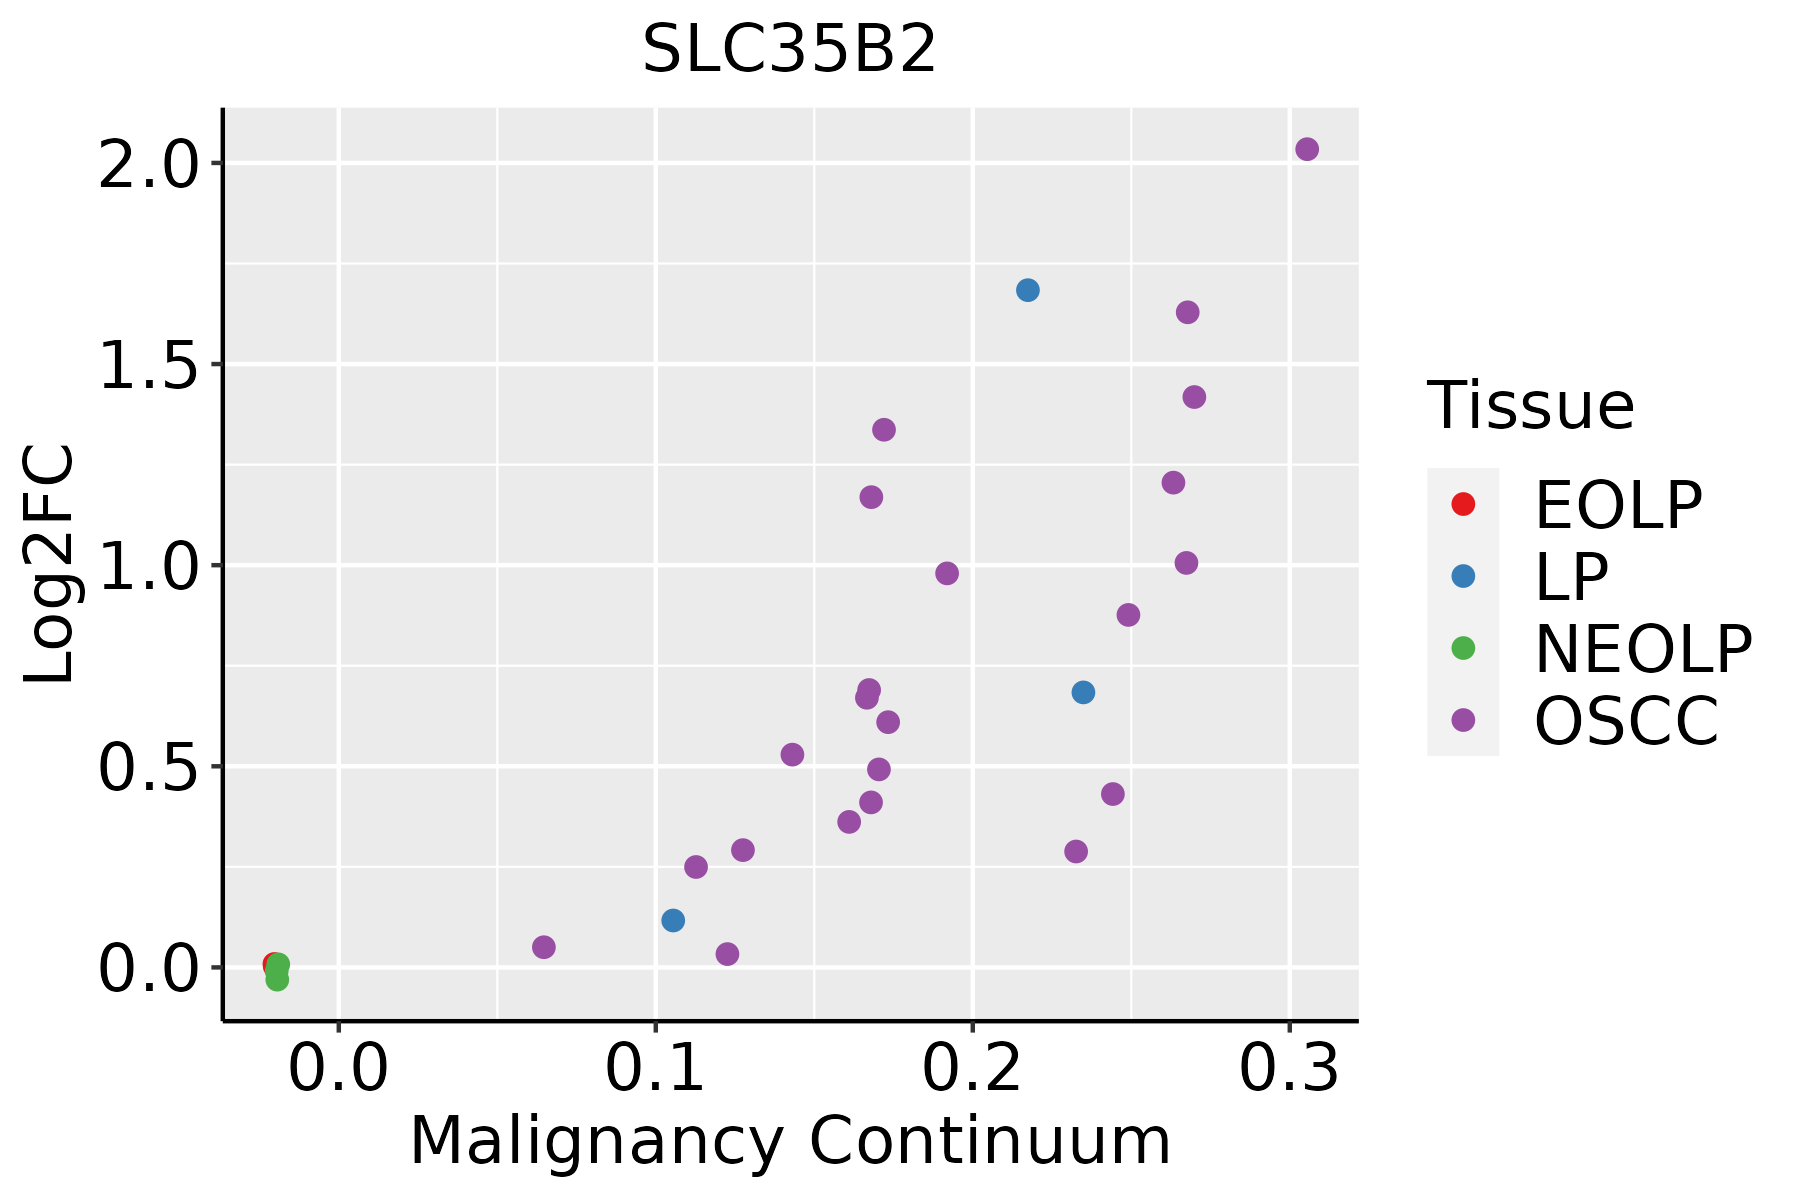
EOLP: Erosive Oral lichen planus
LP: leukoplakia
NEOLP: Non-erosive oral lichen planus
OSCC: Oral squamous cell carcinoma
SkinThe image shows the transcriptomic changes along malignancy continuum.log2FC in expression of this searched gene in stem-like cells from each diseased tissue sample relative to stem-like cells in normal samples in each tissue plotted against the malignancy continuum. Samples are colored based on if they are from different disease stage.
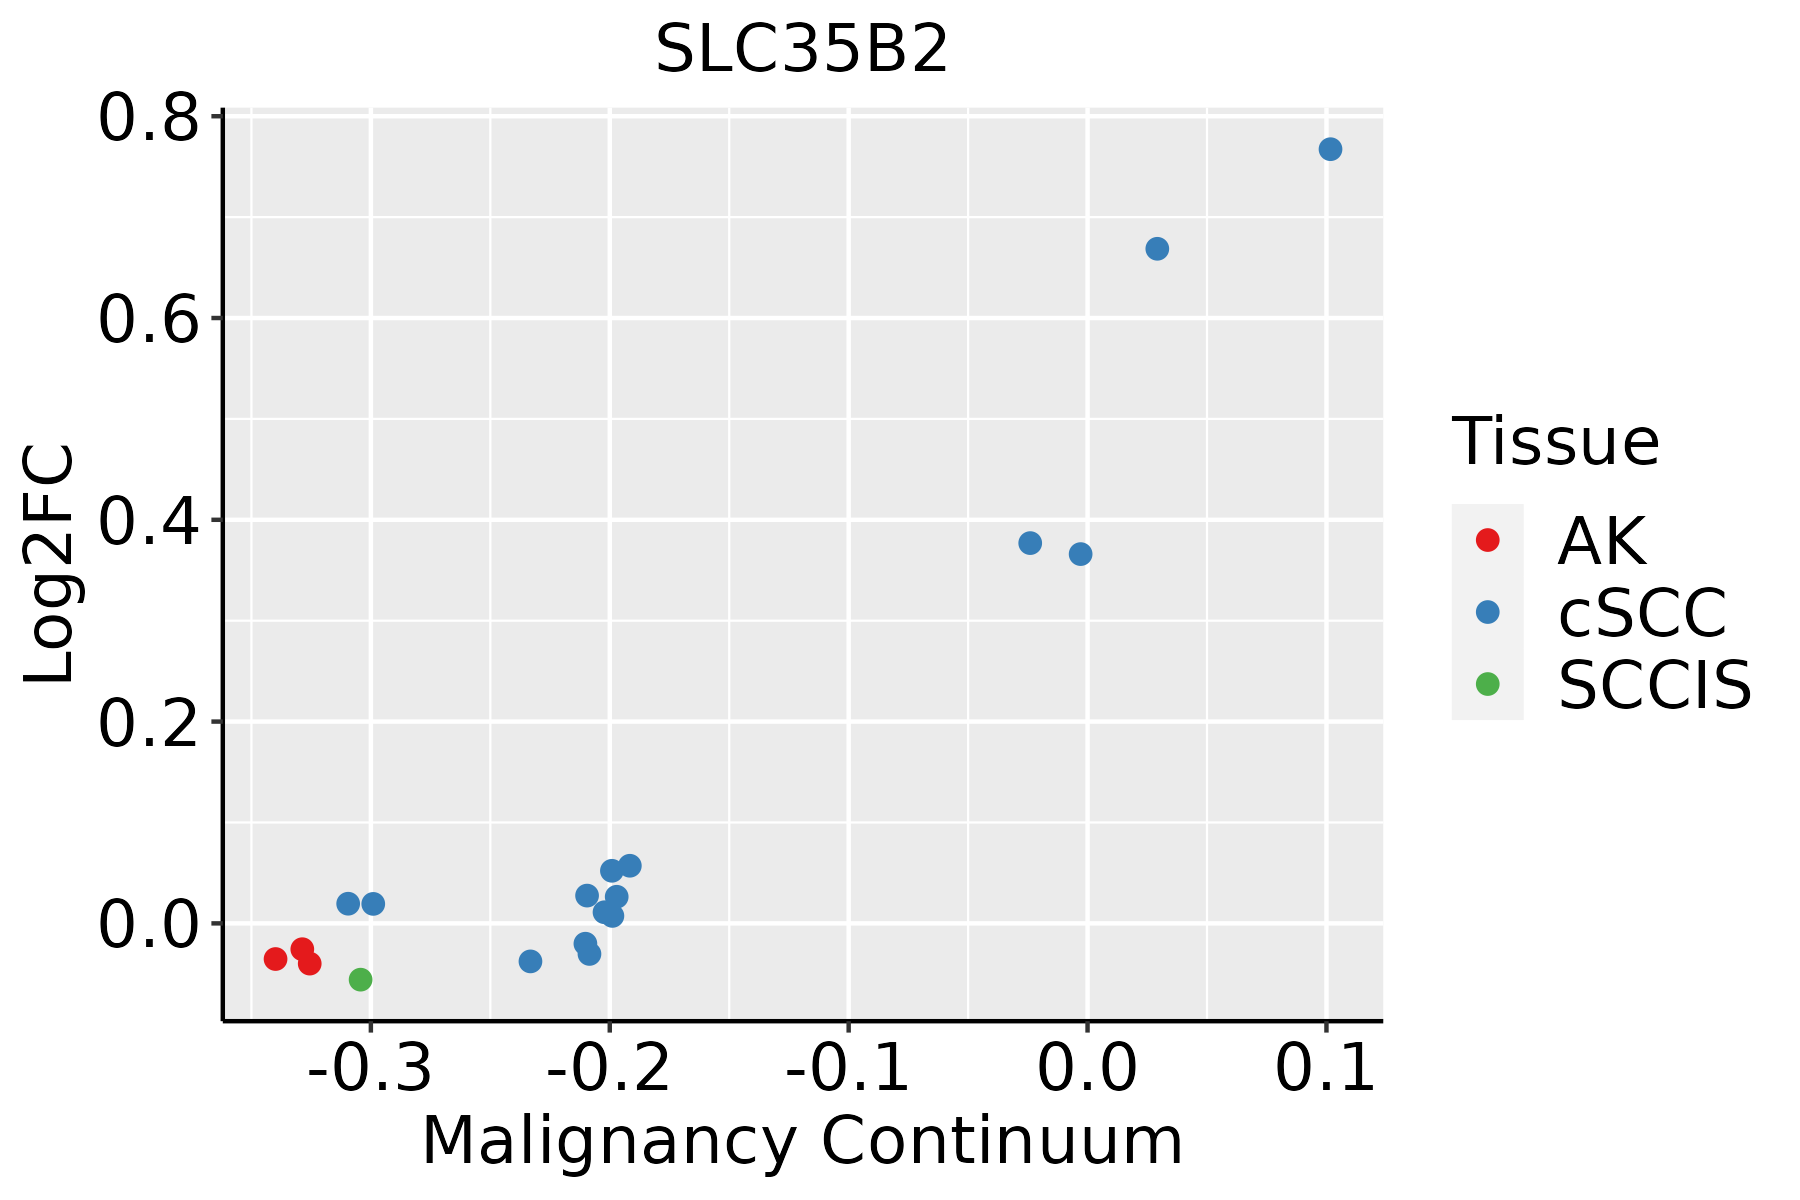
AK: Actinic keratosis
cSCC: Cutaneous squamous cell carcinoma
SCCIS:squamous cell carcinoma in situ
ThyroidThe image shows the transcriptomic changes along malignancy continuum.log2FC in expression of this searched gene in stem-like cells from each diseased tissue sample relative to stem-like cells in normal samples in each tissue plotted against the malignancy continuum. Samples are colored based on if they are from different disease stage.
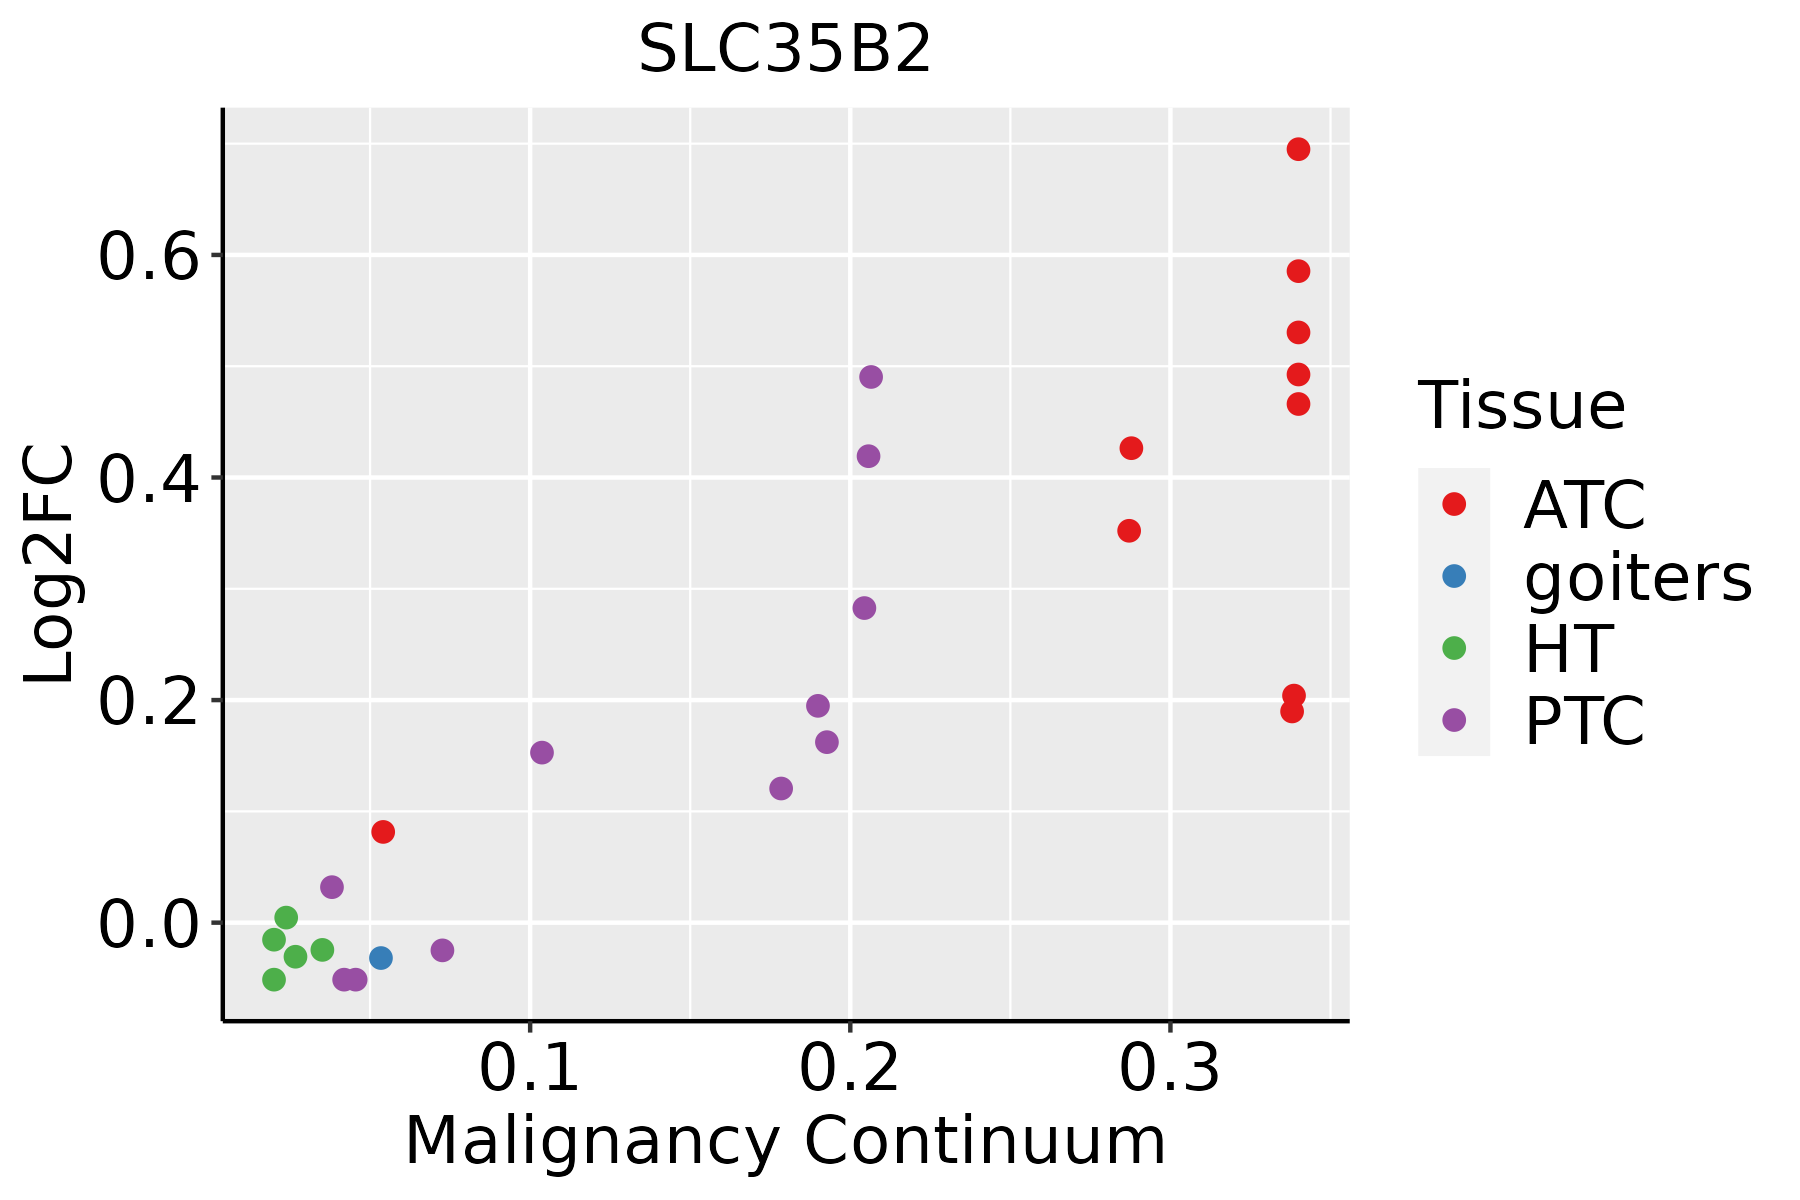
ATC: Anaplastic thyroid cancer
HT: Hashimoto's thyroiditis
PTC: Papillary thyroid cancer
∗log2FC in expression of this searched gene in stem-like cells from each diseased tissue sample relative to stem-like cells in normal samples in each tissue plotted against the malignancy continuum. Samples are colored based on if they are from different disease stage.

Top

Malignant transformation related pathway analysis

check buttonFind out the enriched GO biological processes and KEGG pathways involved in transition from healthy to precancer to cancer
check button Figure of enriched GO biological processes.
TissueDisease StageEnriched GO biological Processes
ColorectumADGO analysis - Figure of enriched GO biological processes: Top 15 enriched GO BP terms are showed in the bar plot of each disease state in each tissue. Each row represents a significant GO biological process which is colored according to the -log10(p.adjust).
ColorectumSERGO analysis - Figure of enriched GO biological processes: Top 15 enriched GO BP terms are showed in the bar plot of each disease state in each tissue. Each row represents a significant GO biological process which is colored according to the -log10(p.adjust).
ColorectumMSSGO analysis - Figure of enriched GO biological processes: Top 15 enriched GO BP terms are showed in the bar plot of each disease state in each tissue. Each row represents a significant GO biological process which is colored according to the -log10(p.adjust).
ColorectumMSI-HGO analysis - Figure of enriched GO biological processes: Top 15 enriched GO BP terms are showed in the bar plot of each disease state in each tissue. Each row represents a significant GO biological process which is colored according to the -log10(p.adjust).
ColorectumFAPGO analysis - Figure of enriched GO biological processes: Top 15 enriched GO BP terms are showed in the bar plot of each disease state in each tissue. Each row represents a significant GO biological process which is colored according to the -log10(p.adjust).
∗Top 15 enriched GO BP terms are showed in the bar plot of each disease state in each tissue. Each row represents a significant GO biological process which is colored according to the -log10(p.adjust).
Page: 1 2 3 4 5 6 7 8 9 

check button Enriched GO biological processes.
GO IDTissueDisease StageDescriptionGene RatioBg Ratiopvaluep.adjustCount
GO:0033875ColorectumADribonucleoside bisphosphate metabolic process42/3918128/187231.12e-031.02e-0242
GO:0034032ColorectumADpurine nucleoside bisphosphate metabolic process42/3918128/187231.12e-031.02e-0242
GO:0034035ColorectumADpurine ribonucleoside bisphosphate metabolic process11/391821/187231.43e-031.22e-0211
GO:0050427ColorectumAD3'-phosphoadenosine 5'-phosphosulfate metabolic process11/391821/187231.43e-031.22e-0211
GO:0015748ColorectumADorganophosphate ester transport42/3918140/187237.04e-034.31e-0242
GO:00061631ColorectumSERpurine nucleotide metabolic process109/2897396/187234.26e-105.44e-08109
GO:00091501ColorectumSERpurine ribonucleotide metabolic process103/2897368/187234.69e-105.68e-08103
GO:00725211ColorectumSERpurine-containing compound metabolic process113/2897416/187234.80e-105.68e-08113
GO:00092591ColorectumSERribonucleotide metabolic process104/2897385/187233.27e-093.04e-07104
GO:00196931ColorectumSERribose phosphate metabolic process105/2897396/187238.15e-097.14e-07105
GO:00091171ColorectumSERnucleotide metabolic process122/2897489/187232.50e-081.76e-06122
GO:00067531ColorectumSERnucleoside phosphate metabolic process122/2897497/187236.64e-084.33e-06122
GO:00091521ColorectumSERpurine ribonucleotide biosynthetic process48/2897169/187231.27e-054.01e-0448
GO:00092601ColorectumSERribonucleotide biosynthetic process49/2897182/187234.85e-051.19e-0349
GO:00463901ColorectumSERribose phosphate biosynthetic process50/2897190/187237.70e-051.72e-0350
GO:00725221ColorectumSERpurine-containing compound biosynthetic process51/2897200/187231.55e-043.01e-0351
GO:00061641ColorectumSERpurine nucleotide biosynthetic process49/2897191/187231.77e-043.30e-0349
GO:00159311ColorectumSERnucleobase-containing compound transport54/2897222/187233.65e-045.67e-0354
GO:00091651ColorectumSERnucleotide biosynthetic process58/2897254/187231.21e-031.38e-0258
GO:19012931ColorectumSERnucleoside phosphate biosynthetic process58/2897256/187231.47e-031.59e-0258
Page: 1 2 3 4 5 6 7 8 9 10 11 12 13 

check button Enriched KEGG pathways.
Pathway IDTissueDisease StageDescriptionGene RatioBg Ratiopvaluep.adjustqvalueCount
Page: 1 

Top

Cell-cell communication analysis

check buttonIdentification of potential cell-cell interactions between two cell types and their ligand-receptor pairs for different disease states
LigandReceptorLRpairPathwayTissueDisease Stage
Page: 1 

Top

Single-cell gene regulatory network inference analysis

check buttonFind out the significant the regulons (TFs) and the target genes of each regulon across cell types for different disease states
TFCell TypeTissueDisease StageTarget GeneRSSRegulon Activity
∗The dot plots of a searched regulon are shown for all cell subpopulations in each disease state of each tissue based on the regulon specific score inferred using pySCENIC and by calculating the average expression.
Page: 1 

Top

Somatic mutation of malignant transformation related genes

check buttonAnnotation of somatic variants for genes involved in malignant transformation
Hugo SymbolVariant ClassVariant ClassificationdbSNP RSHGVScHGVSpHGVSp ShortSWISSPROTBIOTYPESIFTPolyPhenTumor Sample BarcodeTissueHistologySexAgeStageTherapy TypesDrugsOutcome
SLC35B2SNVMissense_Mutationrs762279662c.1232C>Tp.Ala411Valp.A411VQ8TB61protein_codingtolerated(0.11)probably_damaging(0.999)TCGA-A8-A08L-01Breastbreast invasive carcinomaFemale>=65III/IVUnknownUnknownSD
SLC35B2SNVMissense_Mutationc.707N>Cp.Glu236Alap.E236AQ8TB61protein_codingdeleterious(0.01)possibly_damaging(0.837)TCGA-BH-A0E7-01Breastbreast invasive carcinomaFemale>=65I/IIHormone TherapyarimidexSD
SLC35B2SNVMissense_Mutationrs752687684c.241N>Ap.Val81Metp.V81MQ8TB61protein_codingdeleterious(0.01)possibly_damaging(0.887)TCGA-C8-A275-01Breastbreast invasive carcinomaFemale<65I/IIUnknownUnknownSD
SLC35B2SNVMissense_Mutationc.263C>Ap.Ala88Aspp.A88DQ8TB61protein_codingtolerated(0.47)benign(0.005)TCGA-D8-A140-01Breastbreast invasive carcinomaFemale<65I/IIChemotherapydoxorubicin+cyclophosphamidSD
SLC35B2SNVMissense_Mutationc.474G>Ap.Met158Ilep.M158IQ8TB61protein_codingtolerated(0.3)benign(0.115)TCGA-E2-A159-01Breastbreast invasive carcinomaFemale<65I/IIChemotherapycyclophosphamideSD
SLC35B2SNVMissense_Mutationrs772679565c.290G>Ap.Arg97Glnp.R97QQ8TB61protein_codingtolerated(0.27)benign(0.034)TCGA-PE-A5DE-01Breastbreast invasive carcinomaFemale<65I/IIChemotherapytaxotereCR
SLC35B2insertionFrame_Shift_Insnovelc.754_755insGATAp.Met252ArgfsTer32p.M252Rfs*32Q8TB61protein_codingTCGA-AO-A0J5-01Breastbreast invasive carcinomaFemale<65III/IVOther, specify in notesBisphosphonatezoledronicPD
SLC35B2insertionIn_Frame_Insnovelc.752_753insGATGCCCTGTTTGCCTATAAGATGTCATCGGTGp.Ser251delinsArgMetProCysLeuProIleArgCysHisArgCysp.S251delinsRMPCLPIRCHRCQ8TB61protein_codingTCGA-AO-A0J5-01Breastbreast invasive carcinomaFemale<65III/IVOther, specify in notesBisphosphonatezoledronicPD
SLC35B2deletionFrame_Shift_Delnovelc.999delNp.His334ThrfsTer38p.H334Tfs*38Q8TB61protein_codingTCGA-EW-A2FV-01Breastbreast invasive carcinomaFemale<65III/IVChemotherapydocetaxelSD
SLC35B2SNVMissense_Mutationrs138499828c.1252N>Tp.Arg418Trpp.R418WQ8TB61protein_codingdeleterious(0.03)possibly_damaging(0.803)TCGA-C5-A1BQ-01Cervixcervical & endocervical cancerFemale>=65III/IVChemotherapycisplatinCR
Page: 1 2 3 4 

Top

Related drugs of malignant transformation related genes

check buttonIdentification of chemicals and drugs interact with genes involved in malignant transfromation
(DGIdb 4.0)
Entrez IDSymbolCategoryInteraction TypesDrug Claim NameDrug NamePMIDs
Page: 1