
|
|||||
|
 | |
| |
| |
| |
| |
| |
|
Gene: SLC25A16 |
Gene summary for SLC25A16 |
| Gene information | Species | Human | Gene symbol | SLC25A16 | Gene ID | 8034 |
| Gene name | solute carrier family 25 member 16 | |
| Gene Alias | D10S105E | |
| Cytomap | 10q21.3 | |
| Gene Type | protein-coding | GO ID | GO:0006139 | UniProtAcc | B4DHV9 |
Top |
Malignant transformation analysis |
| Identification of the aberrant gene expression in precancerous and cancerous lesions by comparing the gene expression of stem-like cells in diseased tissues with normal stem cells |
| Entrez ID | Symbol | Replicates | Species | Organ | Tissue | Adj P-value | Log2FC | Malignancy |
| 8034 | SLC25A16 | LZE4T | Human | Esophagus | ESCC | 6.18e-04 | 1.57e-01 | 0.0811 |
| 8034 | SLC25A16 | LZE7T | Human | Esophagus | ESCC | 5.27e-06 | 2.30e-01 | 0.0667 |
| 8034 | SLC25A16 | LZE22T | Human | Esophagus | ESCC | 9.43e-04 | 2.16e-01 | 0.068 |
| 8034 | SLC25A16 | LZE24T | Human | Esophagus | ESCC | 1.59e-16 | 4.08e-01 | 0.0596 |
| 8034 | SLC25A16 | LZE21T | Human | Esophagus | ESCC | 4.66e-03 | 2.64e-01 | 0.0655 |
| 8034 | SLC25A16 | P1T-E | Human | Esophagus | ESCC | 3.25e-13 | 3.95e-01 | 0.0875 |
| 8034 | SLC25A16 | P2T-E | Human | Esophagus | ESCC | 1.53e-19 | 2.51e-01 | 0.1177 |
| 8034 | SLC25A16 | P4T-E | Human | Esophagus | ESCC | 2.78e-14 | 2.68e-01 | 0.1323 |
| 8034 | SLC25A16 | P5T-E | Human | Esophagus | ESCC | 3.60e-13 | 2.40e-01 | 0.1327 |
| 8034 | SLC25A16 | P8T-E | Human | Esophagus | ESCC | 9.53e-09 | 1.24e-01 | 0.0889 |
| 8034 | SLC25A16 | P9T-E | Human | Esophagus | ESCC | 1.08e-03 | 8.58e-02 | 0.1131 |
| 8034 | SLC25A16 | P10T-E | Human | Esophagus | ESCC | 4.31e-06 | 1.18e-01 | 0.116 |
| 8034 | SLC25A16 | P11T-E | Human | Esophagus | ESCC | 1.29e-05 | 2.72e-01 | 0.1426 |
| 8034 | SLC25A16 | P12T-E | Human | Esophagus | ESCC | 5.79e-16 | 2.13e-01 | 0.1122 |
| 8034 | SLC25A16 | P15T-E | Human | Esophagus | ESCC | 8.22e-10 | 1.89e-01 | 0.1149 |
| 8034 | SLC25A16 | P16T-E | Human | Esophagus | ESCC | 1.76e-12 | 1.49e-01 | 0.1153 |
| 8034 | SLC25A16 | P20T-E | Human | Esophagus | ESCC | 1.43e-11 | 2.94e-01 | 0.1124 |
| 8034 | SLC25A16 | P21T-E | Human | Esophagus | ESCC | 3.28e-14 | 2.68e-01 | 0.1617 |
| 8034 | SLC25A16 | P22T-E | Human | Esophagus | ESCC | 9.02e-11 | 1.70e-01 | 0.1236 |
| 8034 | SLC25A16 | P23T-E | Human | Esophagus | ESCC | 2.50e-12 | 2.34e-01 | 0.108 |
| Page: 1 2 3 4 |
| Tissue | Expression Dynamics | Abbreviation |
| Endometrium | 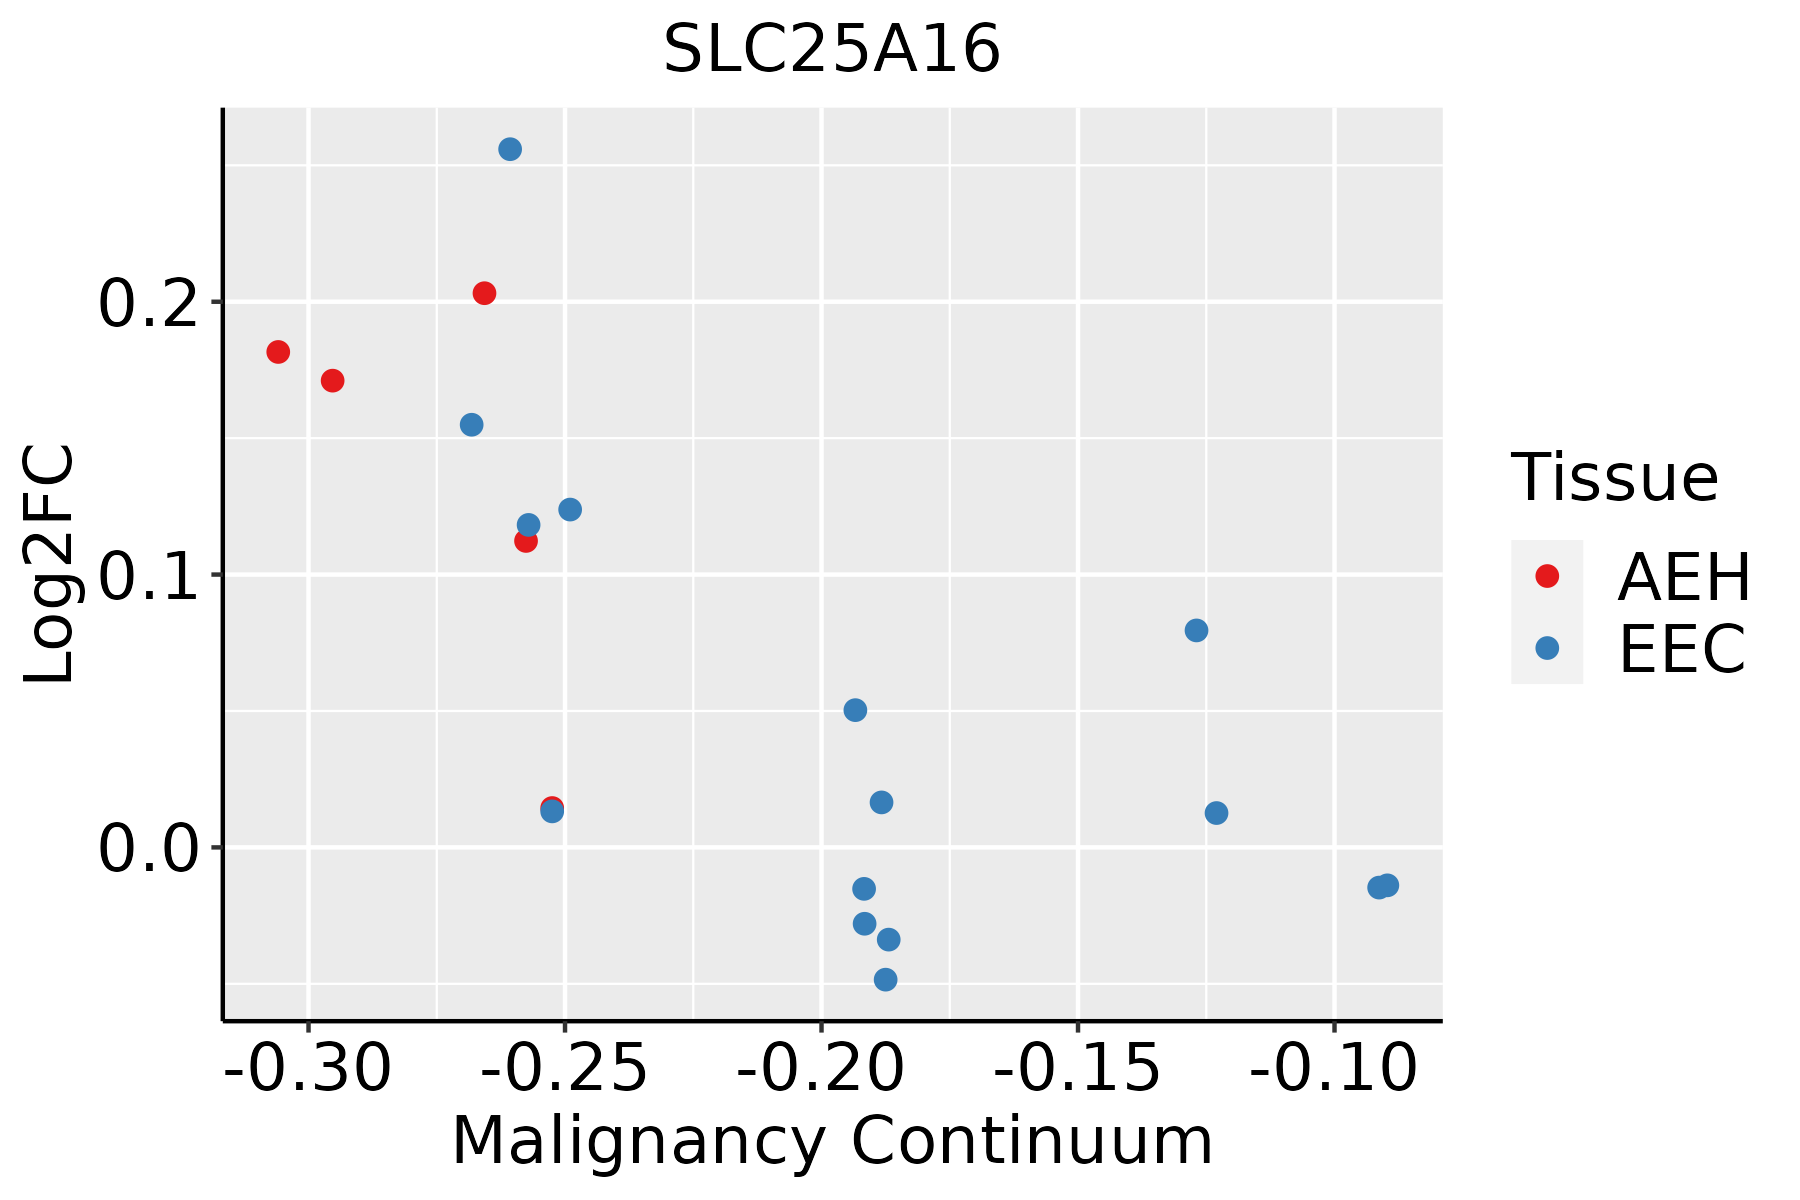 | AEH: Atypical endometrial hyperplasia |
| EEC: Endometrioid Cancer | ||
| Esophagus | 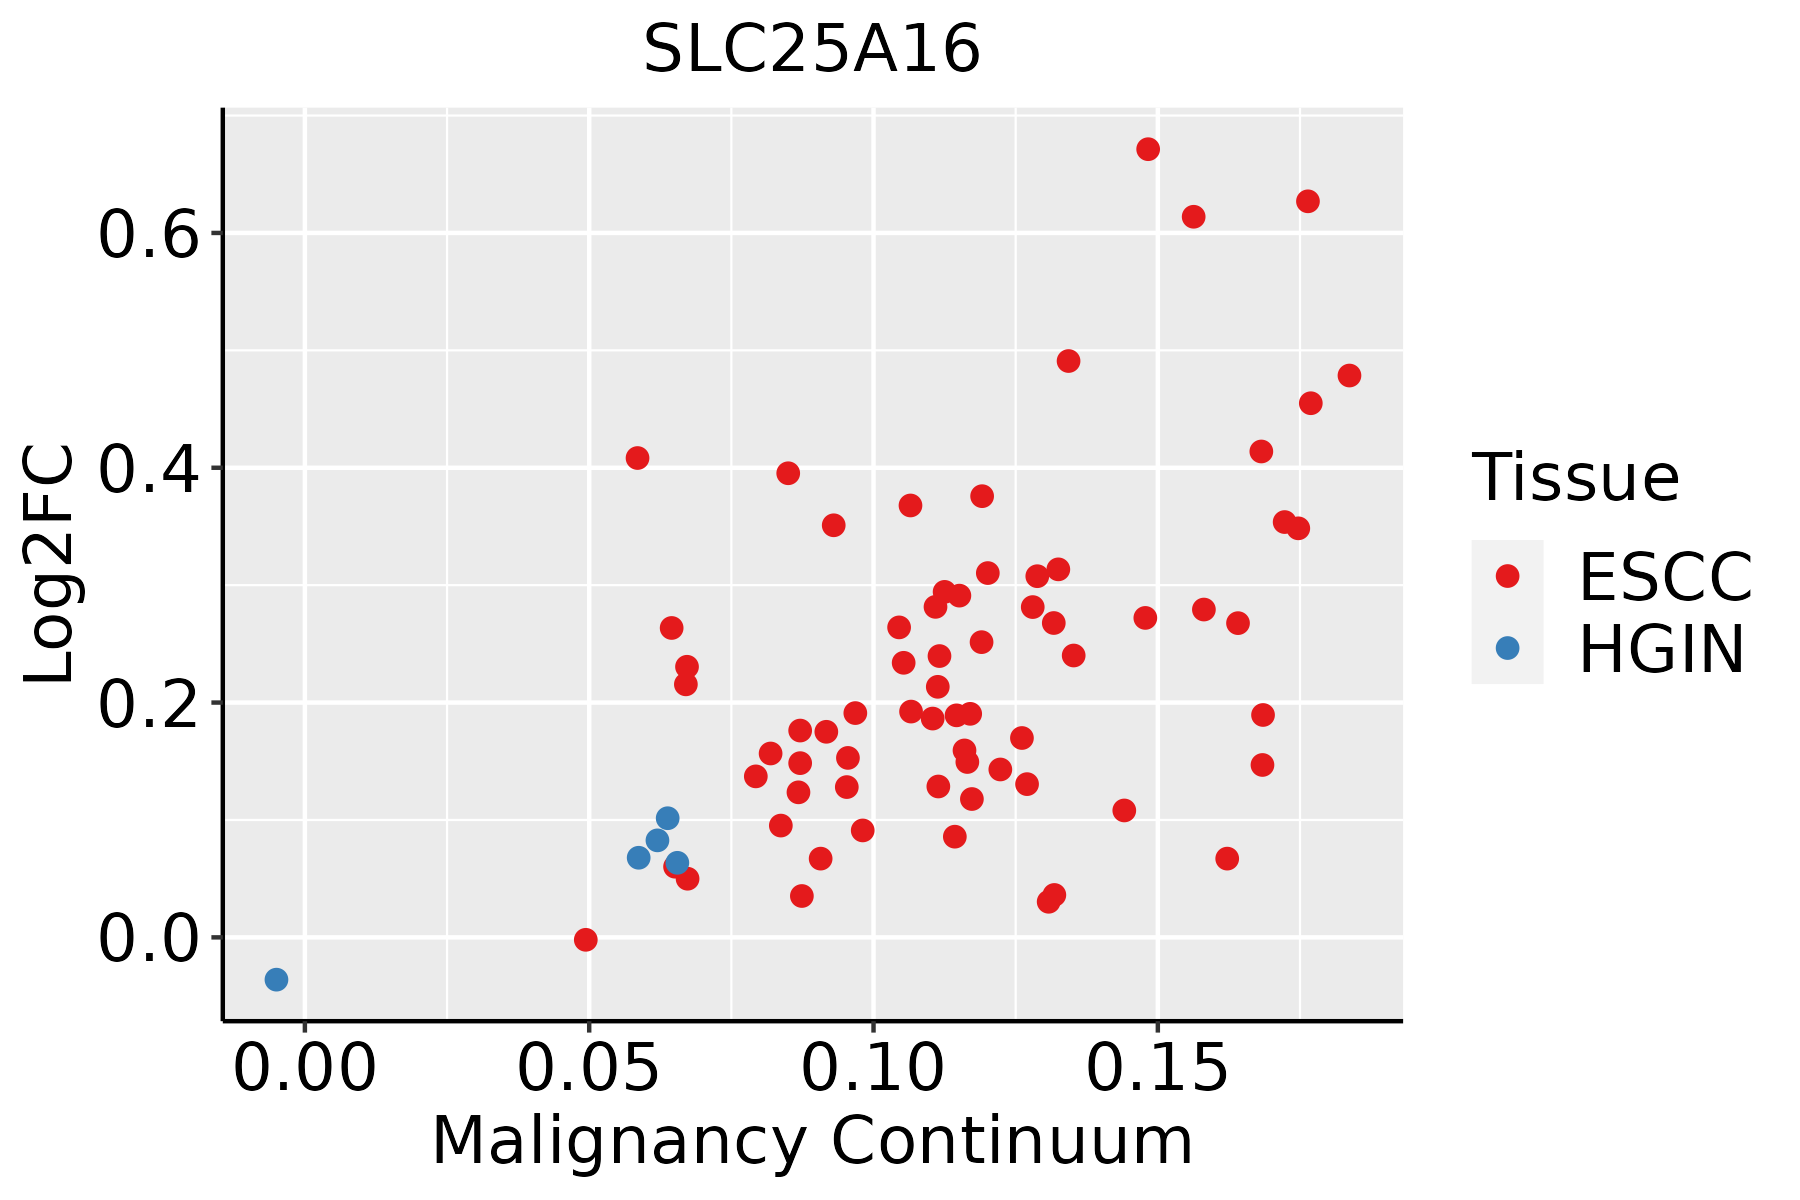 | ESCC: Esophageal squamous cell carcinoma |
| HGIN: High-grade intraepithelial neoplasias | ||
| LGIN: Low-grade intraepithelial neoplasias | ||
| Liver |  | HCC: Hepatocellular carcinoma |
| NAFLD: Non-alcoholic fatty liver disease | ||
| Lung | 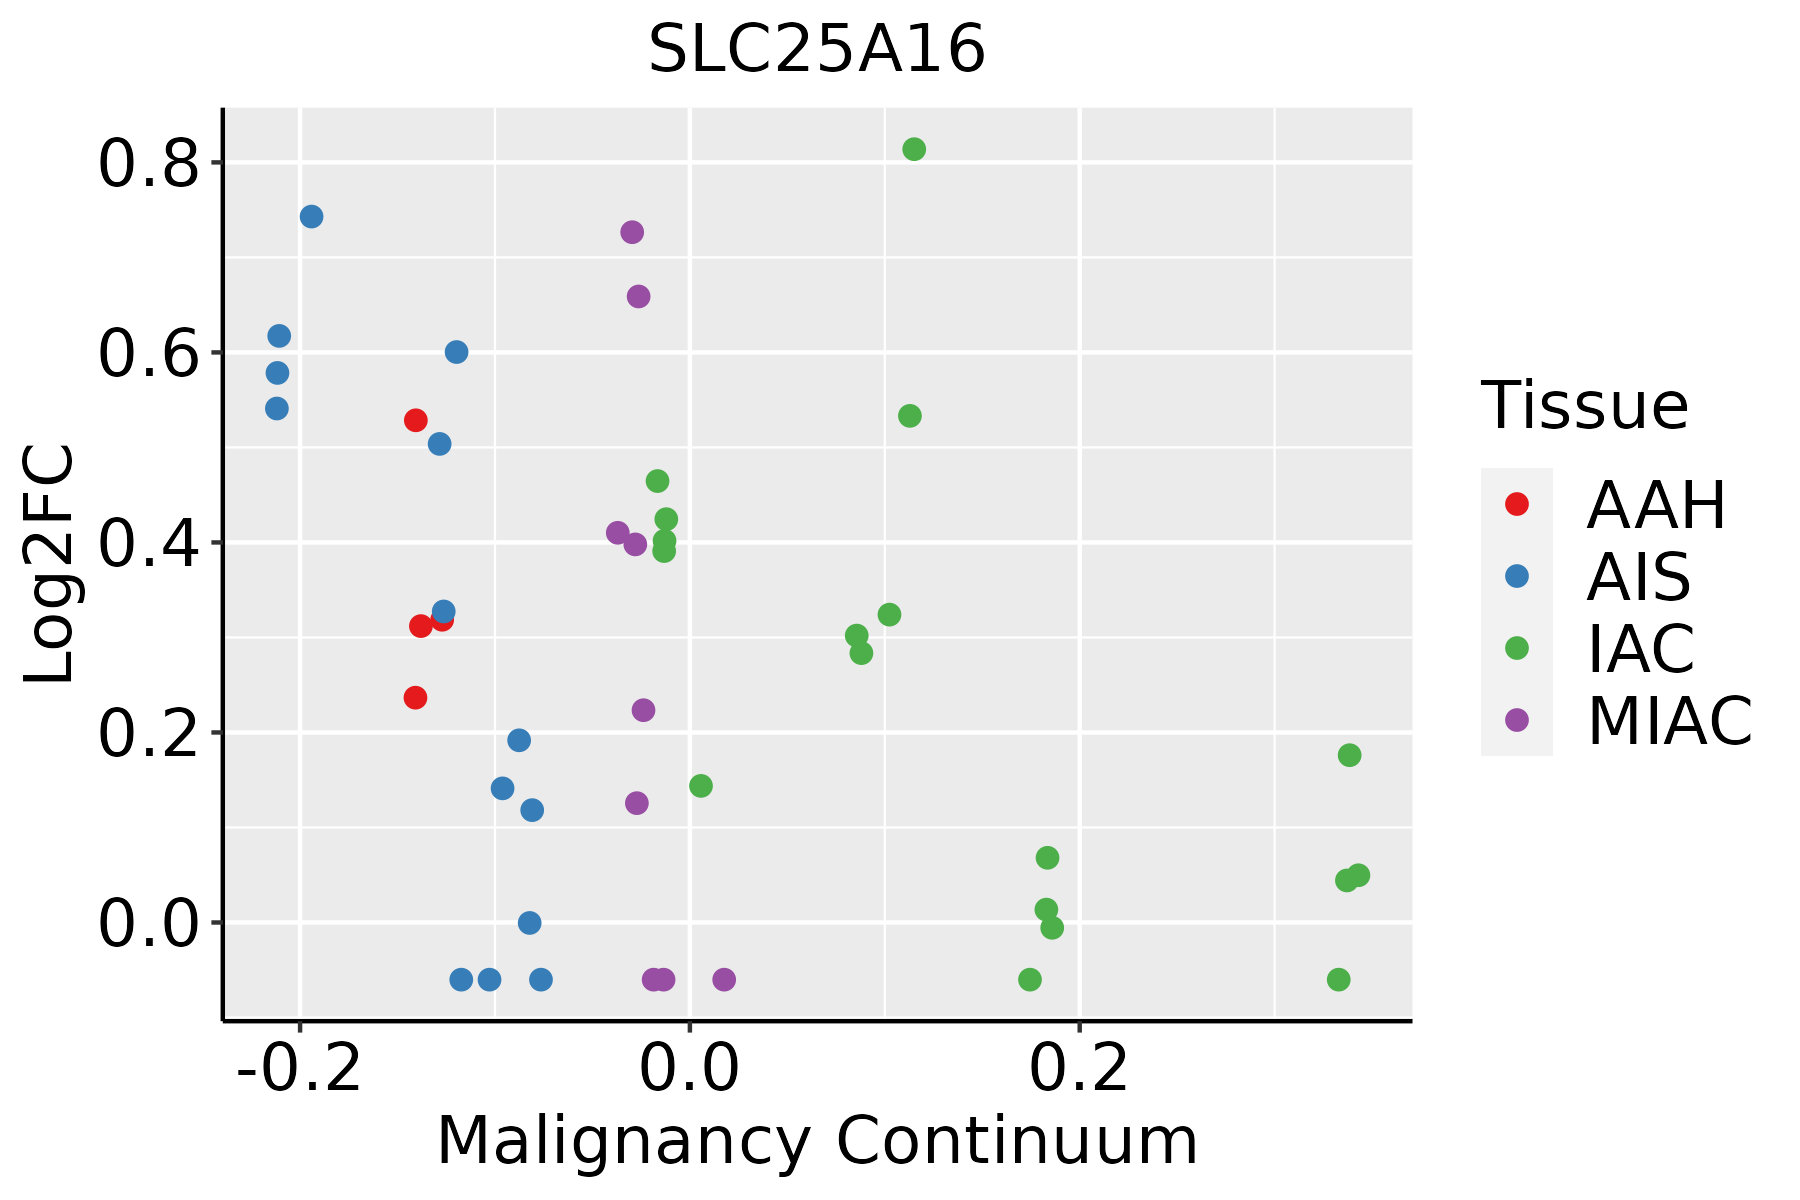 | AAH: Atypical adenomatous hyperplasia |
| AIS: Adenocarcinoma in situ | ||
| IAC: Invasive lung adenocarcinoma | ||
| MIA: Minimally invasive adenocarcinoma |
| ∗log2FC in expression of this searched gene in stem-like cells from each diseased tissue sample relative to stem-like cells in normal samples in each tissue plotted against the malignancy continuum. Samples are colored based on if they are from different disease stage. |
Top |
Malignant transformation related pathway analysis |
| Find out the enriched GO biological processes and KEGG pathways involved in transition from healthy to precancer to cancer |
| Tissue | Disease Stage | Enriched GO biological Processes |
| Colorectum | AD |  |
| Colorectum | SER |  |
| Colorectum | MSS |  |
| Colorectum | MSI-H |  |
| Colorectum | FAP |  |
| ∗Top 15 enriched GO BP terms are showed in the bar plot of each disease state in each tissue. Each row represents a significant GO biological process which is colored according to the -log10(p.adjust). |
| Page: 1 2 3 4 5 6 7 8 9 |
| GO ID | Tissue | Disease Stage | Description | Gene Ratio | Bg Ratio | pvalue | p.adjust | Count |
| GO:00340325 | Esophagus | ESCC | purine nucleoside bisphosphate metabolic process | 77/8552 | 128/18723 | 6.71e-04 | 3.55e-03 | 77 |
| GO:00159361 | Esophagus | ESCC | coenzyme A metabolic process | 15/8552 | 18/18723 | 1.20e-03 | 5.88e-03 | 15 |
| GO:00092596 | Liver | NAFLD | ribonucleotide metabolic process | 72/1882 | 385/18723 | 1.51e-07 | 1.09e-05 | 72 |
| GO:00196936 | Liver | NAFLD | ribose phosphate metabolic process | 73/1882 | 396/18723 | 2.23e-07 | 1.53e-05 | 73 |
| GO:00091177 | Liver | NAFLD | nucleotide metabolic process | 85/1882 | 489/18723 | 3.31e-07 | 2.18e-05 | 85 |
| GO:00067537 | Liver | NAFLD | nucleoside phosphate metabolic process | 85/1882 | 497/18723 | 6.69e-07 | 3.83e-05 | 85 |
| GO:00725217 | Liver | NAFLD | purine-containing compound metabolic process | 74/1882 | 416/18723 | 7.73e-07 | 4.27e-05 | 74 |
| GO:00091507 | Liver | NAFLD | purine ribonucleotide metabolic process | 67/1882 | 368/18723 | 1.10e-06 | 5.44e-05 | 67 |
| GO:00061637 | Liver | NAFLD | purine nucleotide metabolic process | 70/1882 | 396/18723 | 1.93e-06 | 8.23e-05 | 70 |
| GO:00338653 | Liver | NAFLD | nucleoside bisphosphate metabolic process | 28/1882 | 128/18723 | 5.89e-05 | 1.30e-03 | 28 |
| GO:00338753 | Liver | NAFLD | ribonucleoside bisphosphate metabolic process | 28/1882 | 128/18723 | 5.89e-05 | 1.30e-03 | 28 |
| GO:00340323 | Liver | NAFLD | purine nucleoside bisphosphate metabolic process | 28/1882 | 128/18723 | 5.89e-05 | 1.30e-03 | 28 |
| GO:000683912 | Liver | HCC | mitochondrial transport | 184/7958 | 254/18723 | 2.30e-22 | 3.83e-20 | 184 |
| GO:000911722 | Liver | HCC | nucleotide metabolic process | 300/7958 | 489/18723 | 1.61e-17 | 1.71e-15 | 300 |
| GO:000675322 | Liver | HCC | nucleoside phosphate metabolic process | 304/7958 | 497/18723 | 1.78e-17 | 1.85e-15 | 304 |
| GO:001969322 | Liver | HCC | ribose phosphate metabolic process | 248/7958 | 396/18723 | 3.15e-16 | 2.70e-14 | 248 |
| GO:000925922 | Liver | HCC | ribonucleotide metabolic process | 240/7958 | 385/18723 | 2.07e-15 | 1.51e-13 | 240 |
| GO:000915022 | Liver | HCC | purine ribonucleotide metabolic process | 226/7958 | 368/18723 | 1.36e-13 | 7.69e-12 | 226 |
| GO:007252122 | Liver | HCC | purine-containing compound metabolic process | 250/7958 | 416/18723 | 2.26e-13 | 1.24e-11 | 250 |
| GO:000616322 | Liver | HCC | purine nucleotide metabolic process | 236/7958 | 396/18723 | 3.59e-12 | 1.62e-10 | 236 |
| Page: 1 2 3 4 |
| Pathway ID | Tissue | Disease Stage | Description | Gene Ratio | Bg Ratio | pvalue | p.adjust | qvalue | Count |
| Page: 1 |
Top |
Cell-cell communication analysis |
| Identification of potential cell-cell interactions between two cell types and their ligand-receptor pairs for different disease states |
| Ligand | Receptor | LRpair | Pathway | Tissue | Disease Stage |
| Page: 1 |
Top |
Single-cell gene regulatory network inference analysis |
| Find out the significant the regulons (TFs) and the target genes of each regulon across cell types for different disease states |
| TF | Cell Type | Tissue | Disease Stage | Target Gene | RSS | Regulon Activity |
| ∗The dot plots of a searched regulon are shown for all cell subpopulations in each disease state of each tissue based on the regulon specific score inferred using pySCENIC and by calculating the average expression. |
| Page: 1 |
Top |
Somatic mutation of malignant transformation related genes |
| Annotation of somatic variants for genes involved in malignant transformation |
| Hugo Symbol | Variant Class | Variant Classification | dbSNP RS | HGVSc | HGVSp | HGVSp Short | SWISSPROT | BIOTYPE | SIFT | PolyPhen | Tumor Sample Barcode | Tissue | Histology | Sex | Age | Stage | Therapy Types | Drugs | Outcome |
| SLC25A16 | SNV | Missense_Mutation | c.983N>C | p.Phe328Ser | p.F328S | P16260 | protein_coding | tolerated(0.17) | benign(0.216) | TCGA-C8-A26Y-01 | Breast | breast invasive carcinoma | Female | >=65 | I/II | Unknown | Unknown | SD | |
| SLC25A16 | SNV | Missense_Mutation | novel | c.119T>G | p.Phe40Cys | p.F40C | P16260 | protein_coding | deleterious(0.01) | probably_damaging(0.967) | TCGA-2W-A8YY-01 | Cervix | cervical & endocervical cancer | Female | <65 | I/II | Chemotherapy | cisplatin | CR |
| SLC25A16 | SNV | Missense_Mutation | c.890G>T | p.Arg297Leu | p.R297L | P16260 | protein_coding | tolerated(0.67) | benign(0.047) | TCGA-JW-A5VI-01 | Cervix | cervical & endocervical cancer | Female | <65 | I/II | Chemotherapy | topotecan | PD | |
| SLC25A16 | SNV | Missense_Mutation | novel | c.781T>A | p.Phe261Ile | p.F261I | P16260 | protein_coding | deleterious(0.02) | benign(0.1) | TCGA-AA-3947-01 | Colorectum | colon adenocarcinoma | Female | <65 | I/II | Unknown | Unknown | SD |
| SLC25A16 | SNV | Missense_Mutation | c.656N>T | p.Ser219Phe | p.S219F | P16260 | protein_coding | tolerated(0.1) | possibly_damaging(0.482) | TCGA-AZ-4313-01 | Colorectum | colon adenocarcinoma | Female | <65 | I/II | Unknown | Unknown | SD | |
| SLC25A16 | SNV | Missense_Mutation | rs747313620 | c.967G>A | p.Glu323Lys | p.E323K | P16260 | protein_coding | deleterious(0) | probably_damaging(0.998) | TCGA-AZ-4315-01 | Colorectum | colon adenocarcinoma | Male | <65 | I/II | Unknown | Unknown | SD |
| SLC25A16 | SNV | Missense_Mutation | novel | c.191N>C | p.Leu64Ser | p.L64S | P16260 | protein_coding | deleterious(0) | benign(0.314) | TCGA-A5-A0G2-01 | Endometrium | uterine corpus endometrioid carcinoma | Female | <65 | III/IV | Unknown | Unknown | SD |
| SLC25A16 | SNV | Missense_Mutation | c.374N>C | p.Leu125Pro | p.L125P | P16260 | protein_coding | deleterious(0.02) | possibly_damaging(0.761) | TCGA-A5-A0GW-01 | Endometrium | uterine corpus endometrioid carcinoma | Female | <65 | I/II | Unknown | Unknown | SD | |
| SLC25A16 | SNV | Missense_Mutation | rs139107749 | c.889N>G | p.Arg297Gly | p.R297G | P16260 | protein_coding | tolerated(0.33) | possibly_damaging(0.489) | TCGA-A5-A2K5-01 | Endometrium | uterine corpus endometrioid carcinoma | Female | >=65 | I/II | Unknown | Unknown | SD |
| SLC25A16 | SNV | Missense_Mutation | novel | c.398N>A | p.Arg133Lys | p.R133K | P16260 | protein_coding | tolerated(1) | benign(0.145) | TCGA-AJ-A3EK-01 | Endometrium | uterine corpus endometrioid carcinoma | Female | <65 | I/II | Chemotherapy | carboplatin | CR |
| Page: 1 2 3 |
Top |
Related drugs of malignant transformation related genes |
| Identification of chemicals and drugs interact with genes involved in malignant transfromation |
| (DGIdb 4.0) |
| Entrez ID | Symbol | Category | Interaction Types | Drug Claim Name | Drug Name | PMIDs |
| Page: 1 |

Copyright 2023-Present -The University of Texas Health Science Center at Houston |