
|
|||||
|
 | |
| |
| |
| |
| |
| |
|
Gene: SIL1 |
Gene summary for SIL1 |
| Gene information | Species | Human | Gene symbol | SIL1 | Gene ID | 64374 |
| Gene name | SIL1 nucleotide exchange factor | |
| Gene Alias | BAP | |
| Cytomap | 5q31.2 | |
| Gene Type | protein-coding | GO ID | GO:0006457 | UniProtAcc | A0A0S2Z6B4 |
Top |
Malignant transformation analysis |
| Identification of the aberrant gene expression in precancerous and cancerous lesions by comparing the gene expression of stem-like cells in diseased tissues with normal stem cells |
| Entrez ID | Symbol | Replicates | Species | Organ | Tissue | Adj P-value | Log2FC | Malignancy |
| 64374 | SIL1 | CCI_2 | Human | Cervix | CC | 7.03e-04 | 6.96e-01 | 0.5249 |
| 64374 | SIL1 | CCI_3 | Human | Cervix | CC | 5.37e-04 | 5.86e-01 | 0.516 |
| 64374 | SIL1 | L1 | Human | Cervix | CC | 2.92e-03 | -1.99e-01 | 0.0802 |
| 64374 | SIL1 | HTA11_3410_2000001011 | Human | Colorectum | AD | 2.92e-09 | -3.94e-01 | 0.0155 |
| 64374 | SIL1 | HTA11_1938_2000001011 | Human | Colorectum | AD | 1.15e-02 | -7.50e-02 | -0.0811 |
| 64374 | SIL1 | HTA11_866_3004761011 | Human | Colorectum | AD | 1.74e-02 | -2.57e-01 | 0.096 |
| 64374 | SIL1 | A015-C-203 | Human | Colorectum | FAP | 1.07e-25 | -2.28e-01 | -0.1294 |
| 64374 | SIL1 | A015-C-204 | Human | Colorectum | FAP | 1.10e-04 | -1.16e-01 | -0.0228 |
| 64374 | SIL1 | A014-C-040 | Human | Colorectum | FAP | 2.58e-03 | -2.06e-01 | -0.1184 |
| 64374 | SIL1 | A002-C-201 | Human | Colorectum | FAP | 5.32e-09 | -1.07e-01 | 0.0324 |
| 64374 | SIL1 | A002-C-203 | Human | Colorectum | FAP | 5.50e-03 | 9.66e-02 | 0.2786 |
| 64374 | SIL1 | A001-C-119 | Human | Colorectum | FAP | 1.41e-05 | -2.25e-01 | -0.1557 |
| 64374 | SIL1 | A001-C-108 | Human | Colorectum | FAP | 4.40e-14 | -8.12e-02 | -0.0272 |
| 64374 | SIL1 | A002-C-205 | Human | Colorectum | FAP | 2.16e-18 | -2.30e-01 | -0.1236 |
| 64374 | SIL1 | A015-C-006 | Human | Colorectum | FAP | 6.22e-13 | -2.61e-01 | -0.0994 |
| 64374 | SIL1 | A015-C-106 | Human | Colorectum | FAP | 1.49e-08 | -1.57e-01 | -0.0511 |
| 64374 | SIL1 | A002-C-114 | Human | Colorectum | FAP | 3.66e-18 | -1.89e-01 | -0.1561 |
| 64374 | SIL1 | A015-C-104 | Human | Colorectum | FAP | 3.69e-27 | -3.25e-01 | -0.1899 |
| 64374 | SIL1 | A001-C-014 | Human | Colorectum | FAP | 4.43e-10 | -1.23e-01 | 0.0135 |
| 64374 | SIL1 | A002-C-016 | Human | Colorectum | FAP | 2.67e-19 | -1.08e-01 | 0.0521 |
| Page: 1 2 3 4 5 6 7 8 |
| Tissue | Expression Dynamics | Abbreviation |
| Cervix | 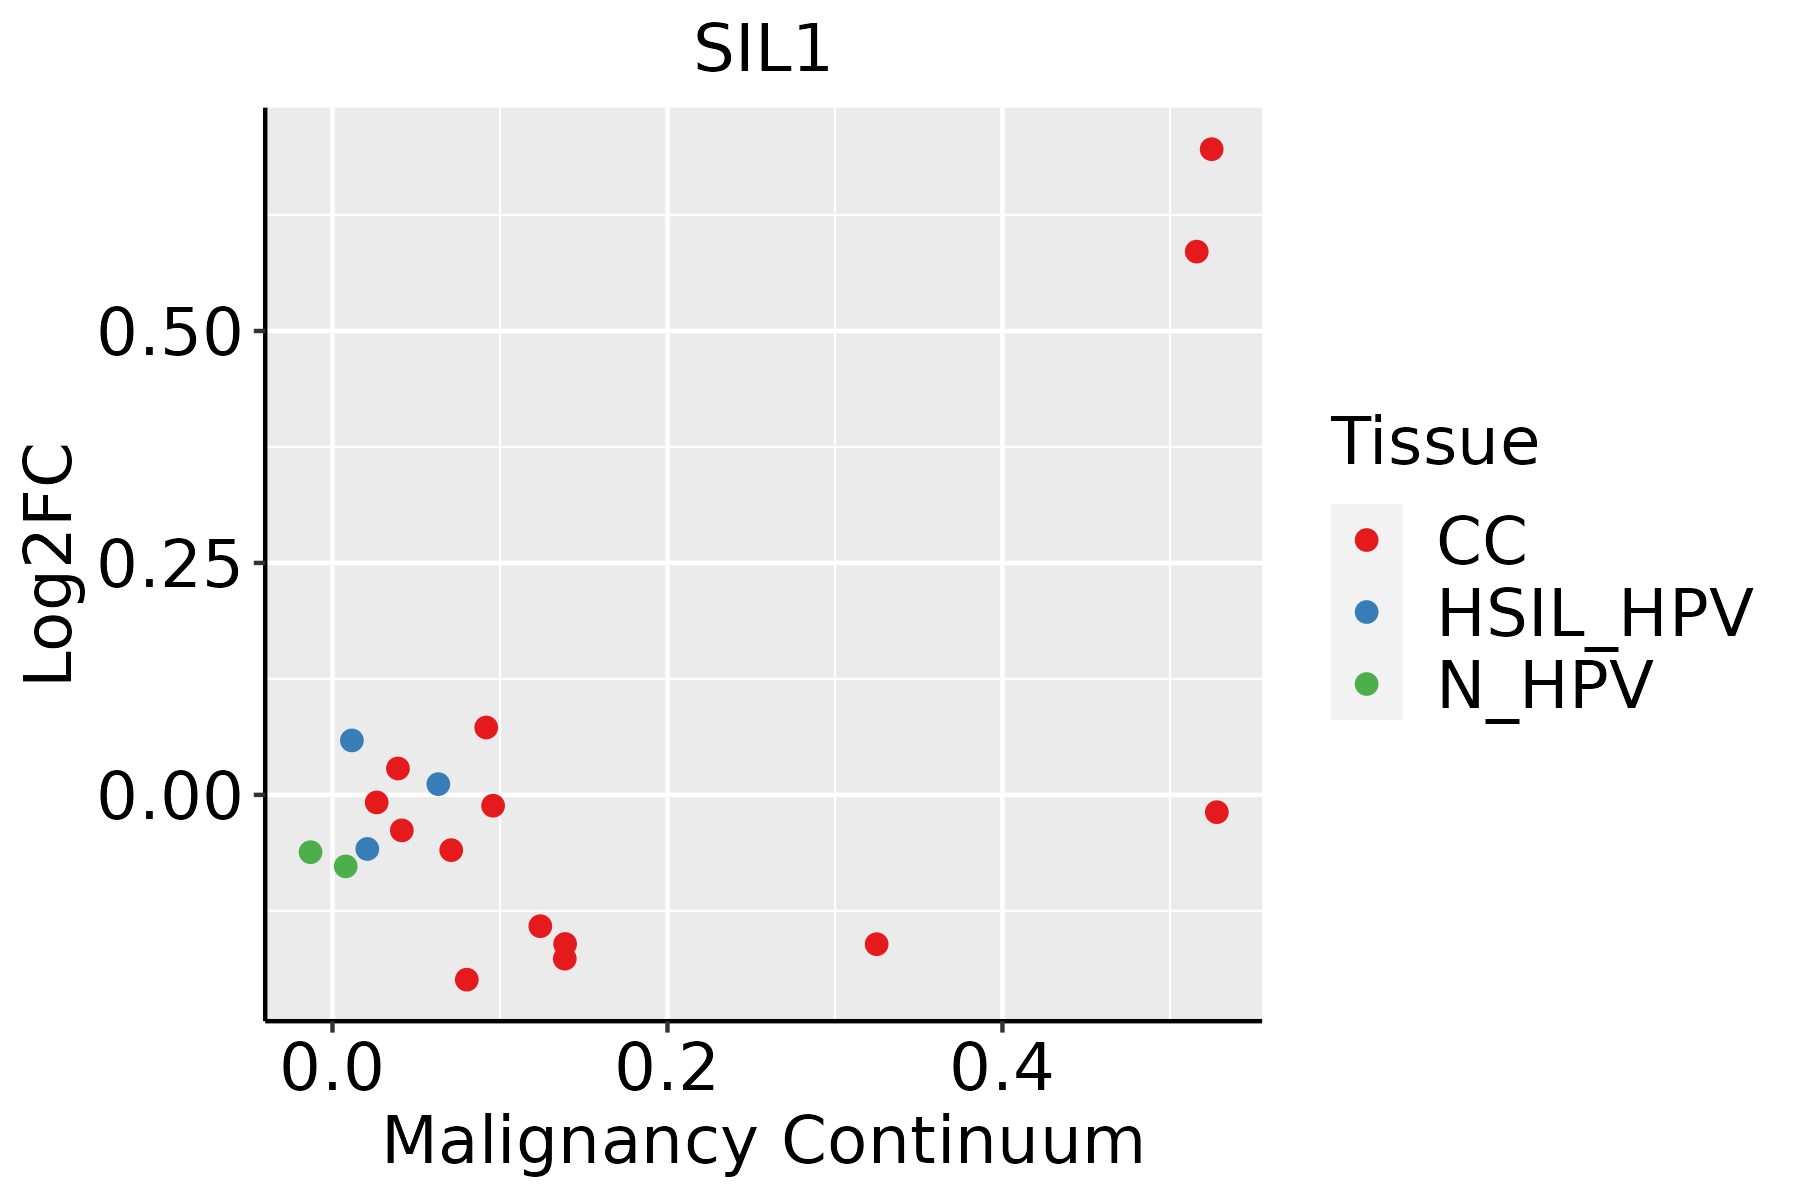 | CC: Cervix cancer |
| HSIL_HPV: HPV-infected high-grade squamous intraepithelial lesions | ||
| N_HPV: HPV-infected normal cervix | ||
| Colorectum (GSE201348) |  | FAP: Familial adenomatous polyposis |
| CRC: Colorectal cancer | ||
| Colorectum (HTA11) |  | AD: Adenomas |
| SER: Sessile serrated lesions | ||
| MSI-H: Microsatellite-high colorectal cancer | ||
| MSS: Microsatellite stable colorectal cancer | ||
| Esophagus | 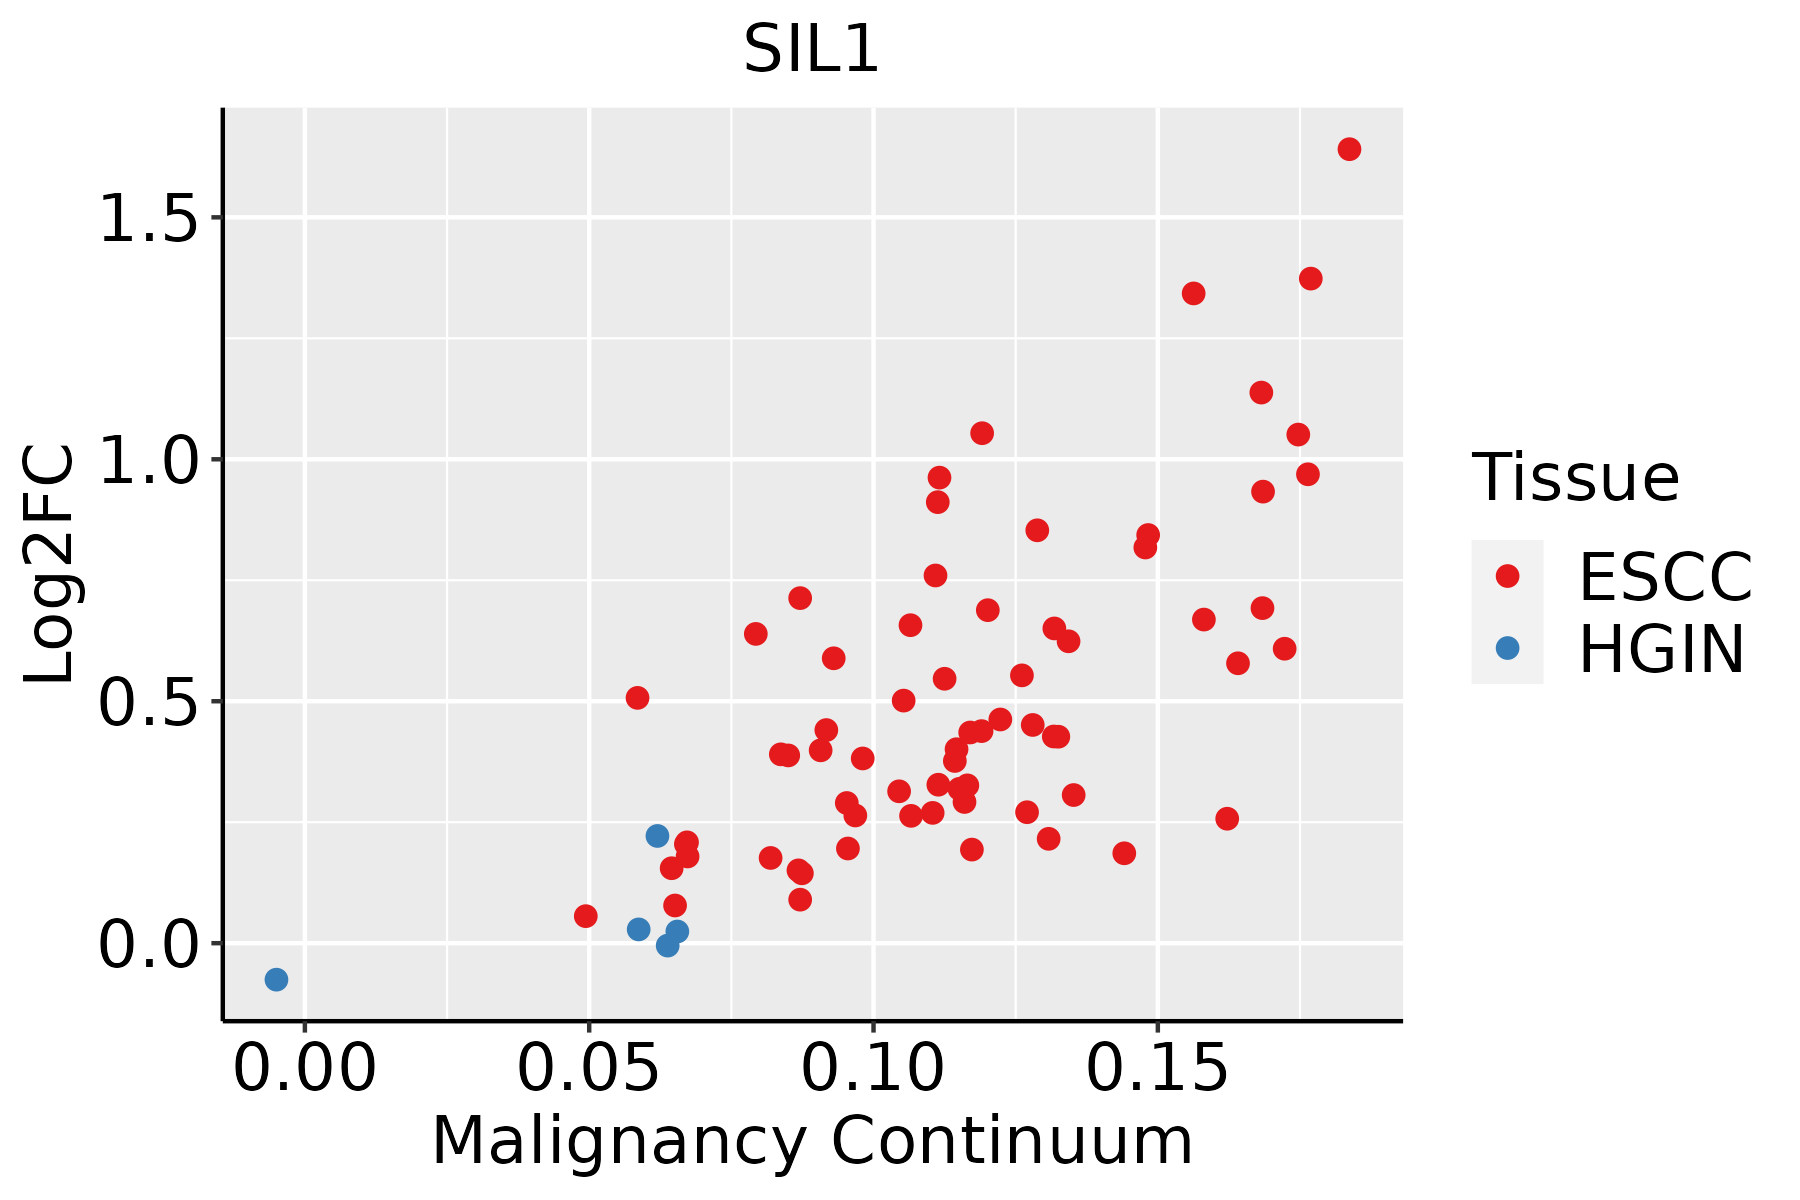 | ESCC: Esophageal squamous cell carcinoma |
| HGIN: High-grade intraepithelial neoplasias | ||
| LGIN: Low-grade intraepithelial neoplasias | ||
| Liver | 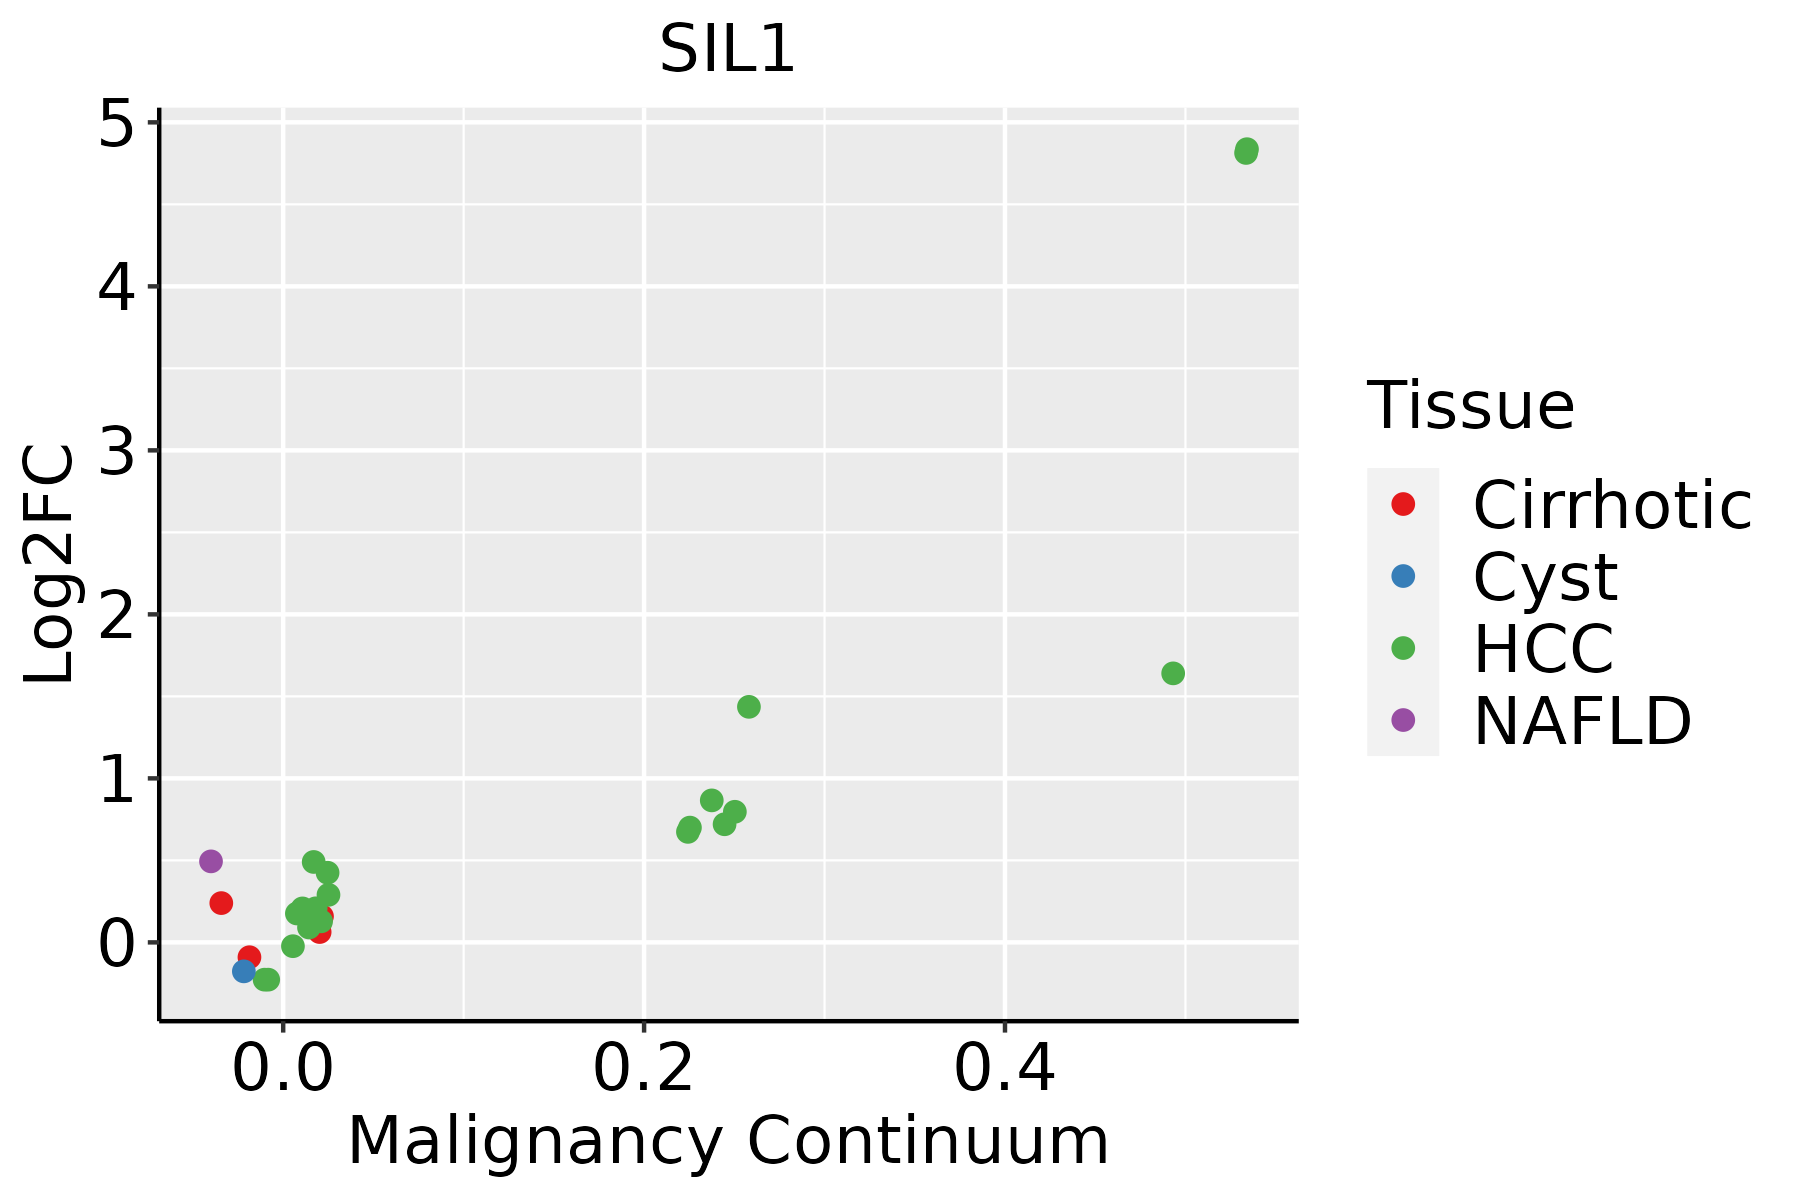 | HCC: Hepatocellular carcinoma |
| NAFLD: Non-alcoholic fatty liver disease | ||
| Lung | 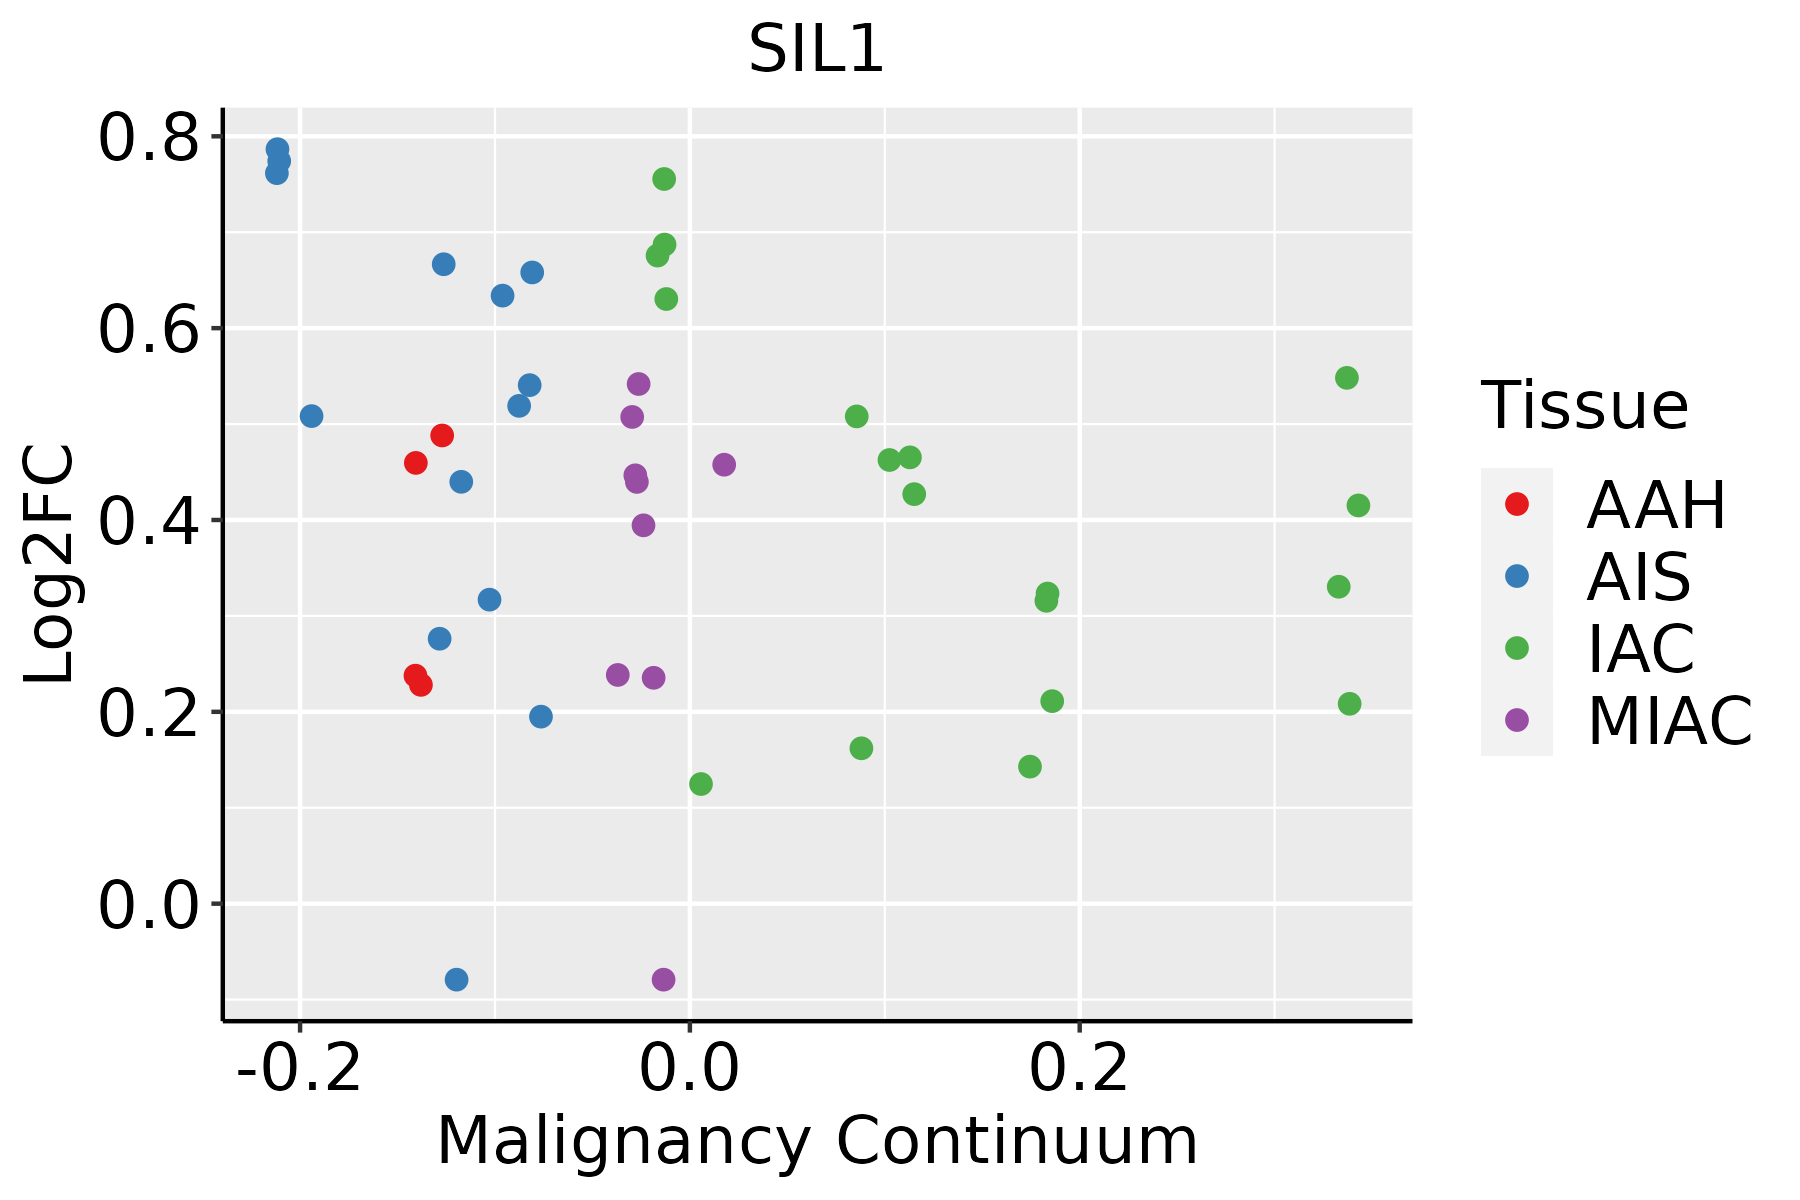 | AAH: Atypical adenomatous hyperplasia |
| AIS: Adenocarcinoma in situ | ||
| IAC: Invasive lung adenocarcinoma | ||
| MIA: Minimally invasive adenocarcinoma | ||
| Oral Cavity | 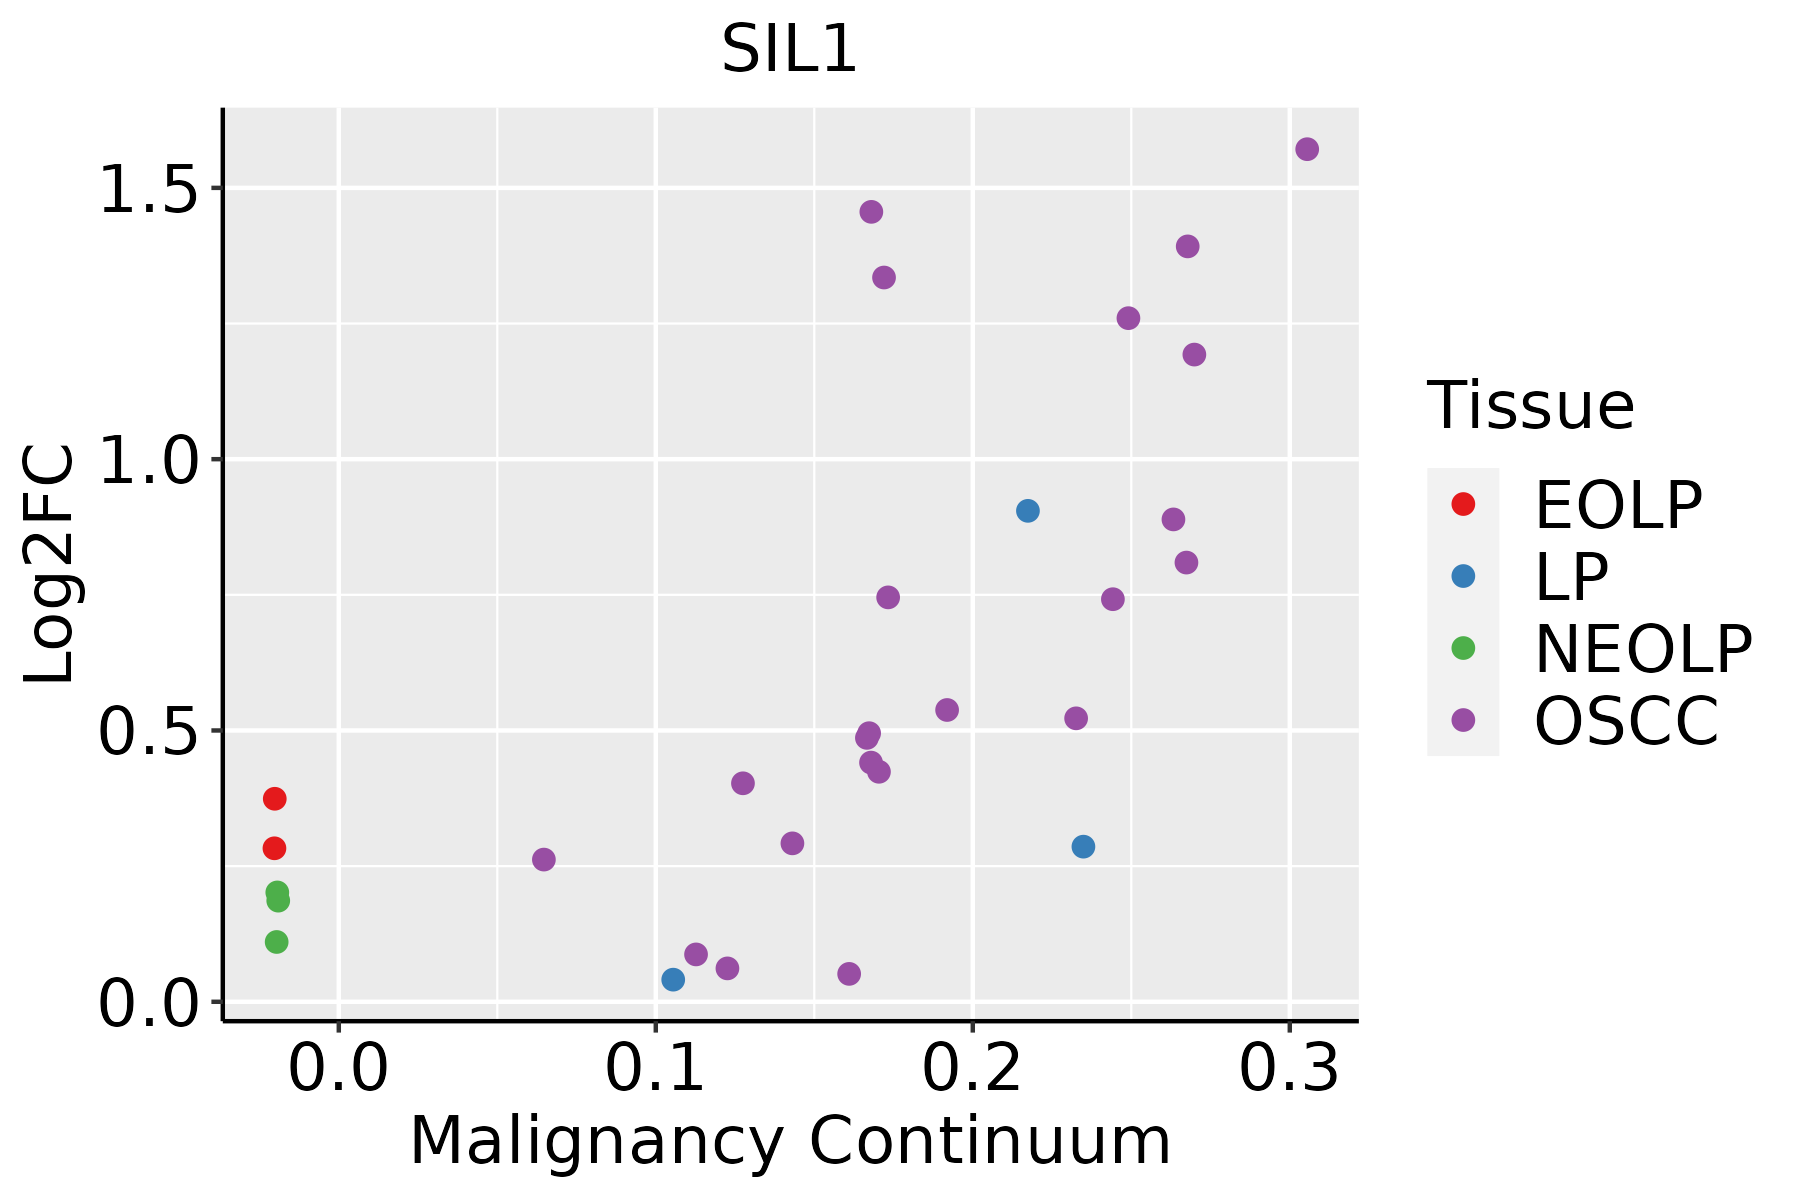 | EOLP: Erosive Oral lichen planus |
| LP: leukoplakia | ||
| NEOLP: Non-erosive oral lichen planus | ||
| OSCC: Oral squamous cell carcinoma | ||
| Prostate |  | BPH: Benign Prostatic Hyperplasia |
| Skin | 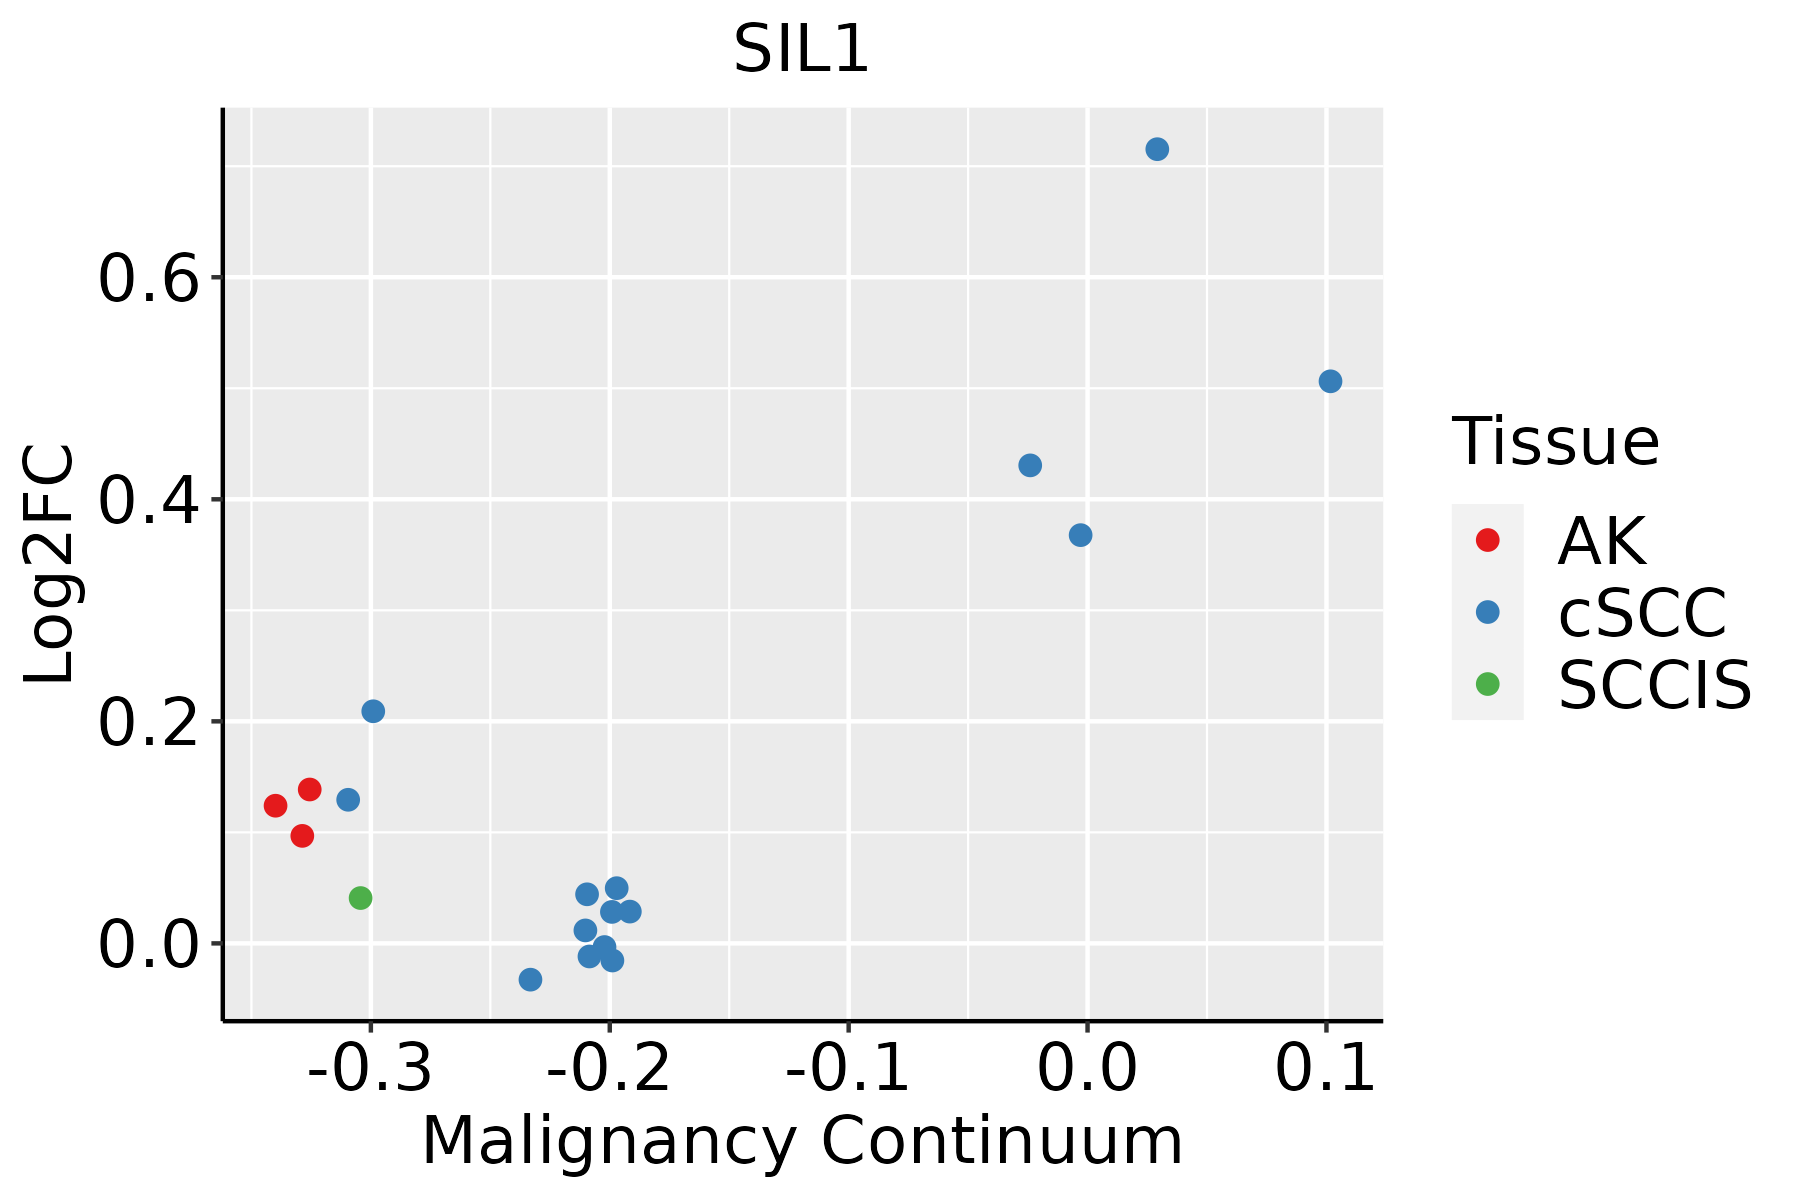 | AK: Actinic keratosis |
| cSCC: Cutaneous squamous cell carcinoma | ||
| SCCIS:squamous cell carcinoma in situ | ||
| Thyroid |  | ATC: Anaplastic thyroid cancer |
| HT: Hashimoto's thyroiditis | ||
| PTC: Papillary thyroid cancer |
| ∗log2FC in expression of this searched gene in stem-like cells from each diseased tissue sample relative to stem-like cells in normal samples in each tissue plotted against the malignancy continuum. Samples are colored based on if they are from different disease stage. |
Top |
Malignant transformation related pathway analysis |
| Find out the enriched GO biological processes and KEGG pathways involved in transition from healthy to precancer to cancer |
| Tissue | Disease Stage | Enriched GO biological Processes |
| Colorectum | AD |  |
| Colorectum | SER |  |
| Colorectum | MSS |  |
| Colorectum | MSI-H |  |
| Colorectum | FAP |  |
| ∗Top 15 enriched GO BP terms are showed in the bar plot of each disease state in each tissue. Each row represents a significant GO biological process which is colored according to the -log10(p.adjust). |
| Page: 1 2 3 4 5 6 7 8 9 |
| GO ID | Tissue | Disease Stage | Description | Gene Ratio | Bg Ratio | pvalue | p.adjust | Count |
| GO:00066132 | Liver | Cirrhotic | cotranslational protein targeting to membrane | 17/4634 | 31/18723 | 3.19e-04 | 2.77e-03 | 17 |
| GO:000660512 | Liver | HCC | protein targeting | 219/7958 | 314/18723 | 7.74e-23 | 1.49e-20 | 219 |
| GO:000645712 | Liver | HCC | protein folding | 160/7958 | 212/18723 | 1.07e-22 | 1.88e-20 | 160 |
| GO:009015012 | Liver | HCC | establishment of protein localization to membrane | 168/7958 | 260/18723 | 4.07e-13 | 2.13e-11 | 168 |
| GO:00066121 | Liver | HCC | protein targeting to membrane | 75/7958 | 131/18723 | 4.58e-04 | 3.04e-03 | 75 |
| GO:00066131 | Liver | HCC | cotranslational protein targeting to membrane | 20/7958 | 31/18723 | 1.11e-02 | 4.09e-02 | 20 |
| GO:00066058 | Lung | IAC | protein targeting | 51/2061 | 314/18723 | 2.91e-03 | 2.61e-02 | 51 |
| GO:00901508 | Lung | IAC | establishment of protein localization to membrane | 43/2061 | 260/18723 | 4.25e-03 | 3.39e-02 | 43 |
| GO:000660513 | Lung | AIS | protein targeting | 49/1849 | 314/18723 | 8.56e-04 | 1.17e-02 | 49 |
| GO:009015013 | Lung | AIS | establishment of protein localization to membrane | 42/1849 | 260/18723 | 9.73e-04 | 1.28e-02 | 42 |
| GO:000645718 | Oral cavity | OSCC | protein folding | 154/7305 | 212/18723 | 1.89e-23 | 4.60e-21 | 154 |
| GO:000660520 | Oral cavity | OSCC | protein targeting | 204/7305 | 314/18723 | 6.78e-21 | 1.13e-18 | 204 |
| GO:009015018 | Oral cavity | OSCC | establishment of protein localization to membrane | 163/7305 | 260/18723 | 7.13e-15 | 4.47e-13 | 163 |
| GO:00066123 | Oral cavity | OSCC | protein targeting to membrane | 75/7305 | 131/18723 | 1.72e-05 | 1.69e-04 | 75 |
| GO:000645725 | Oral cavity | EOLP | protein folding | 59/2218 | 212/18723 | 1.76e-10 | 1.79e-08 | 59 |
| GO:000660524 | Oral cavity | EOLP | protein targeting | 68/2218 | 314/18723 | 4.95e-07 | 1.34e-05 | 68 |
| GO:009015022 | Oral cavity | EOLP | establishment of protein localization to membrane | 45/2218 | 260/18723 | 5.73e-03 | 2.94e-02 | 45 |
| GO:000645716 | Prostate | BPH | protein folding | 85/3107 | 212/18723 | 2.37e-16 | 4.74e-14 | 85 |
| GO:000660518 | Prostate | BPH | protein targeting | 102/3107 | 314/18723 | 2.51e-12 | 2.05e-10 | 102 |
| GO:009015016 | Prostate | BPH | establishment of protein localization to membrane | 77/3107 | 260/18723 | 1.06e-07 | 2.56e-06 | 77 |
| Page: 1 2 3 |
| Pathway ID | Tissue | Disease Stage | Description | Gene Ratio | Bg Ratio | pvalue | p.adjust | qvalue | Count |
| hsa0414120 | Cervix | CC | Protein processing in endoplasmic reticulum | 55/1267 | 174/8465 | 1.74e-08 | 2.68e-07 | 1.58e-07 | 55 |
| hsa04141110 | Cervix | CC | Protein processing in endoplasmic reticulum | 55/1267 | 174/8465 | 1.74e-08 | 2.68e-07 | 1.58e-07 | 55 |
| hsa04141 | Colorectum | AD | Protein processing in endoplasmic reticulum | 80/2092 | 174/8465 | 5.96e-10 | 1.25e-08 | 7.96e-09 | 80 |
| hsa041411 | Colorectum | AD | Protein processing in endoplasmic reticulum | 80/2092 | 174/8465 | 5.96e-10 | 1.25e-08 | 7.96e-09 | 80 |
| hsa041418 | Colorectum | FAP | Protein processing in endoplasmic reticulum | 50/1404 | 174/8465 | 3.64e-05 | 3.68e-04 | 2.24e-04 | 50 |
| hsa041419 | Colorectum | FAP | Protein processing in endoplasmic reticulum | 50/1404 | 174/8465 | 3.64e-05 | 3.68e-04 | 2.24e-04 | 50 |
| hsa04141211 | Esophagus | ESCC | Protein processing in endoplasmic reticulum | 147/4205 | 174/8465 | 3.29e-22 | 1.10e-19 | 5.64e-20 | 147 |
| hsa04141310 | Esophagus | ESCC | Protein processing in endoplasmic reticulum | 147/4205 | 174/8465 | 3.29e-22 | 1.10e-19 | 5.64e-20 | 147 |
| hsa0414114 | Liver | Cirrhotic | Protein processing in endoplasmic reticulum | 114/2530 | 174/8465 | 1.16e-22 | 9.67e-21 | 5.96e-21 | 114 |
| hsa0414115 | Liver | Cirrhotic | Protein processing in endoplasmic reticulum | 114/2530 | 174/8465 | 1.16e-22 | 9.67e-21 | 5.96e-21 | 114 |
| hsa0414122 | Liver | HCC | Protein processing in endoplasmic reticulum | 146/4020 | 174/8465 | 7.34e-24 | 2.46e-21 | 1.37e-21 | 146 |
| hsa0414132 | Liver | HCC | Protein processing in endoplasmic reticulum | 146/4020 | 174/8465 | 7.34e-24 | 2.46e-21 | 1.37e-21 | 146 |
| hsa0414116 | Lung | IAC | Protein processing in endoplasmic reticulum | 37/1053 | 174/8465 | 6.53e-04 | 5.73e-03 | 3.81e-03 | 37 |
| hsa0414117 | Lung | IAC | Protein processing in endoplasmic reticulum | 37/1053 | 174/8465 | 6.53e-04 | 5.73e-03 | 3.81e-03 | 37 |
| hsa0414123 | Lung | AIS | Protein processing in endoplasmic reticulum | 35/961 | 174/8465 | 4.88e-04 | 4.39e-03 | 2.81e-03 | 35 |
| hsa0414133 | Lung | AIS | Protein processing in endoplasmic reticulum | 35/961 | 174/8465 | 4.88e-04 | 4.39e-03 | 2.81e-03 | 35 |
| hsa0414130 | Oral cavity | OSCC | Protein processing in endoplasmic reticulum | 143/3704 | 174/8465 | 6.82e-26 | 2.28e-23 | 1.16e-23 | 143 |
| hsa04141113 | Oral cavity | OSCC | Protein processing in endoplasmic reticulum | 143/3704 | 174/8465 | 6.82e-26 | 2.28e-23 | 1.16e-23 | 143 |
| hsa0414145 | Oral cavity | EOLP | Protein processing in endoplasmic reticulum | 70/1218 | 174/8465 | 2.84e-17 | 3.06e-15 | 1.81e-15 | 70 |
| hsa0414155 | Oral cavity | EOLP | Protein processing in endoplasmic reticulum | 70/1218 | 174/8465 | 2.84e-17 | 3.06e-15 | 1.81e-15 | 70 |
| Page: 1 2 |
Top |
Cell-cell communication analysis |
| Identification of potential cell-cell interactions between two cell types and their ligand-receptor pairs for different disease states |
| Ligand | Receptor | LRpair | Pathway | Tissue | Disease Stage |
| Page: 1 |
Top |
Single-cell gene regulatory network inference analysis |
| Find out the significant the regulons (TFs) and the target genes of each regulon across cell types for different disease states |
| TF | Cell Type | Tissue | Disease Stage | Target Gene | RSS | Regulon Activity |
| ∗The dot plots of a searched regulon are shown for all cell subpopulations in each disease state of each tissue based on the regulon specific score inferred using pySCENIC and by calculating the average expression. |
| Page: 1 |
Top |
Somatic mutation of malignant transformation related genes |
| Annotation of somatic variants for genes involved in malignant transformation |
| Hugo Symbol | Variant Class | Variant Classification | dbSNP RS | HGVSc | HGVSp | HGVSp Short | SWISSPROT | BIOTYPE | SIFT | PolyPhen | Tumor Sample Barcode | Tissue | Histology | Sex | Age | Stage | Therapy Types | Drugs | Outcome |
| SIL1 | SNV | Missense_Mutation | novel | c.126C>G | p.Asn42Lys | p.N42K | Q9H173 | protein_coding | tolerated(1) | benign(0.003) | TCGA-C8-A8HQ-01 | Breast | breast invasive carcinoma | Female | <65 | I/II | Unknown | Unknown | SD |
| SIL1 | SNV | Missense_Mutation | c.299G>C | p.Arg100Thr | p.R100T | Q9H173 | protein_coding | deleterious(0) | benign(0.389) | TCGA-GM-A2DH-01 | Breast | breast invasive carcinoma | Female | <65 | I/II | Chemotherapy | taxol | CR | |
| SIL1 | deletion | Frame_Shift_Del | novel | c.563delN | p.Leu188ArgfsTer44 | p.L188Rfs*44 | Q9H173 | protein_coding | TCGA-D8-A27V-01 | Breast | breast invasive carcinoma | Female | <65 | I/II | Hormone Therapy | tamoxiphen | SD | ||
| SIL1 | deletion | Frame_Shift_Del | novel | c.315delN | p.Gln105HisfsTer10 | p.Q105Hfs*10 | Q9H173 | protein_coding | TCGA-D8-A27V-01 | Breast | breast invasive carcinoma | Female | <65 | I/II | Hormone Therapy | tamoxiphen | SD | ||
| SIL1 | SNV | Missense_Mutation | novel | c.88C>A | p.Leu30Ile | p.L30I | Q9H173 | protein_coding | deleterious(0.04) | benign(0.359) | TCGA-AA-3950-01 | Colorectum | colon adenocarcinoma | Female | >=65 | I/II | Unknown | Unknown | SD |
| SIL1 | SNV | Missense_Mutation | rs567676273 | c.332N>A | p.Arg111Gln | p.R111Q | Q9H173 | protein_coding | tolerated(0.32) | benign(0) | TCGA-AA-3984-01 | Colorectum | colon adenocarcinoma | Female | <65 | I/II | Unknown | Unknown | SD |
| SIL1 | SNV | Missense_Mutation | novel | c.226T>C | p.Trp76Arg | p.W76R | Q9H173 | protein_coding | deleterious(0) | probably_damaging(1) | TCGA-AD-5900-01 | Colorectum | colon adenocarcinoma | Male | >=65 | I/II | Unknown | Unknown | SD |
| SIL1 | SNV | Missense_Mutation | novel | c.866T>C | p.Val289Ala | p.V289A | Q9H173 | protein_coding | tolerated(0.86) | benign(0.001) | TCGA-AD-A5EJ-01 | Colorectum | colon adenocarcinoma | Female | >=65 | I/II | Unknown | Unknown | SD |
| SIL1 | SNV | Missense_Mutation | novel | c.796G>A | p.Glu266Lys | p.E266K | Q9H173 | protein_coding | deleterious(0) | possibly_damaging(0.775) | TCGA-AG-A002-01 | Colorectum | rectum adenocarcinoma | Male | <65 | I/II | Unknown | Unknown | SD |
| SIL1 | SNV | Missense_Mutation | novel | c.193N>A | p.Glu65Lys | p.E65K | Q9H173 | protein_coding | tolerated(0.06) | benign(0.003) | TCGA-A5-A0G2-01 | Endometrium | uterine corpus endometrioid carcinoma | Female | <65 | III/IV | Unknown | Unknown | SD |
| Page: 1 2 3 4 |
Top |
Related drugs of malignant transformation related genes |
| Identification of chemicals and drugs interact with genes involved in malignant transfromation |
| (DGIdb 4.0) |
| Entrez ID | Symbol | Category | Interaction Types | Drug Claim Name | Drug Name | PMIDs |
| Page: 1 |

Copyright 2023-Present -The University of Texas Health Science Center at Houston |