
|
|||||
|
 | |
| |
| |
| |
| |
| |
|
Gene: SIGIRR |
Gene summary for SIGIRR |
| Gene information | Species | Human | Gene symbol | SIGIRR | Gene ID | 59307 |
| Gene name | single Ig and TIR domain containing | |
| Gene Alias | IL-1R8 | |
| Cytomap | 11p15.5 | |
| Gene Type | protein-coding | GO ID | GO:0001816 | UniProtAcc | Q6IA17 |
Top |
Malignant transformation analysis |
| Identification of the aberrant gene expression in precancerous and cancerous lesions by comparing the gene expression of stem-like cells in diseased tissues with normal stem cells |
| Entrez ID | Symbol | Replicates | Species | Organ | Tissue | Adj P-value | Log2FC | Malignancy |
| 59307 | SIGIRR | LZE4T | Human | Esophagus | ESCC | 1.35e-05 | 2.05e-01 | 0.0811 |
| 59307 | SIGIRR | LZE7T | Human | Esophagus | ESCC | 1.27e-06 | 2.71e-01 | 0.0667 |
| 59307 | SIGIRR | LZE8T | Human | Esophagus | ESCC | 1.04e-03 | 2.40e-01 | 0.067 |
| 59307 | SIGIRR | LZE20T | Human | Esophagus | ESCC | 4.08e-06 | 1.66e-01 | 0.0662 |
| 59307 | SIGIRR | LZE22D1 | Human | Esophagus | HGIN | 3.56e-09 | 2.51e-01 | 0.0595 |
| 59307 | SIGIRR | LZE24T | Human | Esophagus | ESCC | 9.86e-33 | 1.01e+00 | 0.0596 |
| 59307 | SIGIRR | LZE6T | Human | Esophagus | ESCC | 2.17e-16 | 4.64e-01 | 0.0845 |
| 59307 | SIGIRR | P1T-E | Human | Esophagus | ESCC | 7.13e-16 | 7.80e-01 | 0.0875 |
| 59307 | SIGIRR | P2T-E | Human | Esophagus | ESCC | 1.19e-28 | 7.15e-01 | 0.1177 |
| 59307 | SIGIRR | P4T-E | Human | Esophagus | ESCC | 5.86e-24 | 4.88e-01 | 0.1323 |
| 59307 | SIGIRR | P5T-E | Human | Esophagus | ESCC | 1.63e-09 | 1.10e-01 | 0.1327 |
| 59307 | SIGIRR | P8T-E | Human | Esophagus | ESCC | 3.06e-22 | 3.77e-01 | 0.0889 |
| 59307 | SIGIRR | P9T-E | Human | Esophagus | ESCC | 2.22e-21 | 6.20e-01 | 0.1131 |
| 59307 | SIGIRR | P11T-E | Human | Esophagus | ESCC | 3.96e-32 | 1.37e+00 | 0.1426 |
| 59307 | SIGIRR | P12T-E | Human | Esophagus | ESCC | 1.74e-26 | 3.46e-01 | 0.1122 |
| 59307 | SIGIRR | P15T-E | Human | Esophagus | ESCC | 1.14e-43 | 8.53e-01 | 0.1149 |
| 59307 | SIGIRR | P16T-E | Human | Esophagus | ESCC | 2.78e-05 | -2.15e-02 | 0.1153 |
| 59307 | SIGIRR | P17T-E | Human | Esophagus | ESCC | 1.60e-11 | 6.69e-01 | 0.1278 |
| 59307 | SIGIRR | P19T-E | Human | Esophagus | ESCC | 4.74e-08 | 8.05e-01 | 0.1662 |
| 59307 | SIGIRR | P20T-E | Human | Esophagus | ESCC | 2.27e-31 | 7.71e-01 | 0.1124 |
| Page: 1 2 3 4 5 6 |
| Tissue | Expression Dynamics | Abbreviation |
| Esophagus | 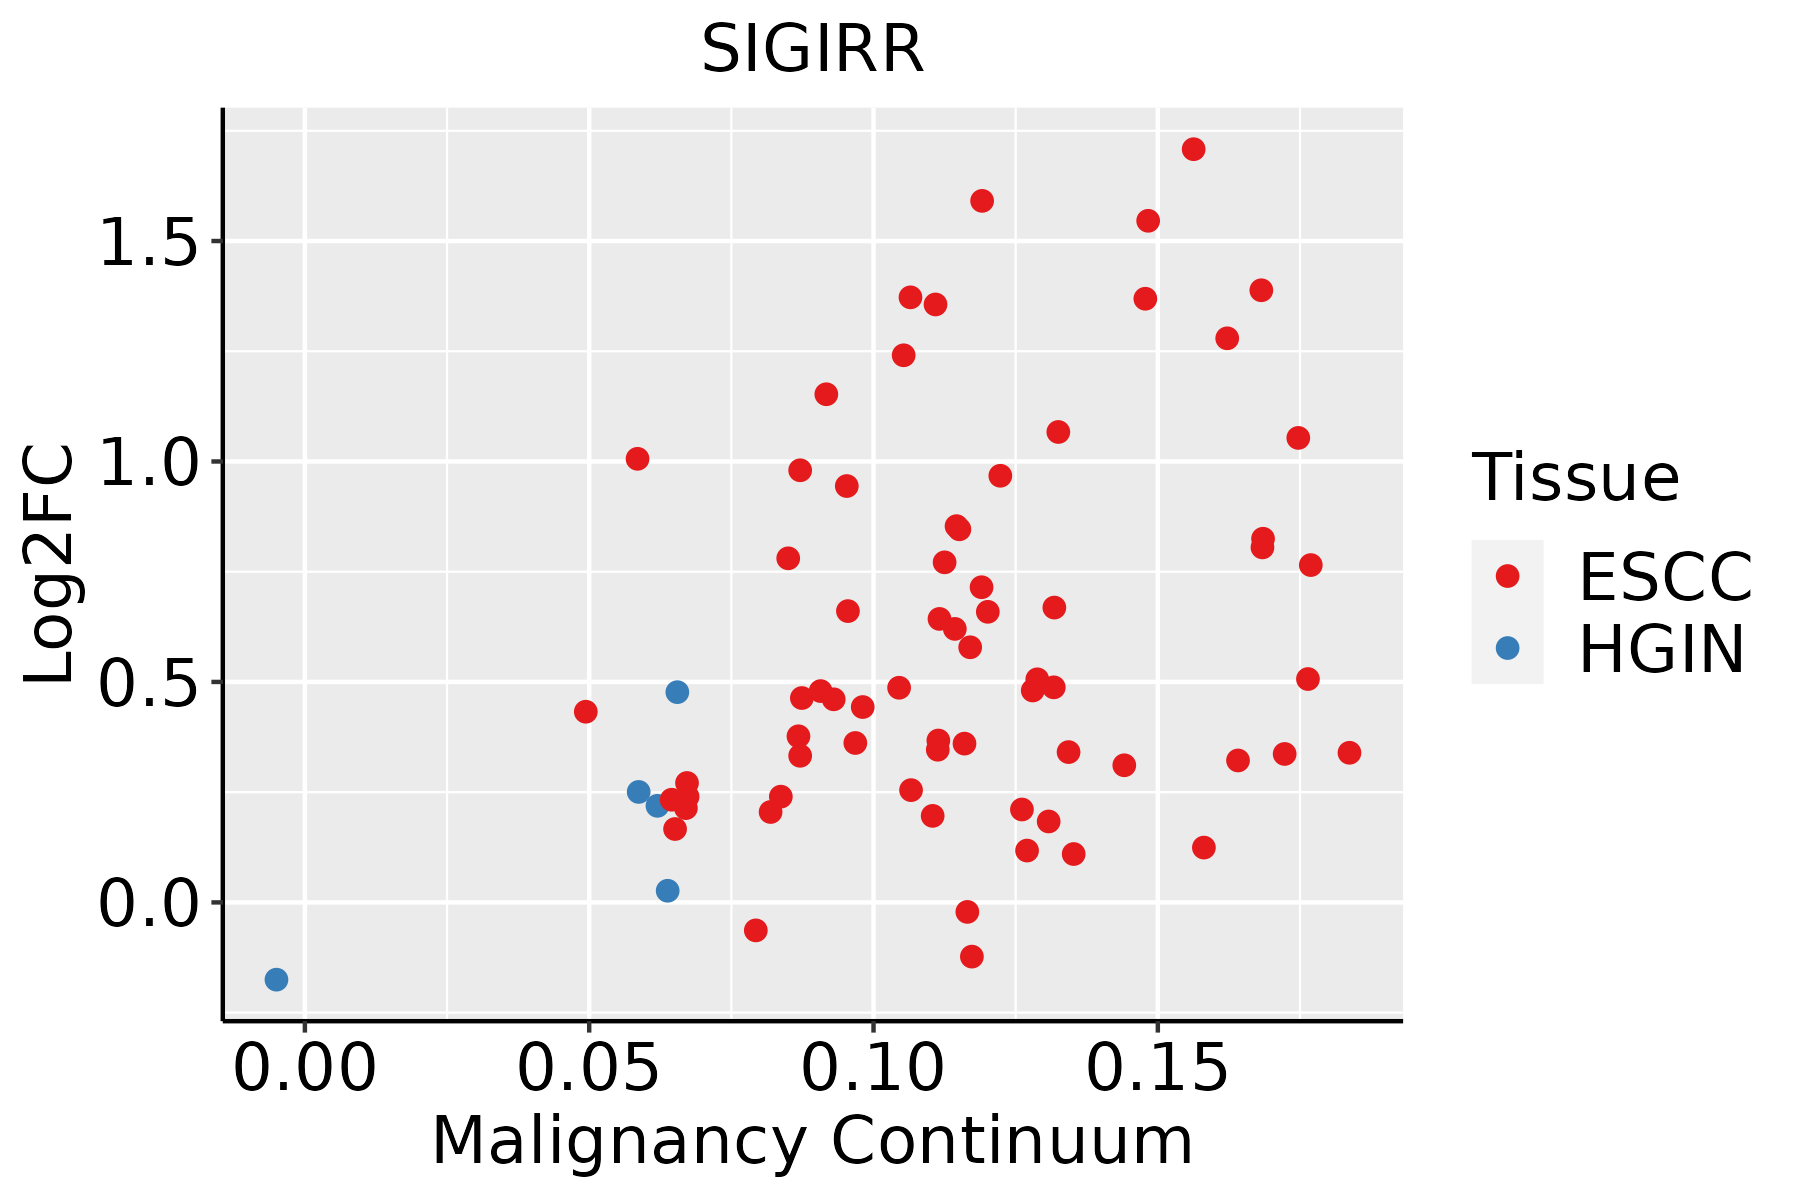 | ESCC: Esophageal squamous cell carcinoma |
| HGIN: High-grade intraepithelial neoplasias | ||
| LGIN: Low-grade intraepithelial neoplasias | ||
| Liver | 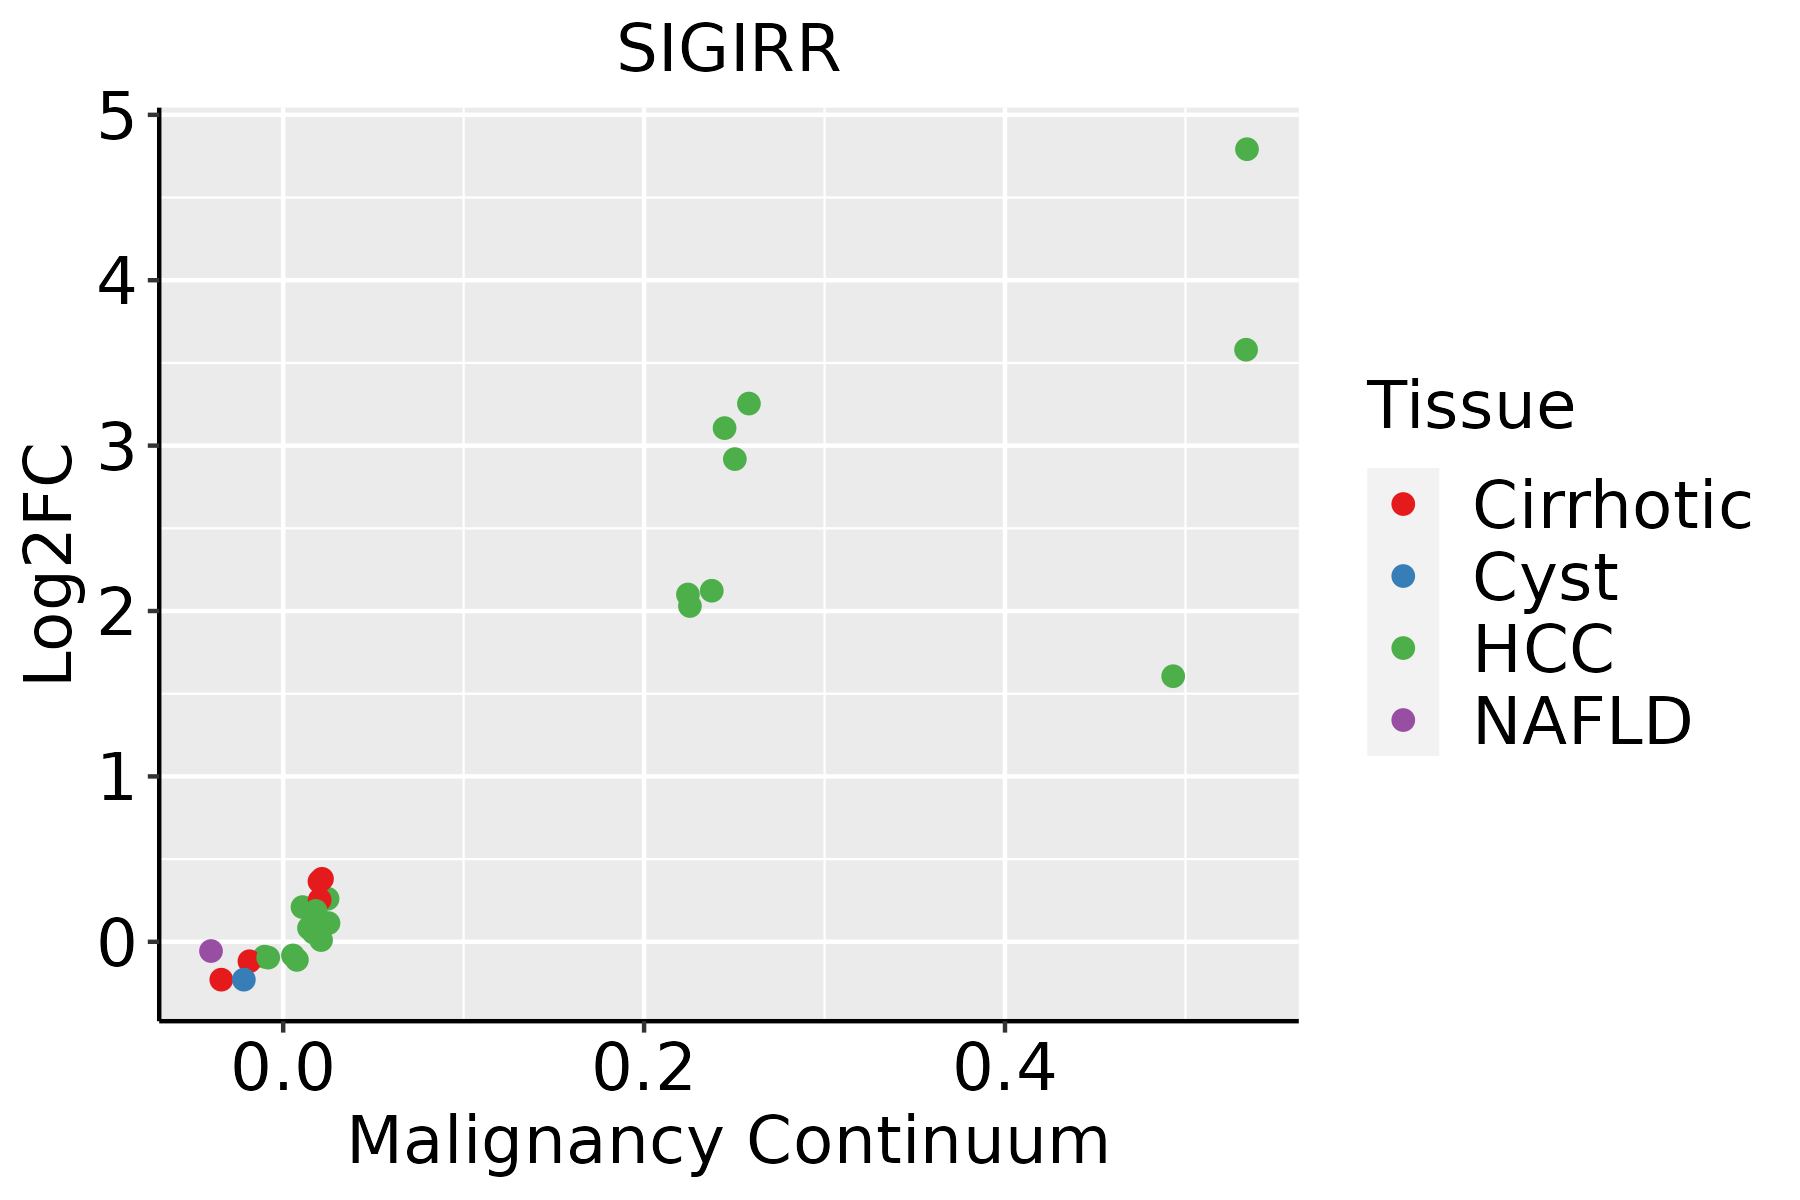 | HCC: Hepatocellular carcinoma |
| NAFLD: Non-alcoholic fatty liver disease | ||
| Oral Cavity | 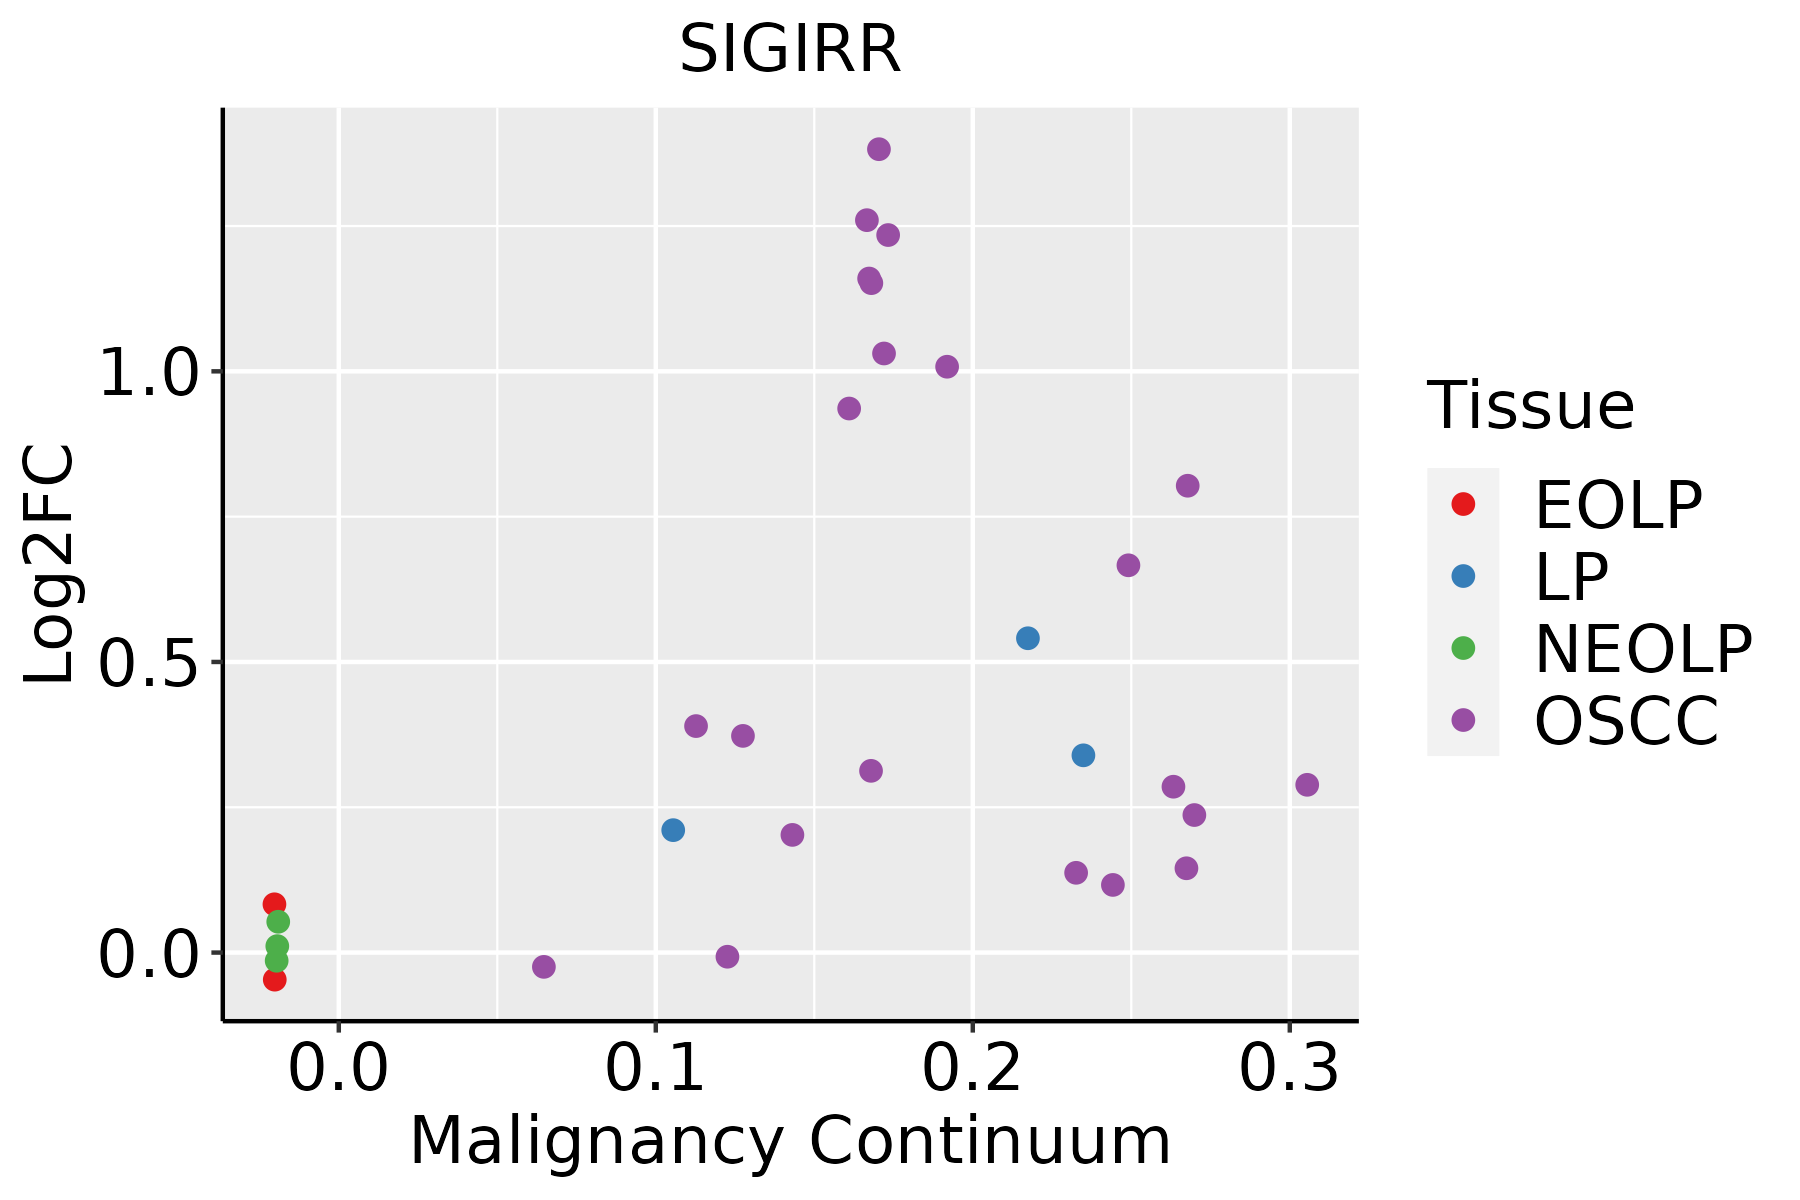 | EOLP: Erosive Oral lichen planus |
| LP: leukoplakia | ||
| NEOLP: Non-erosive oral lichen planus | ||
| OSCC: Oral squamous cell carcinoma | ||
| Thyroid | 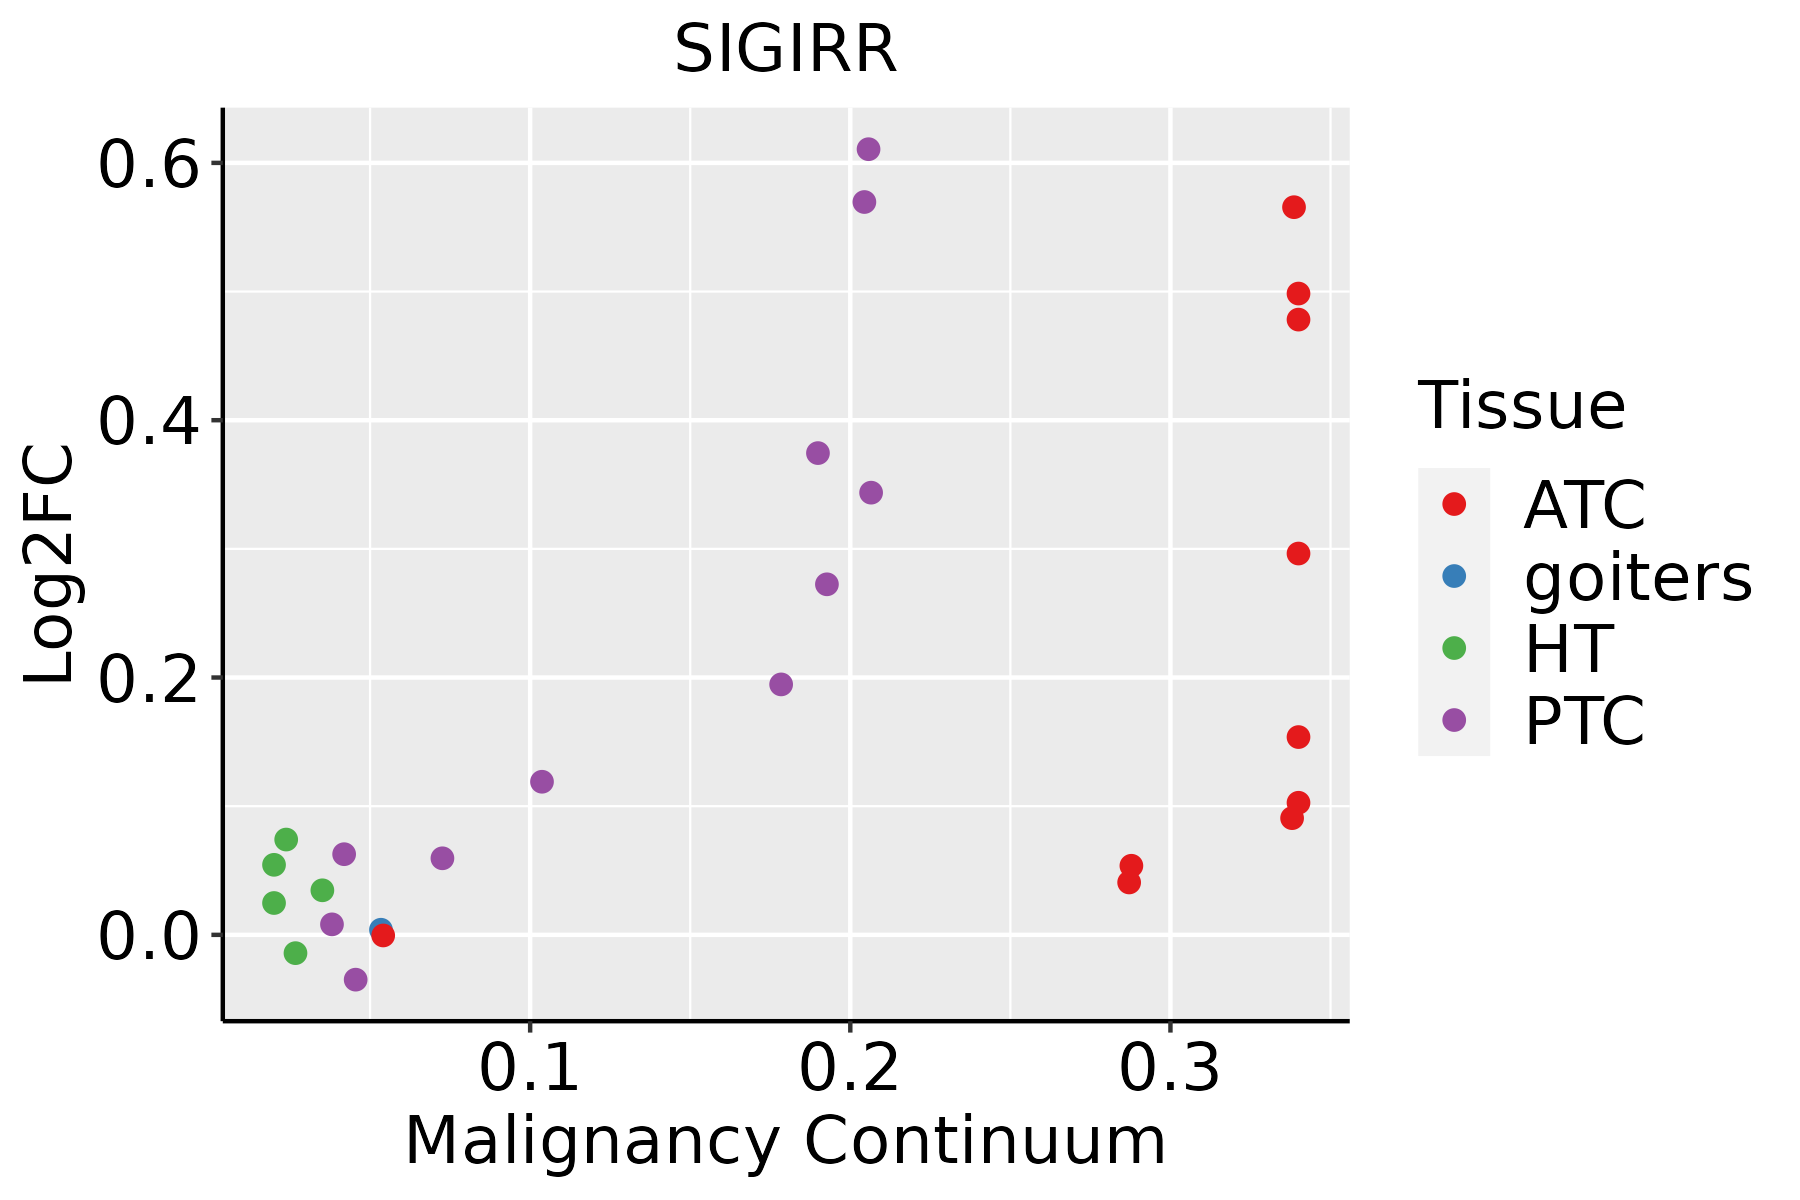 | ATC: Anaplastic thyroid cancer |
| HT: Hashimoto's thyroiditis | ||
| PTC: Papillary thyroid cancer |
| ∗log2FC in expression of this searched gene in stem-like cells from each diseased tissue sample relative to stem-like cells in normal samples in each tissue plotted against the malignancy continuum. Samples are colored based on if they are from different disease stage. |
Top |
Malignant transformation related pathway analysis |
| Find out the enriched GO biological processes and KEGG pathways involved in transition from healthy to precancer to cancer |
| Tissue | Disease Stage | Enriched GO biological Processes |
| Colorectum | AD |  |
| Colorectum | SER |  |
| Colorectum | MSS |  |
| Colorectum | MSI-H |  |
| Colorectum | FAP |  |
| ∗Top 15 enriched GO BP terms are showed in the bar plot of each disease state in each tissue. Each row represents a significant GO biological process which is colored according to the -log10(p.adjust). |
| Page: 1 2 3 4 5 6 7 8 9 |
| GO ID | Tissue | Disease Stage | Description | Gene Ratio | Bg Ratio | pvalue | p.adjust | Count |
| GO:00510902 | Liver | HCC | regulation of DNA-binding transcription factor activity | 220/7958 | 440/18723 | 8.04e-04 | 4.82e-03 | 220 |
| GO:003249611 | Liver | HCC | response to lipopolysaccharide | 174/7958 | 343/18723 | 1.19e-03 | 6.62e-03 | 174 |
| GO:00712166 | Liver | HCC | cellular response to biotic stimulus | 128/7958 | 246/18723 | 1.53e-03 | 8.10e-03 | 128 |
| GO:00712226 | Liver | HCC | cellular response to lipopolysaccharide | 110/7958 | 209/18723 | 1.92e-03 | 9.77e-03 | 110 |
| GO:000223711 | Liver | HCC | response to molecule of bacterial origin | 181/7958 | 363/18723 | 2.58e-03 | 1.24e-02 | 181 |
| GO:00025262 | Liver | HCC | acute inflammatory response | 62/7958 | 112/18723 | 4.06e-03 | 1.77e-02 | 62 |
| GO:0031663 | Liver | HCC | lipopolysaccharide-mediated signaling pathway | 36/7958 | 60/18723 | 4.68e-03 | 2.01e-02 | 36 |
| GO:00712196 | Liver | HCC | cellular response to molecule of bacterial origin | 113/7958 | 221/18723 | 5.73e-03 | 2.38e-02 | 113 |
| GO:00069532 | Liver | HCC | acute-phase response | 30/7958 | 49/18723 | 6.31e-03 | 2.57e-02 | 30 |
| GO:00028317 | Oral cavity | OSCC | regulation of response to biotic stimulus | 177/7305 | 327/18723 | 1.73e-08 | 3.43e-07 | 177 |
| GO:003249617 | Oral cavity | OSCC | response to lipopolysaccharide | 178/7305 | 343/18723 | 7.27e-07 | 1.03e-05 | 178 |
| GO:00510907 | Oral cavity | OSCC | regulation of DNA-binding transcription factor activity | 221/7305 | 440/18723 | 9.06e-07 | 1.23e-05 | 221 |
| GO:00019594 | Oral cavity | OSCC | regulation of cytokine-mediated signaling pathway | 87/7305 | 150/18723 | 1.82e-06 | 2.35e-05 | 87 |
| GO:00607594 | Oral cavity | OSCC | regulation of response to cytokine stimulus | 92/7305 | 162/18723 | 3.25e-06 | 3.90e-05 | 92 |
| GO:00028324 | Oral cavity | OSCC | negative regulation of response to biotic stimulus | 65/7305 | 108/18723 | 6.62e-06 | 7.29e-05 | 65 |
| GO:007121615 | Oral cavity | OSCC | cellular response to biotic stimulus | 129/7305 | 246/18723 | 1.20e-05 | 1.23e-04 | 129 |
| GO:000223717 | Oral cavity | OSCC | response to molecule of bacterial origin | 181/7305 | 363/18723 | 1.48e-05 | 1.49e-04 | 181 |
| GO:007122210 | Oral cavity | OSCC | cellular response to lipopolysaccharide | 110/7305 | 209/18723 | 4.15e-05 | 3.60e-04 | 110 |
| GO:00316632 | Oral cavity | OSCC | lipopolysaccharide-mediated signaling pathway | 38/7305 | 60/18723 | 1.17e-04 | 8.46e-04 | 38 |
| GO:00192214 | Oral cavity | OSCC | cytokine-mediated signaling pathway | 222/7305 | 472/18723 | 2.02e-04 | 1.35e-03 | 222 |
| Page: 1 2 3 |
| Pathway ID | Tissue | Disease Stage | Description | Gene Ratio | Bg Ratio | pvalue | p.adjust | qvalue | Count |
| Page: 1 |
Top |
Cell-cell communication analysis |
| Identification of potential cell-cell interactions between two cell types and their ligand-receptor pairs for different disease states |
| Ligand | Receptor | LRpair | Pathway | Tissue | Disease Stage |
| Page: 1 |
Top |
Single-cell gene regulatory network inference analysis |
| Find out the significant the regulons (TFs) and the target genes of each regulon across cell types for different disease states |
| TF | Cell Type | Tissue | Disease Stage | Target Gene | RSS | Regulon Activity |
| ∗The dot plots of a searched regulon are shown for all cell subpopulations in each disease state of each tissue based on the regulon specific score inferred using pySCENIC and by calculating the average expression. |
| Page: 1 |
Top |
Somatic mutation of malignant transformation related genes |
| Annotation of somatic variants for genes involved in malignant transformation |
| Hugo Symbol | Variant Class | Variant Classification | dbSNP RS | HGVSc | HGVSp | HGVSp Short | SWISSPROT | BIOTYPE | SIFT | PolyPhen | Tumor Sample Barcode | Tissue | Histology | Sex | Age | Stage | Therapy Types | Drugs | Outcome |
| SIGIRR | SNV | Missense_Mutation | c.890N>T | p.Ser297Phe | p.S297F | Q6IA17 | protein_coding | deleterious(0) | probably_damaging(0.998) | TCGA-DR-A0ZM-01 | Cervix | cervical & endocervical cancer | Female | <65 | III/IV | Unspecific | Cisplatin | SD | |
| SIGIRR | SNV | Missense_Mutation | c.300N>G | p.Ile100Met | p.I100M | Q6IA17 | protein_coding | deleterious(0.04) | benign(0.233) | TCGA-DR-A0ZM-01 | Cervix | cervical & endocervical cancer | Female | <65 | III/IV | Unspecific | Cisplatin | SD | |
| SIGIRR | SNV | Missense_Mutation | c.979G>A | p.Asp327Asn | p.D327N | Q6IA17 | protein_coding | deleterious(0) | probably_damaging(0.999) | TCGA-A6-6781-01 | Colorectum | colon adenocarcinoma | Male | <65 | III/IV | Chemotherapy | oxaliplatin | SD | |
| SIGIRR | SNV | Missense_Mutation | c.626A>G | p.Glu209Gly | p.E209G | Q6IA17 | protein_coding | tolerated(0.06) | benign(0.039) | TCGA-D5-6927-01 | Colorectum | colon adenocarcinoma | Male | <65 | I/II | Unknown | Unknown | SD | |
| SIGIRR | SNV | Missense_Mutation | rs147250692 | c.917C>T | p.Ala306Val | p.A306V | Q6IA17 | protein_coding | deleterious(0.05) | possibly_damaging(0.81) | TCGA-F5-6814-01 | Colorectum | rectum adenocarcinoma | Male | <65 | I/II | Unknown | Unknown | SD |
| SIGIRR | SNV | Missense_Mutation | c.193N>A | p.His65Asn | p.H65N | Q6IA17 | protein_coding | tolerated(0.58) | benign(0.001) | TCGA-B5-A11J-01 | Endometrium | uterine corpus endometrioid carcinoma | Female | <65 | I/II | Unknown | Unknown | SD | |
| SIGIRR | SNV | Missense_Mutation | novel | c.1159N>A | p.Val387Ile | p.V387I | Q6IA17 | protein_coding | tolerated(0.51) | benign(0.013) | TCGA-B5-A3FC-01 | Endometrium | uterine corpus endometrioid carcinoma | Female | <65 | I/II | Unknown | Unknown | SD |
| SIGIRR | SNV | Missense_Mutation | novel | c.358N>A | p.Ala120Thr | p.A120T | Q6IA17 | protein_coding | tolerated(0.07) | benign(0.022) | TCGA-B5-A3FC-01 | Endometrium | uterine corpus endometrioid carcinoma | Female | <65 | I/II | Unknown | Unknown | SD |
| SIGIRR | SNV | Missense_Mutation | novel | c.1034N>C | p.Asp345Ala | p.D345A | Q6IA17 | protein_coding | tolerated(0.05) | benign(0.115) | TCGA-BS-A0UV-01 | Endometrium | uterine corpus endometrioid carcinoma | Female | <65 | III/IV | Unknown | Unknown | SD |
| SIGIRR | SNV | Missense_Mutation | c.157N>T | p.Gly53Trp | p.G53W | Q6IA17 | protein_coding | deleterious(0) | probably_damaging(0.994) | TCGA-D1-A160-01 | Endometrium | uterine corpus endometrioid carcinoma | Female | >=65 | I/II | Unknown | Unknown | SD |
| Page: 1 2 |
Top |
Related drugs of malignant transformation related genes |
| Identification of chemicals and drugs interact with genes involved in malignant transfromation |
| (DGIdb 4.0) |
| Entrez ID | Symbol | Category | Interaction Types | Drug Claim Name | Drug Name | PMIDs |
| 59307 | SIGIRR | NA | agonist | 178102770 |
| Page: 1 |

Copyright 2023-Present -The University of Texas Health Science Center at Houston |