
|
|||||
|
 | |
| |
| |
| |
| |
| |
|
Gene: SERPINA3 |
Gene summary for SERPINA3 |
| Gene information | Species | Human | Gene symbol | SERPINA3 | Gene ID | 12 |
| Gene name | serpin family A member 3 | |
| Gene Alias | AACT | |
| Cytomap | 14q32.13 | |
| Gene Type | protein-coding | GO ID | GO:0001894 | UniProtAcc | A0A024R6P0 |
Top |
Malignant transformation analysis |
| Identification of the aberrant gene expression in precancerous and cancerous lesions by comparing the gene expression of stem-like cells in diseased tissues with normal stem cells |
| Entrez ID | Symbol | Replicates | Species | Organ | Tissue | Adj P-value | Log2FC | Malignancy |
| 12 | SERPINA3 | GSM4909304 | Human | Breast | IDC | 2.98e-05 | 1.49e-01 | 0.1636 |
| 12 | SERPINA3 | brca7 | Human | Breast | Precancer | 2.87e-05 | 6.71e-01 | -0.009 |
| 12 | SERPINA3 | brca10 | Human | Breast | Precancer | 2.17e-17 | 5.50e-01 | -0.0029 |
| 12 | SERPINA3 | DCIS2 | Human | Breast | DCIS | 6.96e-12 | 5.10e-02 | 0.0085 |
| 12 | SERPINA3 | AEH-subject1 | Human | Endometrium | AEH | 1.49e-22 | 5.84e-01 | -0.3059 |
| 12 | SERPINA3 | AEH-subject2 | Human | Endometrium | AEH | 1.28e-07 | 2.74e-01 | -0.2525 |
| 12 | SERPINA3 | AEH-subject3 | Human | Endometrium | AEH | 5.79e-15 | 4.23e-01 | -0.2576 |
| 12 | SERPINA3 | AEH-subject4 | Human | Endometrium | AEH | 4.55e-05 | 2.27e-01 | -0.2657 |
| 12 | SERPINA3 | AEH-subject5 | Human | Endometrium | AEH | 3.71e-04 | 1.24e-01 | -0.2953 |
| 12 | SERPINA3 | EEC-subject1 | Human | Endometrium | EEC | 8.53e-06 | 1.57e-01 | -0.2682 |
| 12 | SERPINA3 | EEC-subject2 | Human | Endometrium | EEC | 4.07e-08 | 3.00e-01 | -0.2607 |
| 12 | SERPINA3 | EEC-subject3 | Human | Endometrium | EEC | 1.03e-42 | 1.09e+00 | -0.2525 |
| 12 | SERPINA3 | EEC-subject4 | Human | Endometrium | EEC | 6.95e-19 | 5.14e-01 | -0.2571 |
| 12 | SERPINA3 | LZE8T | Human | Esophagus | ESCC | 1.62e-15 | -1.87e-02 | 0.067 |
| 12 | SERPINA3 | LZE24T | Human | Esophagus | ESCC | 2.55e-02 | -2.30e-01 | 0.0596 |
| 12 | SERPINA3 | LZE22D3 | Human | Esophagus | HGIN | 5.16e-16 | 1.17e+00 | 0.0653 |
| 12 | SERPINA3 | P16T-E | Human | Esophagus | ESCC | 2.80e-07 | 4.28e-01 | 0.1153 |
| 12 | SERPINA3 | P24T-E | Human | Esophagus | ESCC | 1.17e-38 | 2.13e+00 | 0.1287 |
| 12 | SERPINA3 | P26T-E | Human | Esophagus | ESCC | 1.78e-03 | -2.28e-01 | 0.1276 |
| 12 | SERPINA3 | P28T-E | Human | Esophagus | ESCC | 2.71e-02 | -7.09e-02 | 0.1149 |
| Page: 1 2 3 4 5 |
| Tissue | Expression Dynamics | Abbreviation |
| Breast | 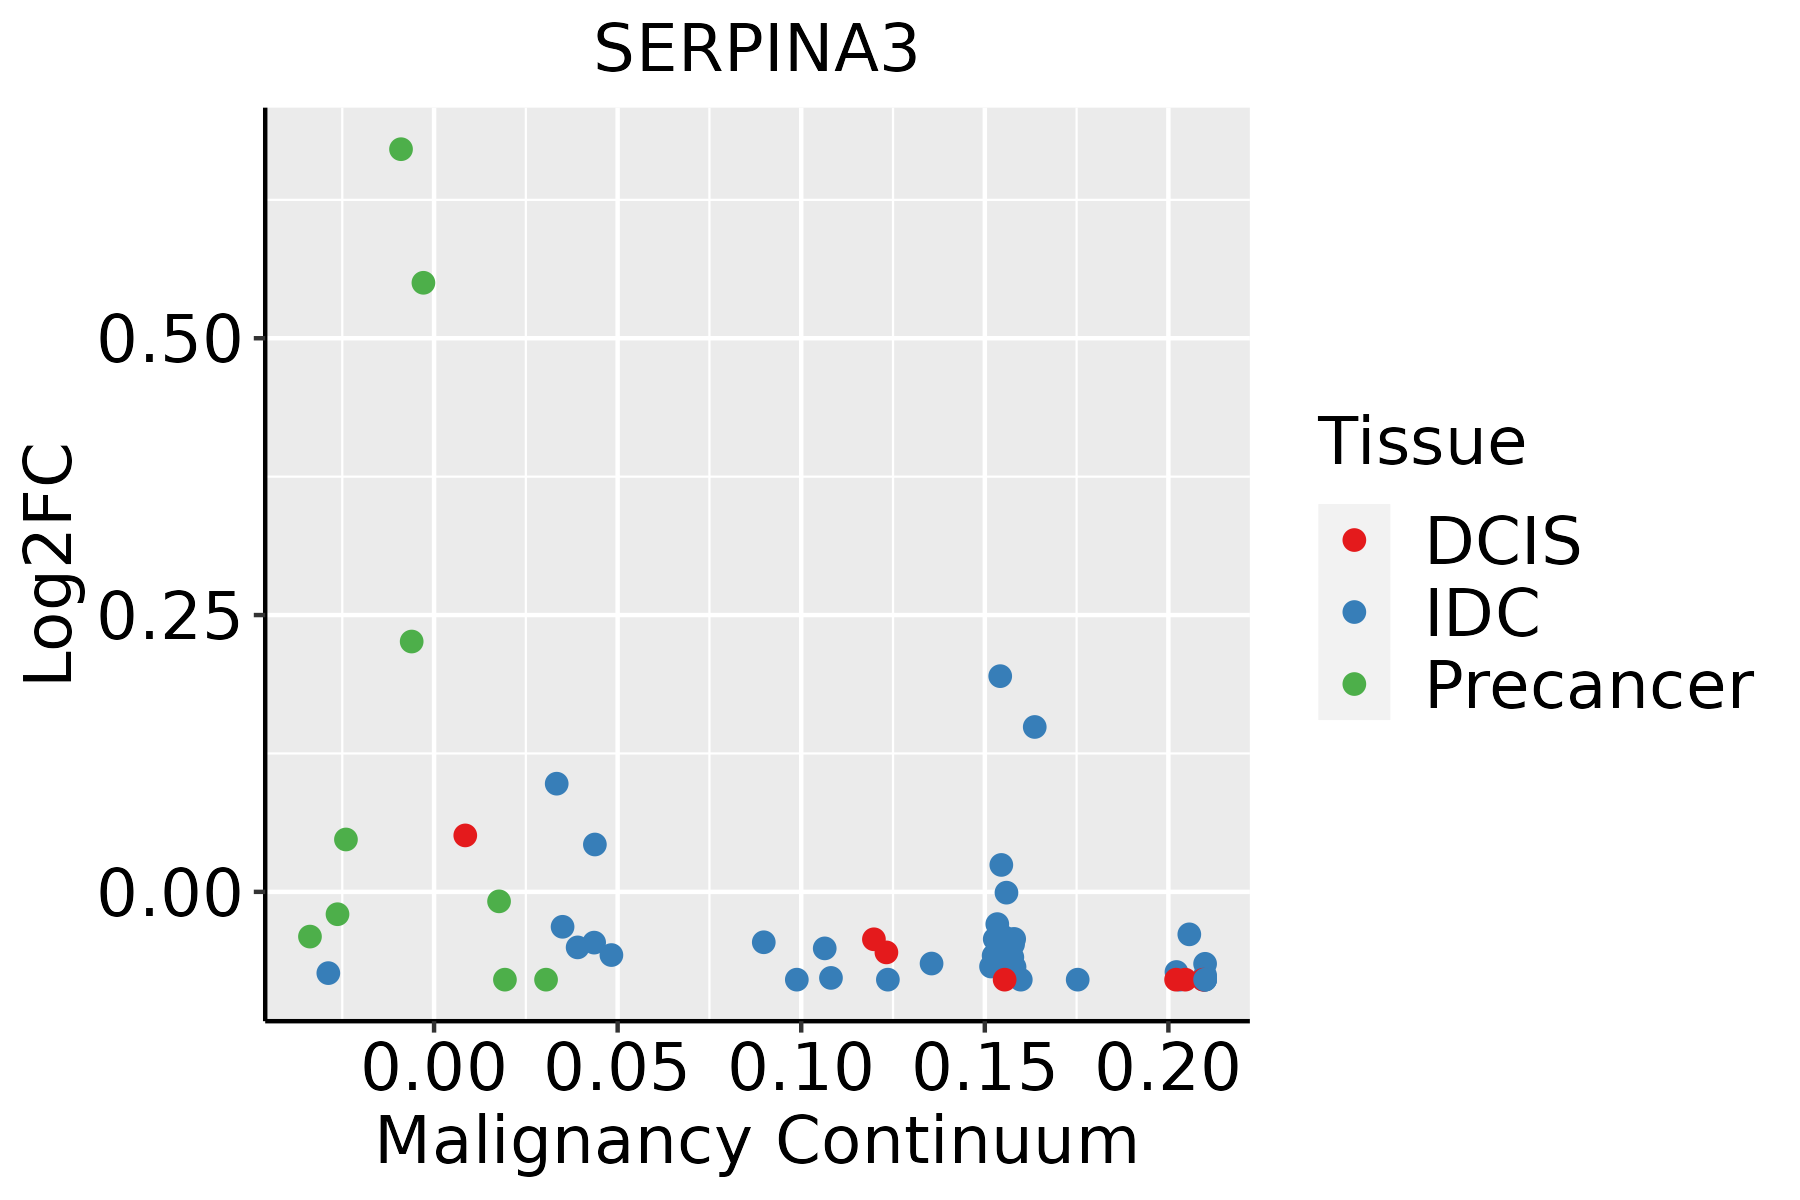 | IDC: Invasive ductal carcinoma |
| DCIS: Ductal carcinoma in situ | ||
| Precancer(BRCA1-mut): Precancerous lesion from BRCA1 mutation carriers | ||
| Endometrium | 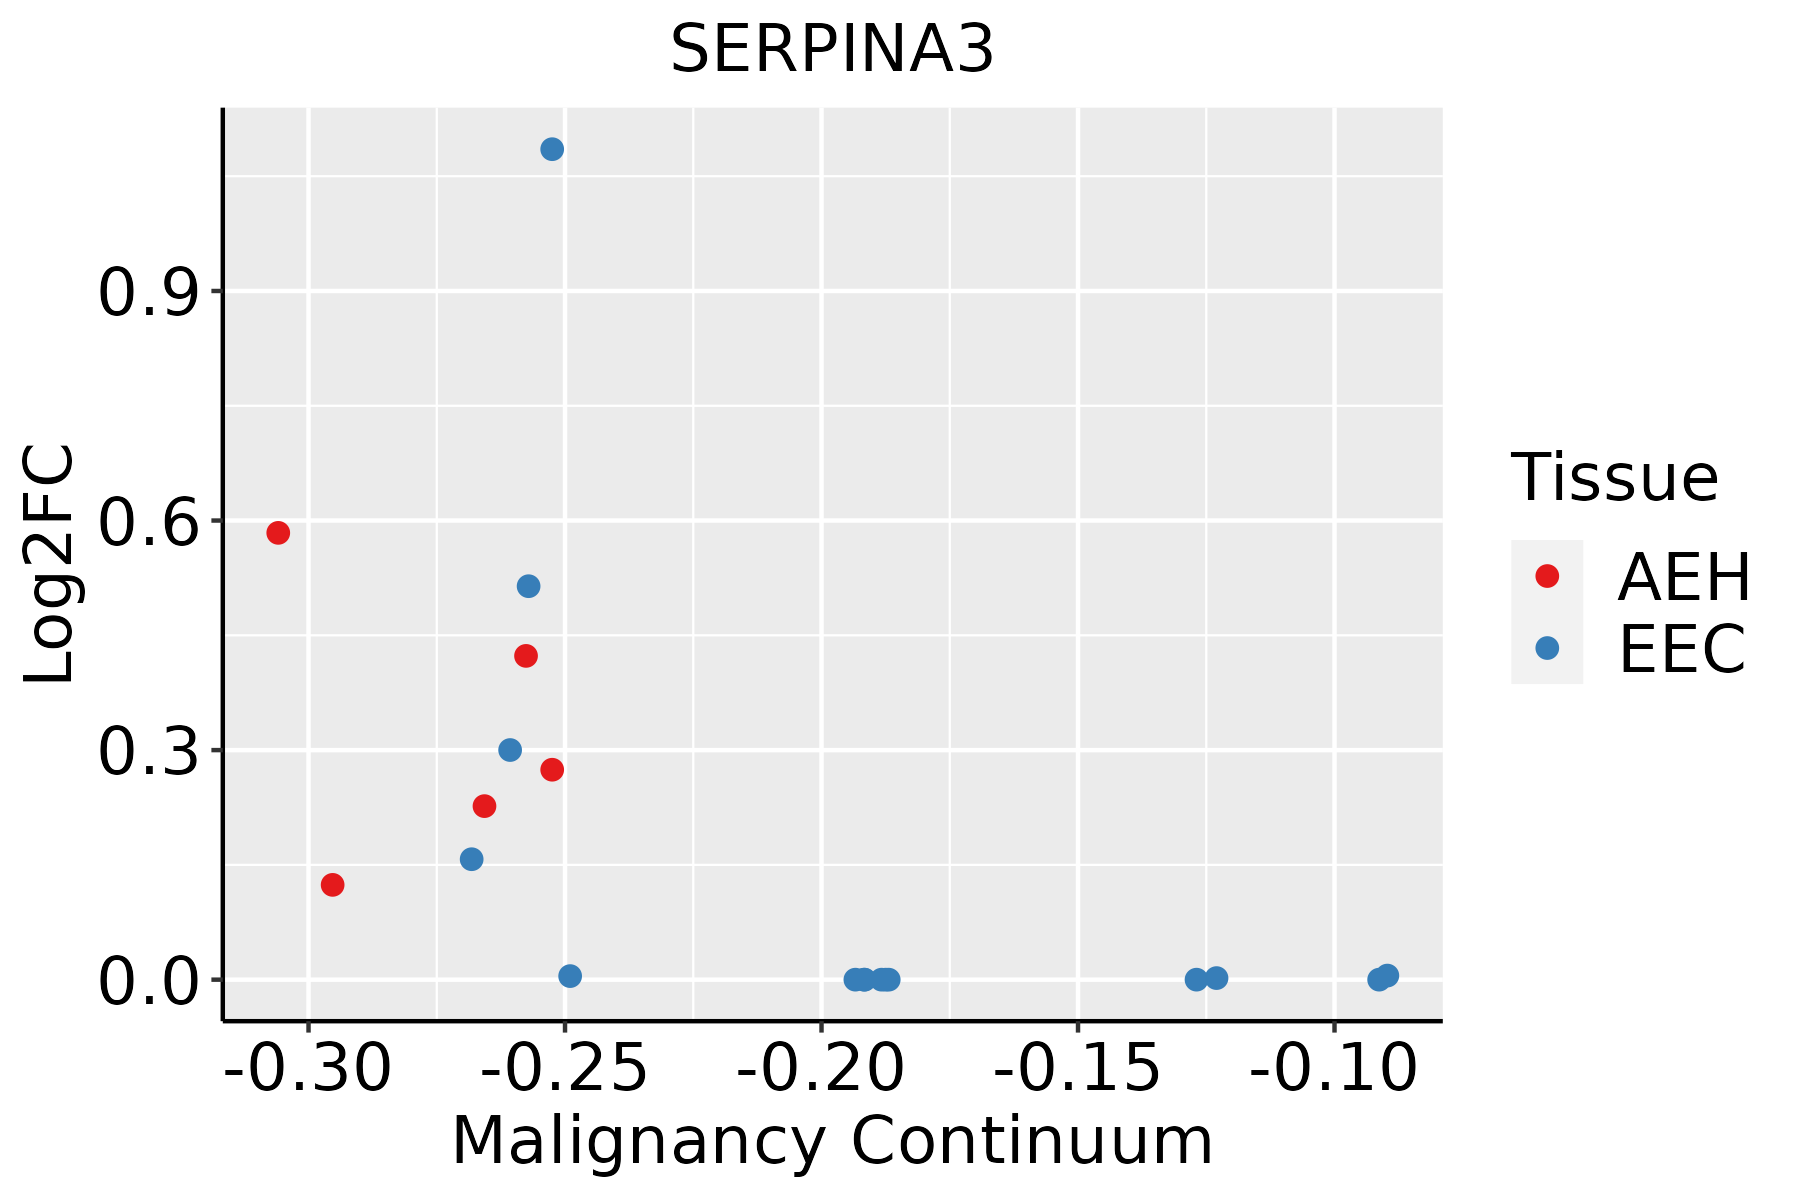 | AEH: Atypical endometrial hyperplasia |
| EEC: Endometrioid Cancer | ||
| Esophagus | 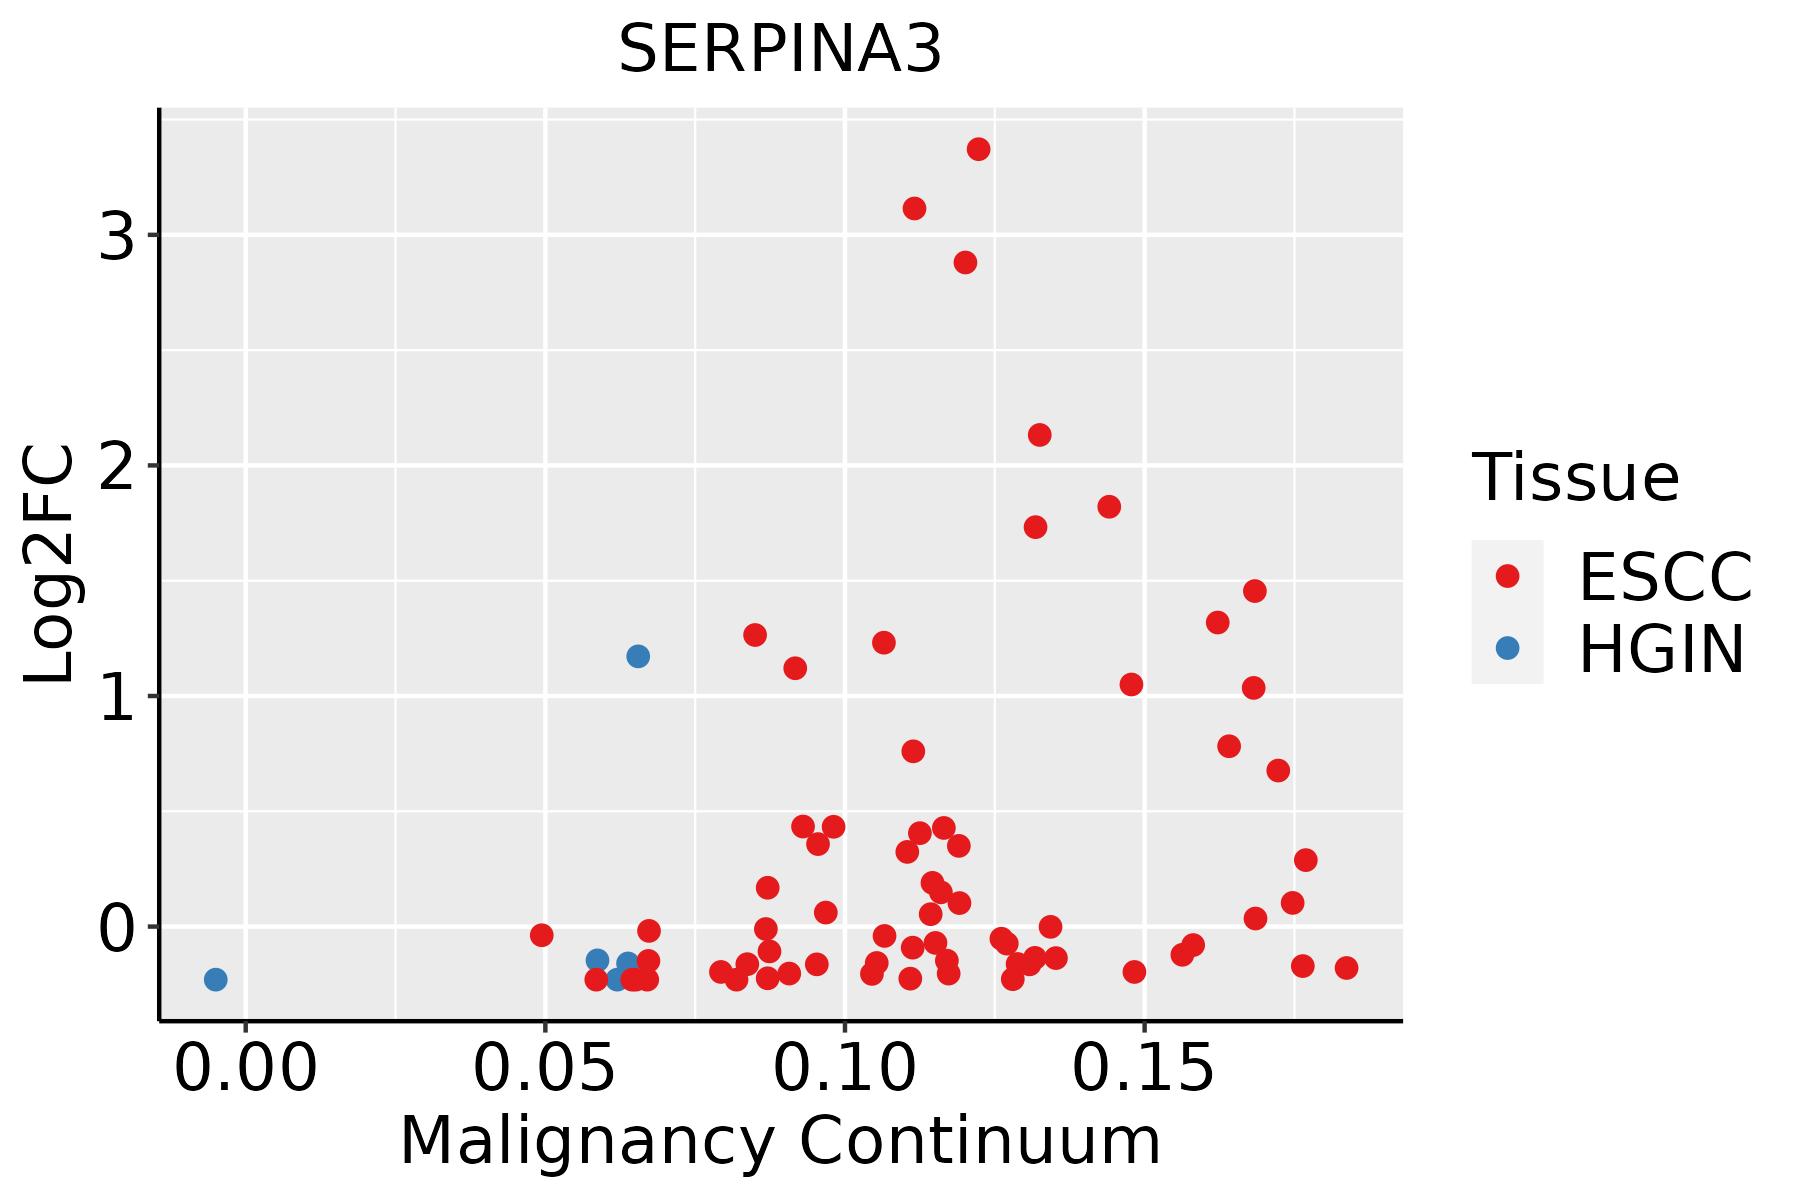 | ESCC: Esophageal squamous cell carcinoma |
| HGIN: High-grade intraepithelial neoplasias | ||
| LGIN: Low-grade intraepithelial neoplasias | ||
| GC | 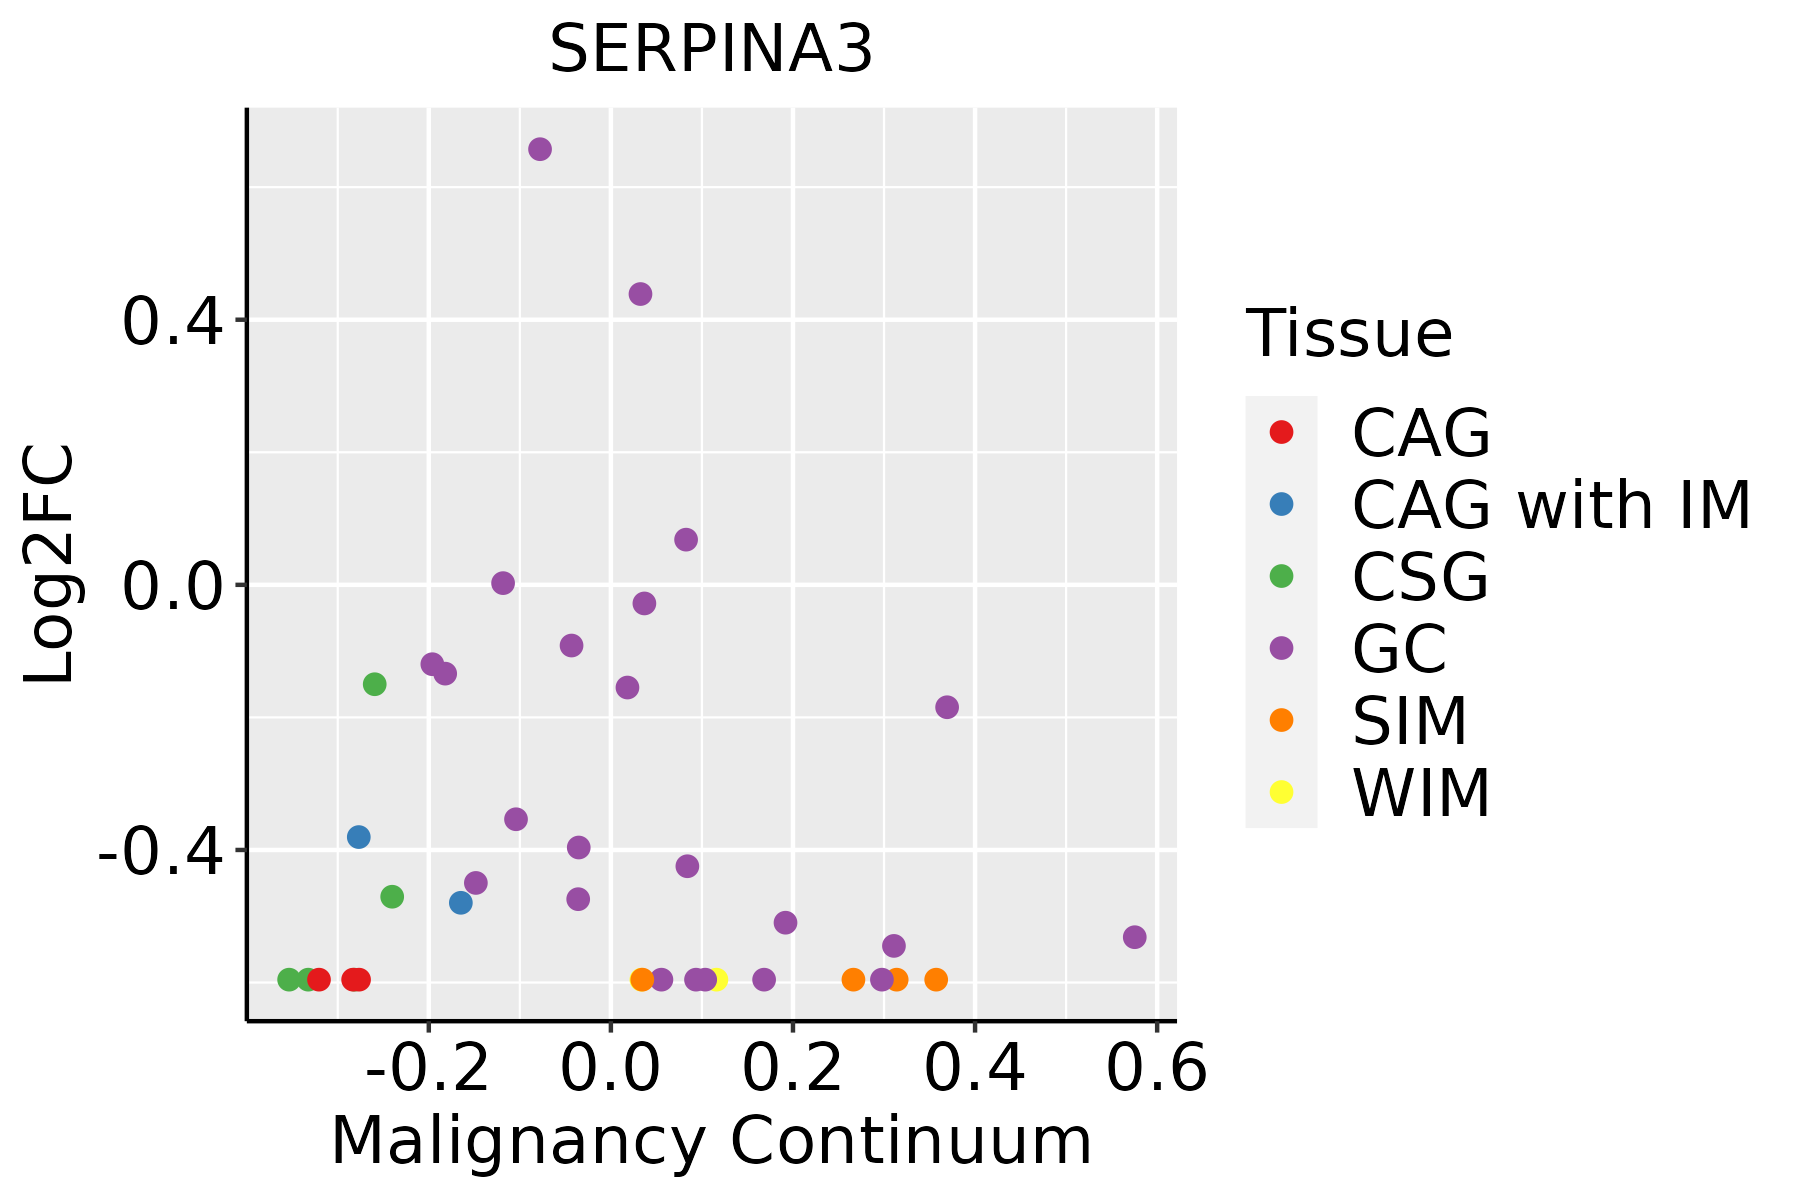 | CAG: Chronic atrophic gastritis |
| CAG with IM: Chronic atrophic gastritis with intestinal metaplasia | ||
| CSG: Chronic superficial gastritis | ||
| GC: Gastric cancer | ||
| SIM: Severe intestinal metaplasia | ||
| WIM: Wild intestinal metaplasia | ||
| Liver | 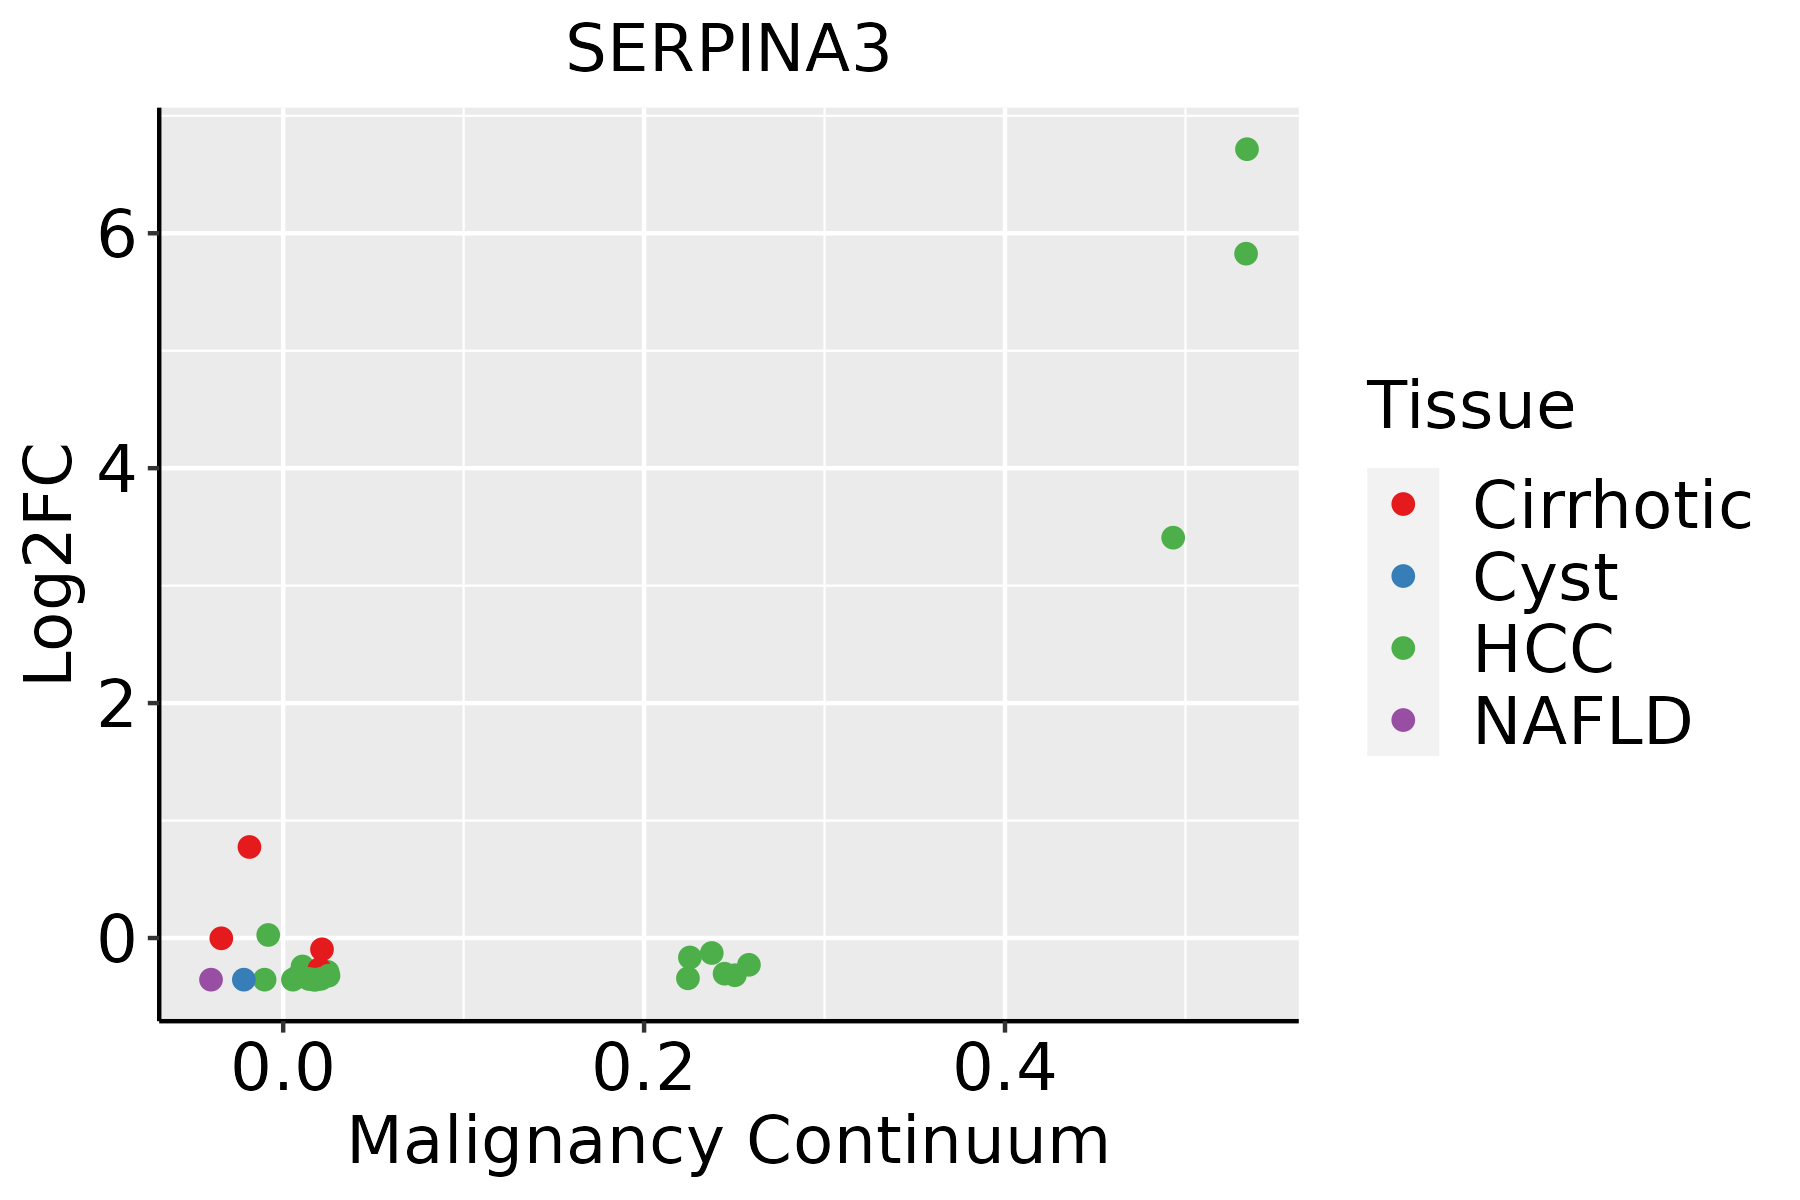 | HCC: Hepatocellular carcinoma |
| NAFLD: Non-alcoholic fatty liver disease |
| ∗log2FC in expression of this searched gene in stem-like cells from each diseased tissue sample relative to stem-like cells in normal samples in each tissue plotted against the malignancy continuum. Samples are colored based on if they are from different disease stage. |
Top |
Malignant transformation related pathway analysis |
| Find out the enriched GO biological processes and KEGG pathways involved in transition from healthy to precancer to cancer |
| Tissue | Disease Stage | Enriched GO biological Processes |
| Colorectum | AD |  |
| Colorectum | SER |  |
| Colorectum | MSS |  |
| Colorectum | MSI-H |  |
| Colorectum | FAP |  |
| ∗Top 15 enriched GO BP terms are showed in the bar plot of each disease state in each tissue. Each row represents a significant GO biological process which is colored according to the -log10(p.adjust). |
| Page: 1 2 3 4 5 6 7 8 9 |
| GO ID | Tissue | Disease Stage | Description | Gene Ratio | Bg Ratio | pvalue | p.adjust | Count |
| GO:004586123 | Breast | DCIS | negative regulation of proteolysis | 63/1390 | 351/18723 | 4.39e-11 | 6.06e-09 | 63 |
| GO:005134623 | Breast | DCIS | negative regulation of hydrolase activity | 64/1390 | 379/18723 | 4.32e-10 | 4.80e-08 | 64 |
| GO:001046622 | Breast | DCIS | negative regulation of peptidase activity | 49/1390 | 262/18723 | 1.54e-09 | 1.43e-07 | 49 |
| GO:001095122 | Breast | DCIS | negative regulation of endopeptidase activity | 47/1390 | 252/18723 | 3.63e-09 | 3.11e-07 | 47 |
| GO:001921621 | Breast | DCIS | regulation of lipid metabolic process | 43/1390 | 331/18723 | 2.37e-04 | 3.71e-03 | 43 |
| GO:000189423 | Breast | DCIS | tissue homeostasis | 33/1390 | 268/18723 | 2.88e-03 | 2.48e-02 | 33 |
| GO:005254716 | Endometrium | AEH | regulation of peptidase activity | 85/2100 | 461/18723 | 2.47e-06 | 7.11e-05 | 85 |
| GO:005254816 | Endometrium | AEH | regulation of endopeptidase activity | 76/2100 | 432/18723 | 4.42e-05 | 7.43e-04 | 76 |
| GO:004586116 | Endometrium | AEH | negative regulation of proteolysis | 63/2100 | 351/18723 | 1.07e-04 | 1.53e-03 | 63 |
| GO:000189410 | Endometrium | AEH | tissue homeostasis | 50/2100 | 268/18723 | 2.04e-04 | 2.54e-03 | 50 |
| GO:005134610 | Endometrium | AEH | negative regulation of hydrolase activity | 65/2100 | 379/18723 | 3.18e-04 | 3.57e-03 | 65 |
| GO:00602499 | Endometrium | AEH | anatomical structure homeostasis | 55/2100 | 314/18723 | 5.27e-04 | 5.32e-03 | 55 |
| GO:00192165 | Endometrium | AEH | regulation of lipid metabolic process | 53/2100 | 331/18723 | 4.86e-03 | 3.07e-02 | 53 |
| GO:001046610 | Endometrium | AEH | negative regulation of peptidase activity | 43/2100 | 262/18723 | 6.78e-03 | 3.95e-02 | 43 |
| GO:005254717 | Endometrium | EEC | regulation of peptidase activity | 91/2168 | 461/18723 | 2.00e-07 | 8.93e-06 | 91 |
| GO:004586117 | Endometrium | EEC | negative regulation of proteolysis | 72/2168 | 351/18723 | 8.46e-07 | 2.98e-05 | 72 |
| GO:005254817 | Endometrium | EEC | regulation of endopeptidase activity | 82/2168 | 432/18723 | 3.96e-06 | 1.04e-04 | 82 |
| GO:005134615 | Endometrium | EEC | negative regulation of hydrolase activity | 72/2168 | 379/18723 | 1.46e-05 | 2.87e-04 | 72 |
| GO:000189415 | Endometrium | EEC | tissue homeostasis | 51/2168 | 268/18723 | 2.34e-04 | 2.75e-03 | 51 |
| GO:001046615 | Endometrium | EEC | negative regulation of peptidase activity | 49/2168 | 262/18723 | 4.64e-04 | 4.79e-03 | 49 |
| Page: 1 2 3 4 5 6 7 8 |
| Pathway ID | Tissue | Disease Stage | Description | Gene Ratio | Bg Ratio | pvalue | p.adjust | qvalue | Count |
| Page: 1 |
Top |
Cell-cell communication analysis |
| Identification of potential cell-cell interactions between two cell types and their ligand-receptor pairs for different disease states |
| Ligand | Receptor | LRpair | Pathway | Tissue | Disease Stage |
| Page: 1 |
Top |
Single-cell gene regulatory network inference analysis |
| Find out the significant the regulons (TFs) and the target genes of each regulon across cell types for different disease states |
| TF | Cell Type | Tissue | Disease Stage | Target Gene | RSS | Regulon Activity |
| ∗The dot plots of a searched regulon are shown for all cell subpopulations in each disease state of each tissue based on the regulon specific score inferred using pySCENIC and by calculating the average expression. |
| Page: 1 |
Top |
Somatic mutation of malignant transformation related genes |
| Annotation of somatic variants for genes involved in malignant transformation |
| Hugo Symbol | Variant Class | Variant Classification | dbSNP RS | HGVSc | HGVSp | HGVSp Short | SWISSPROT | BIOTYPE | SIFT | PolyPhen | Tumor Sample Barcode | Tissue | Histology | Sex | Age | Stage | Therapy Types | Drugs | Outcome |
| SERPINA3 | SNV | Missense_Mutation | c.869T>A | p.Met290Lys | p.M290K | P01011 | protein_coding | tolerated(0.47) | benign(0) | TCGA-A8-A07R-01 | Breast | breast invasive carcinoma | Female | >=65 | III/IV | Ancillary | zoledronic | SD | |
| SERPINA3 | SNV | Missense_Mutation | rs536399107 | c.764N>A | p.Arg255Gln | p.R255Q | P01011 | protein_coding | deleterious(0.02) | benign(0.14) | TCGA-PL-A8LX-01 | Breast | breast invasive carcinoma | Female | <65 | III/IV | Unknown | Unknown | SD |
| SERPINA3 | SNV | Missense_Mutation | c.474N>C | p.Lys158Asn | p.K158N | P01011 | protein_coding | deleterious(0.01) | possibly_damaging(0.874) | TCGA-C5-A1BQ-01 | Cervix | cervical & endocervical cancer | Female | >=65 | III/IV | Chemotherapy | cisplatin | CR | |
| SERPINA3 | SNV | Missense_Mutation | c.474N>C | p.Lys158Asn | p.K158N | P01011 | protein_coding | deleterious(0.01) | possibly_damaging(0.874) | TCGA-C5-A3HL-01 | Cervix | cervical & endocervical cancer | Female | >=65 | I/II | Unknown | Unknown | SD | |
| SERPINA3 | SNV | Missense_Mutation | c.332N>T | p.Ser111Phe | p.S111F | P01011 | protein_coding | deleterious(0) | possibly_damaging(0.881) | TCGA-EK-A2IP-01 | Cervix | cervical & endocervical cancer | Female | <65 | I/II | Unknown | Unknown | SD | |
| SERPINA3 | SNV | Missense_Mutation | c.910G>A | p.Glu304Lys | p.E304K | P01011 | protein_coding | tolerated(0.9) | benign(0) | TCGA-FU-A770-01 | Cervix | cervical & endocervical cancer | Female | <65 | III/IV | Unknown | Unknown | SD | |
| SERPINA3 | SNV | Missense_Mutation | novel | c.1242N>C | p.Met414Ile | p.M414I | P01011 | protein_coding | tolerated(0.32) | benign(0.001) | TCGA-ZJ-AAXU-01 | Cervix | cervical & endocervical cancer | Female | <65 | I/II | Unknown | Unknown | SD |
| SERPINA3 | SNV | Missense_Mutation | c.868N>C | p.Met290Leu | p.M290L | P01011 | protein_coding | deleterious(0.04) | benign(0.003) | TCGA-A6-3808-01 | Colorectum | colon adenocarcinoma | Male | >=65 | I/II | Unknown | Unknown | SD | |
| SERPINA3 | SNV | Missense_Mutation | c.869N>A | p.Met290Lys | p.M290K | P01011 | protein_coding | tolerated(0.47) | benign(0) | TCGA-A6-3808-01 | Colorectum | colon adenocarcinoma | Male | >=65 | I/II | Unknown | Unknown | SD | |
| SERPINA3 | SNV | Missense_Mutation | rs770816070 | c.169N>A | p.Ala57Thr | p.A57T | P01011 | protein_coding | tolerated(0.08) | probably_damaging(0.944) | TCGA-A6-6781-01 | Colorectum | colon adenocarcinoma | Male | <65 | III/IV | Chemotherapy | oxaliplatin | SD |
| Page: 1 2 3 4 5 6 7 |
Top |
Related drugs of malignant transformation related genes |
| Identification of chemicals and drugs interact with genes involved in malignant transfromation |
| (DGIdb 4.0) |
| Entrez ID | Symbol | Category | Interaction Types | Drug Claim Name | Drug Name | PMIDs |
| 12 | SERPINA3 | PROTEASE INHIBITOR, DRUGGABLE GENOME | antineoplastic agents | 21487324 |
| Page: 1 |

Copyright 2023-Present -The University of Texas Health Science Center at Houston |