Schematic overview of the cellular and molecular mechanisms involved in the cancer progression, including the proposed cellular and molecular mechanisms in cancer cells trajectory. AT1: alveolar type 1 cells; AT2: alveolar type 2 cells; AAH: atypical adenomatous hyperplasia; AIS: adenocarcinoma in situ; MIA: minimally invasive adenocarcinoma; IA: invasive adenocarcinoma; EMT: epithelial-mesenchymal transition

Home

Download

Statistics

Help

Contact

Center for Computational Systems Medicine
leaf

Gene summary

leaf

Malignant transformation analysis

leaf

Malignant transformation related pathway analysis

leaf

Cell-cell communication analysis

leaf

Single-cell gene regulatory network inference analysis

leaf

Somatic mutation of malignant transformation related genes

leaf

Related drugs of malignant transformation related genes

Gene: SERF2

Gene summary for SERF2

check button Gene summary.

Gene informationSpeciesHuman
Gene symbol

SERF2

Gene ID

10169

Gene namesmall EDRK-rich factor 2
Gene Alias4F5REL
Cytomap15q15.3
Gene Typeprotein-coding
GO ID

GO:0008150

UniProtAcc

P84101


Top

Malignant transformation analysis

check button Identification of the aberrant gene expression in precancerous and cancerous lesions by comparing the gene expression of stem-like cells in diseased tissues with normal stem cells
check button Malignant transformation involving gene list.
Entrez IDSymbolReplicatesSpeciesOrganTissueAdj P-valueLog2FCMalignancy
10169SERF2GSM4909277HumanBreastPrecancer1.07e-02-6.04e-010.0177
10169SERF2GSM4909280HumanBreastPrecancer2.13e-03-4.73e-010.0305
10169SERF2GSM4909281HumanBreastIDC5.87e-14-2.33e-010.21
10169SERF2GSM4909282HumanBreastIDC3.77e-473.29e-01-0.0288
10169SERF2GSM4909286HumanBreastIDC2.90e-47-3.57e-010.1081
10169SERF2GSM4909289HumanBreastIDC2.25e-032.49e-010.1064
10169SERF2GSM4909290HumanBreastIDC2.32e-824.89e-010.2096
10169SERF2GSM4909291HumanBreastIDC2.11e-072.11e-010.1753
10169SERF2GSM4909294HumanBreastIDC7.52e-322.37e-010.2022
10169SERF2GSM4909296HumanBreastIDC1.41e-353.02e-010.1524
10169SERF2GSM4909297HumanBreastIDC1.21e-05-1.23e-010.1517
10169SERF2GSM4909301HumanBreastIDC5.22e-874.39e-010.1577
10169SERF2GSM4909302HumanBreastIDC2.79e-121.39e-010.1545
10169SERF2GSM4909304HumanBreastIDC1.57e-553.69e-010.1636
10169SERF2GSM4909305HumanBreastIDC8.26e-04-1.30e-010.0436
10169SERF2GSM4909307HumanBreastIDC5.87e-111.66e-010.1569
10169SERF2GSM4909308HumanBreastIDC2.26e-162.16e-010.158
10169SERF2GSM4909309HumanBreastIDC1.75e-041.21e-010.0483
10169SERF2GSM4909311HumanBreastIDC1.20e-23-1.18e-010.1534
10169SERF2GSM4909313HumanBreastIDC1.36e-061.48e-010.0391
Page: 1 2 3 4 5 6 7 8 9 10 11 12 13 14 15 16 17 18 

check button Transcriptomic changes along malignancy continuum.
TissueExpression DynamicsAbbreviation
BreastThe image shows the transcriptomic changes along malignancy continuum.log2FC in expression of this searched gene in stem-like cells from each diseased tissue sample relative to stem-like cells in normal samples in each tissue plotted against the malignancy continuum. Samples are colored based on if they are from different disease stage.IDC: Invasive ductal carcinoma
DCIS: Ductal carcinoma in situ
Precancer(BRCA1-mut): Precancerous lesion from BRCA1 mutation carriers
CervixThe image shows the transcriptomic changes along malignancy continuum.log2FC in expression of this searched gene in stem-like cells from each diseased tissue sample relative to stem-like cells in normal samples in each tissue plotted against the malignancy continuum. Samples are colored based on if they are from different disease stage.CC: Cervix cancer
HSIL_HPV: HPV-infected high-grade squamous intraepithelial lesions
N_HPV: HPV-infected normal cervix
Colorectum (GSE201348)The image shows the transcriptomic changes along malignancy continuum.log2FC in expression of this searched gene in stem-like cells from each diseased tissue sample relative to stem-like cells in normal samples in each tissue plotted against the malignancy continuum. Samples are colored based on if they are from different disease stage.FAP: Familial adenomatous polyposis
CRC: Colorectal cancer
Colorectum (HTA11)The image shows the transcriptomic changes along malignancy continuum.log2FC in expression of this searched gene in stem-like cells from each diseased tissue sample relative to stem-like cells in normal samples in each tissue plotted against the malignancy continuum. Samples are colored based on if they are from different disease stage.AD: Adenomas
SER: Sessile serrated lesions
MSI-H: Microsatellite-high colorectal cancer
MSS: Microsatellite stable colorectal cancer
EndometriumThe image shows the transcriptomic changes along malignancy continuum.log2FC in expression of this searched gene in stem-like cells from each diseased tissue sample relative to stem-like cells in normal samples in each tissue plotted against the malignancy continuum. Samples are colored based on if they are from different disease stage.
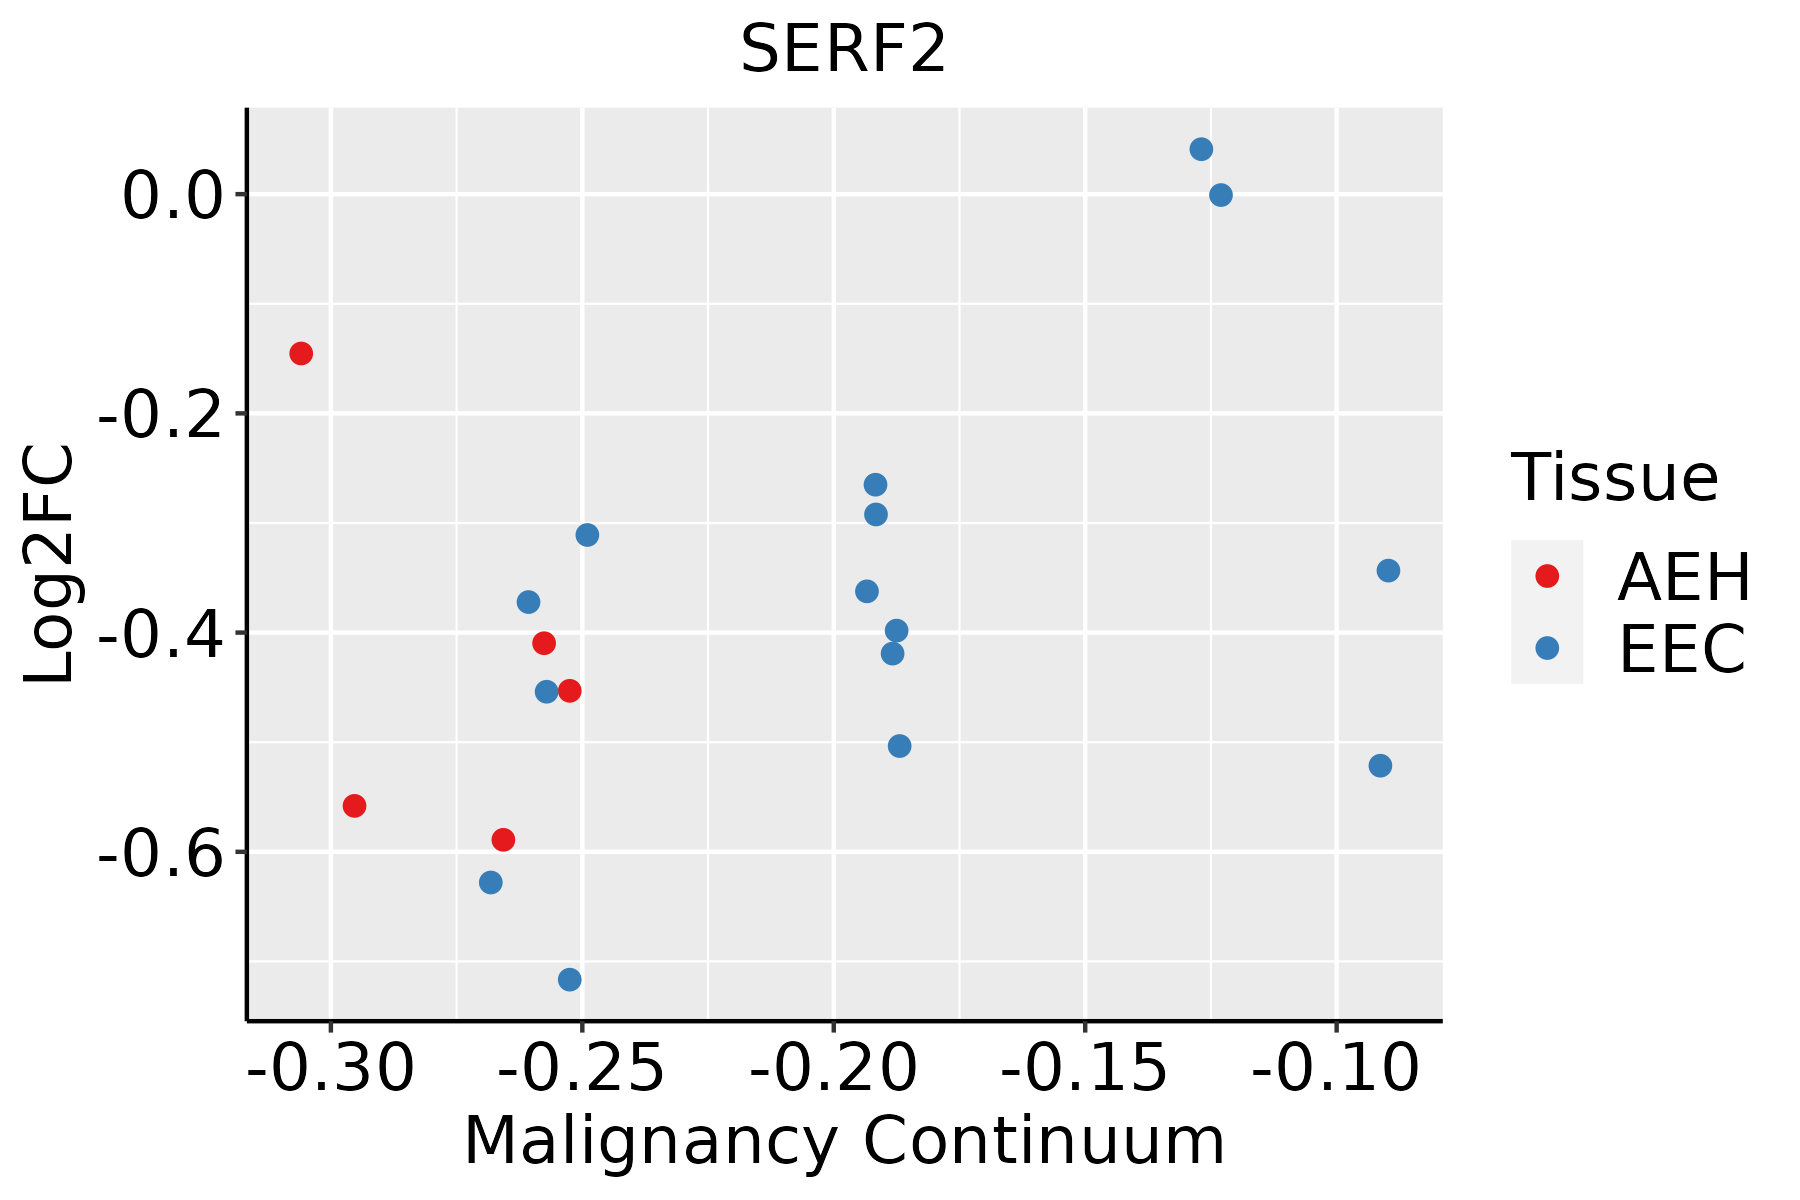
AEH: Atypical endometrial hyperplasia
EEC: Endometrioid Cancer
EsophagusThe image shows the transcriptomic changes along malignancy continuum.log2FC in expression of this searched gene in stem-like cells from each diseased tissue sample relative to stem-like cells in normal samples in each tissue plotted against the malignancy continuum. Samples are colored based on if they are from different disease stage.
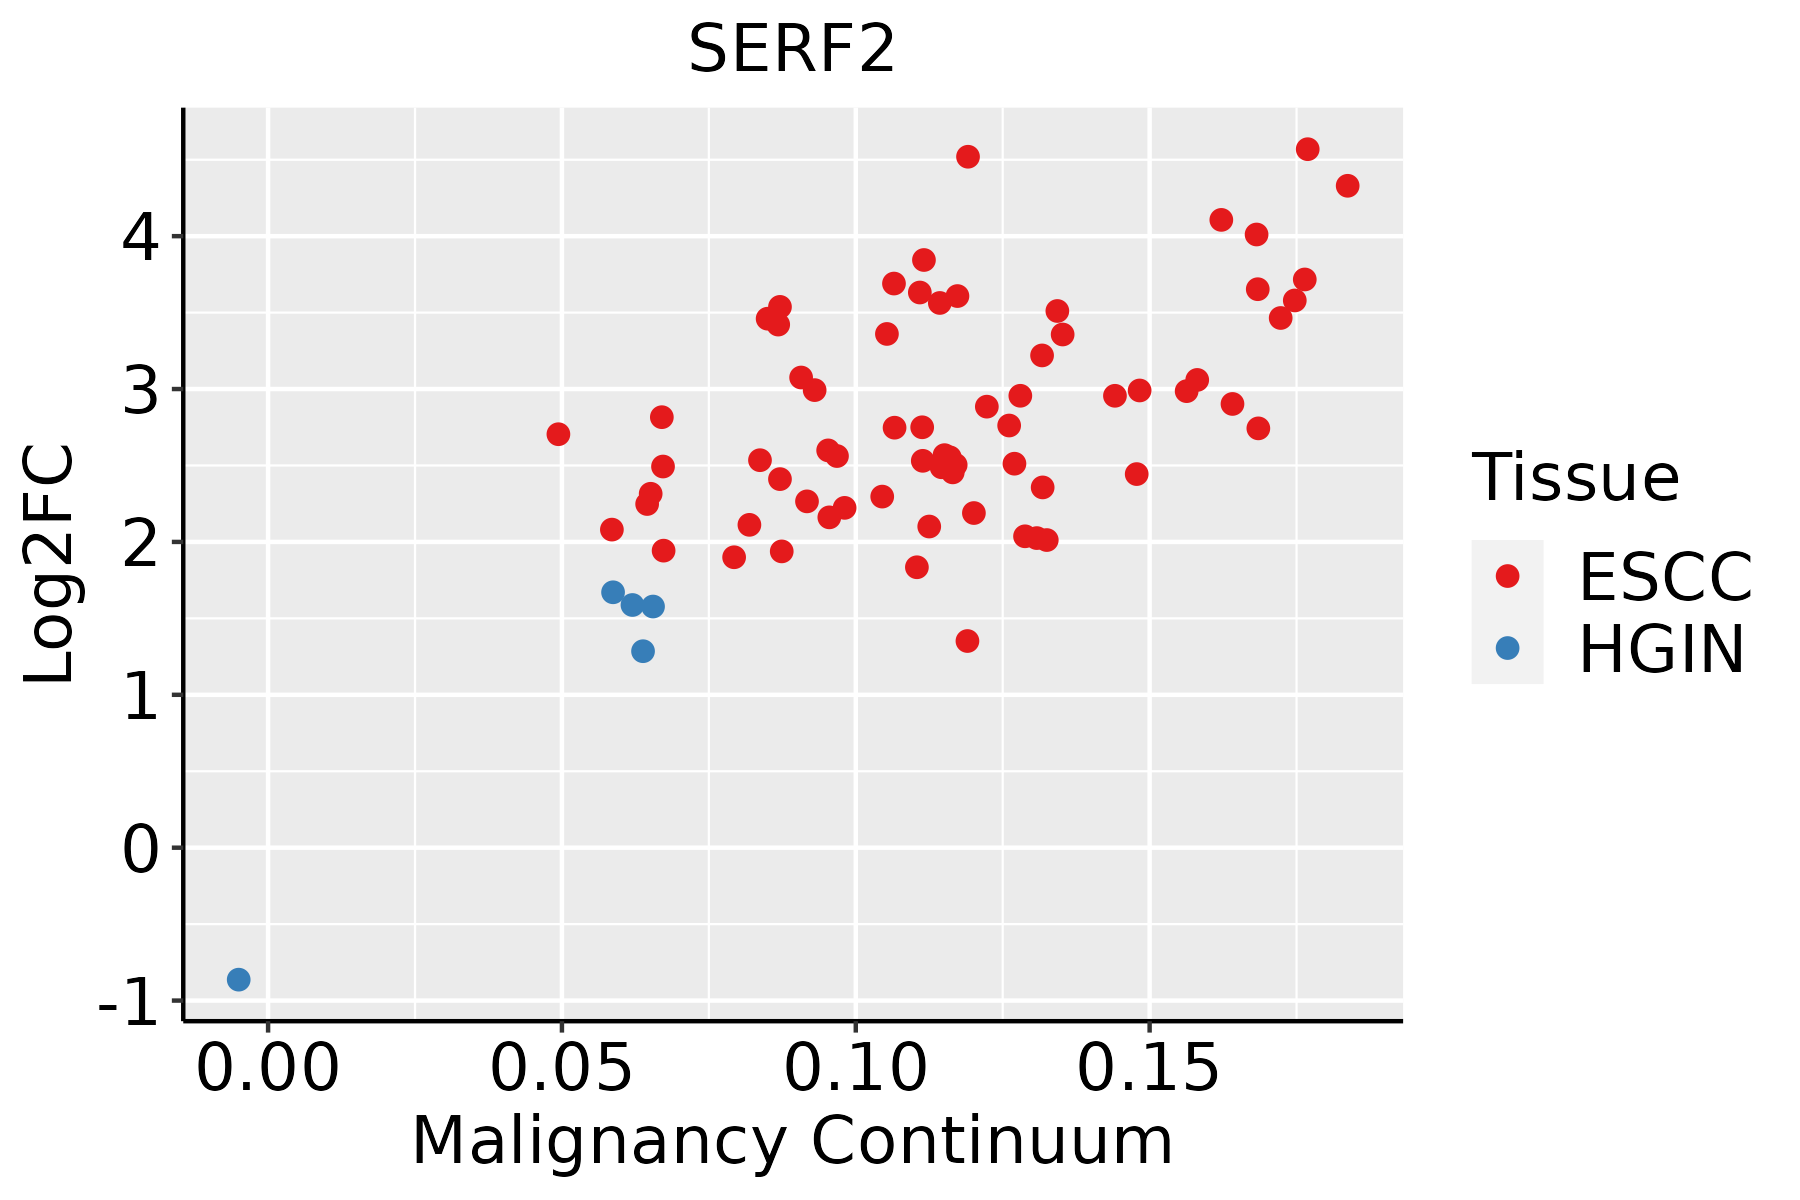
ESCC: Esophageal squamous cell carcinoma
HGIN: High-grade intraepithelial neoplasias
LGIN: Low-grade intraepithelial neoplasias
LiverThe image shows the transcriptomic changes along malignancy continuum.log2FC in expression of this searched gene in stem-like cells from each diseased tissue sample relative to stem-like cells in normal samples in each tissue plotted against the malignancy continuum. Samples are colored based on if they are from different disease stage.
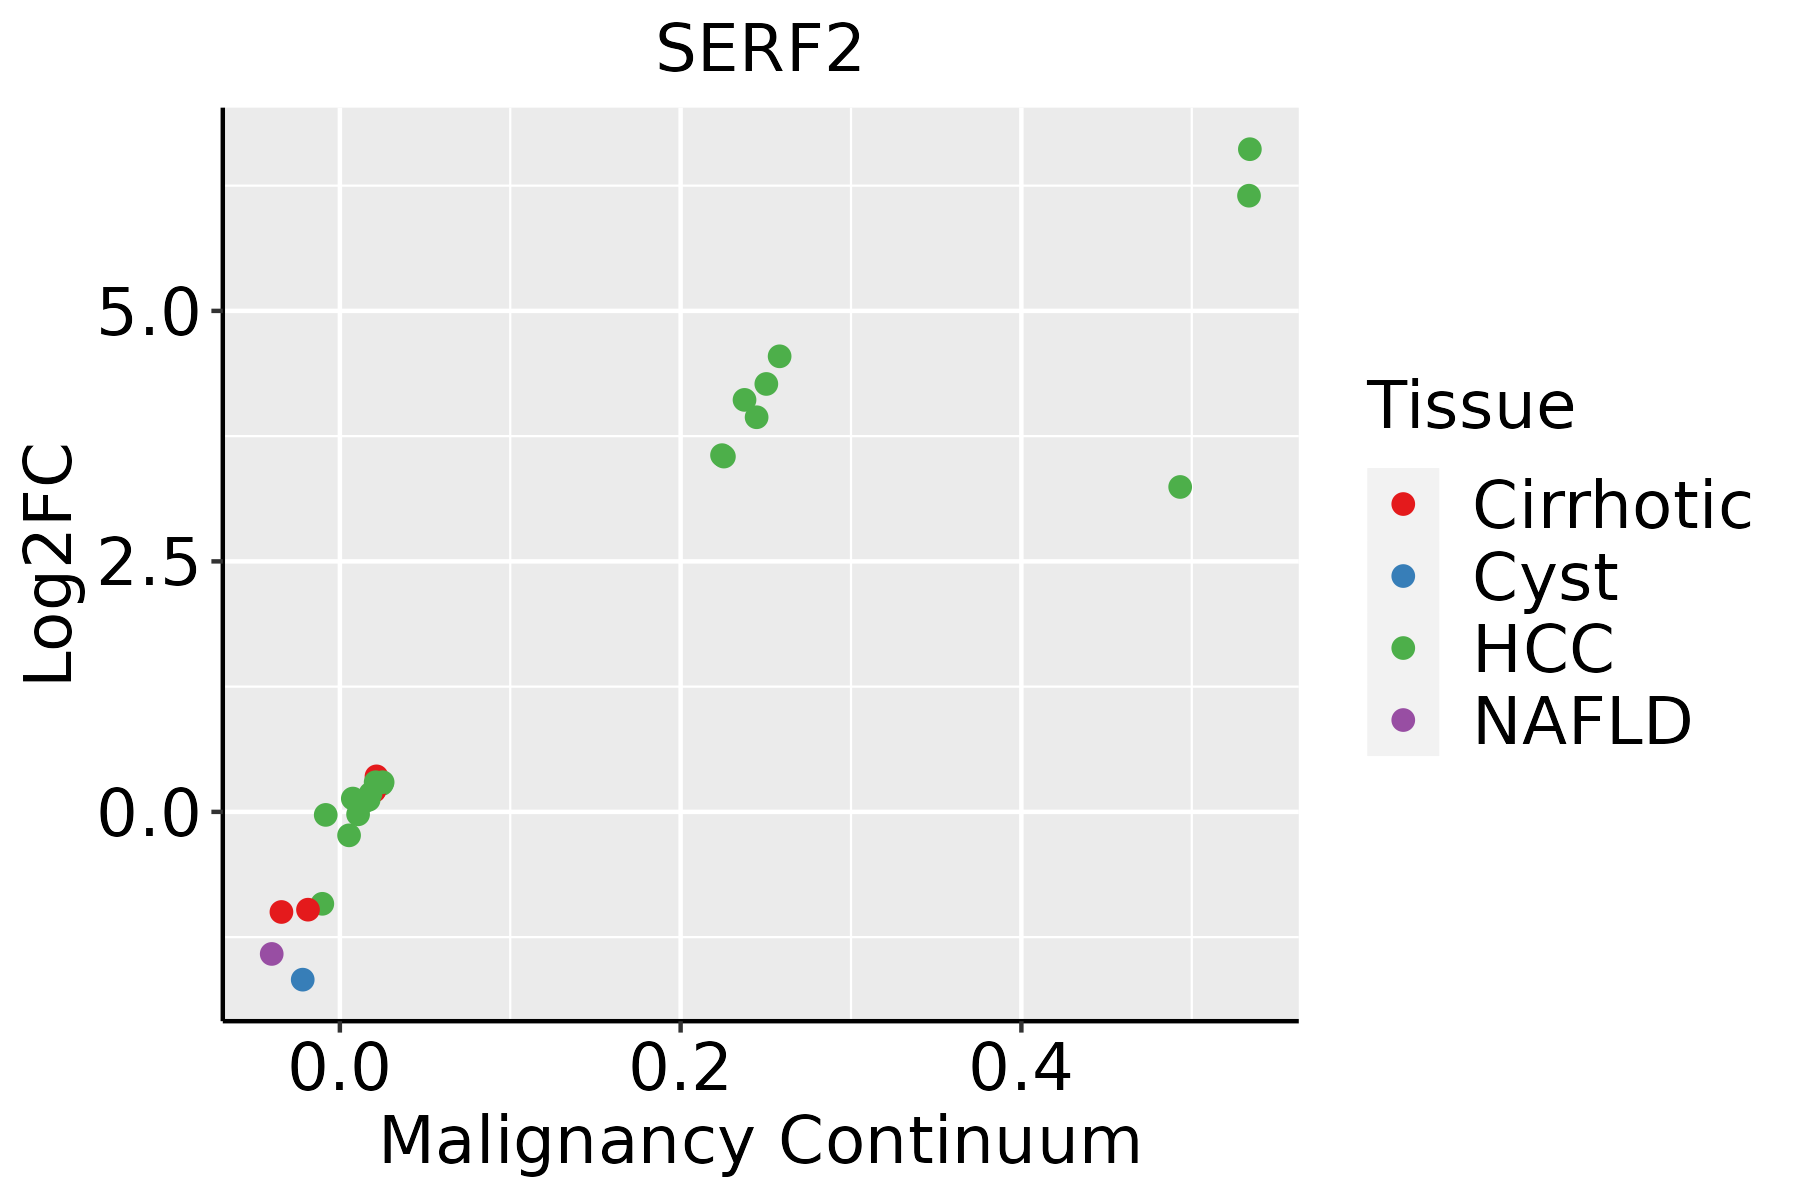
HCC: Hepatocellular carcinoma
NAFLD: Non-alcoholic fatty liver disease
LungThe image shows the transcriptomic changes along malignancy continuum.log2FC in expression of this searched gene in stem-like cells from each diseased tissue sample relative to stem-like cells in normal samples in each tissue plotted against the malignancy continuum. Samples are colored based on if they are from different disease stage.
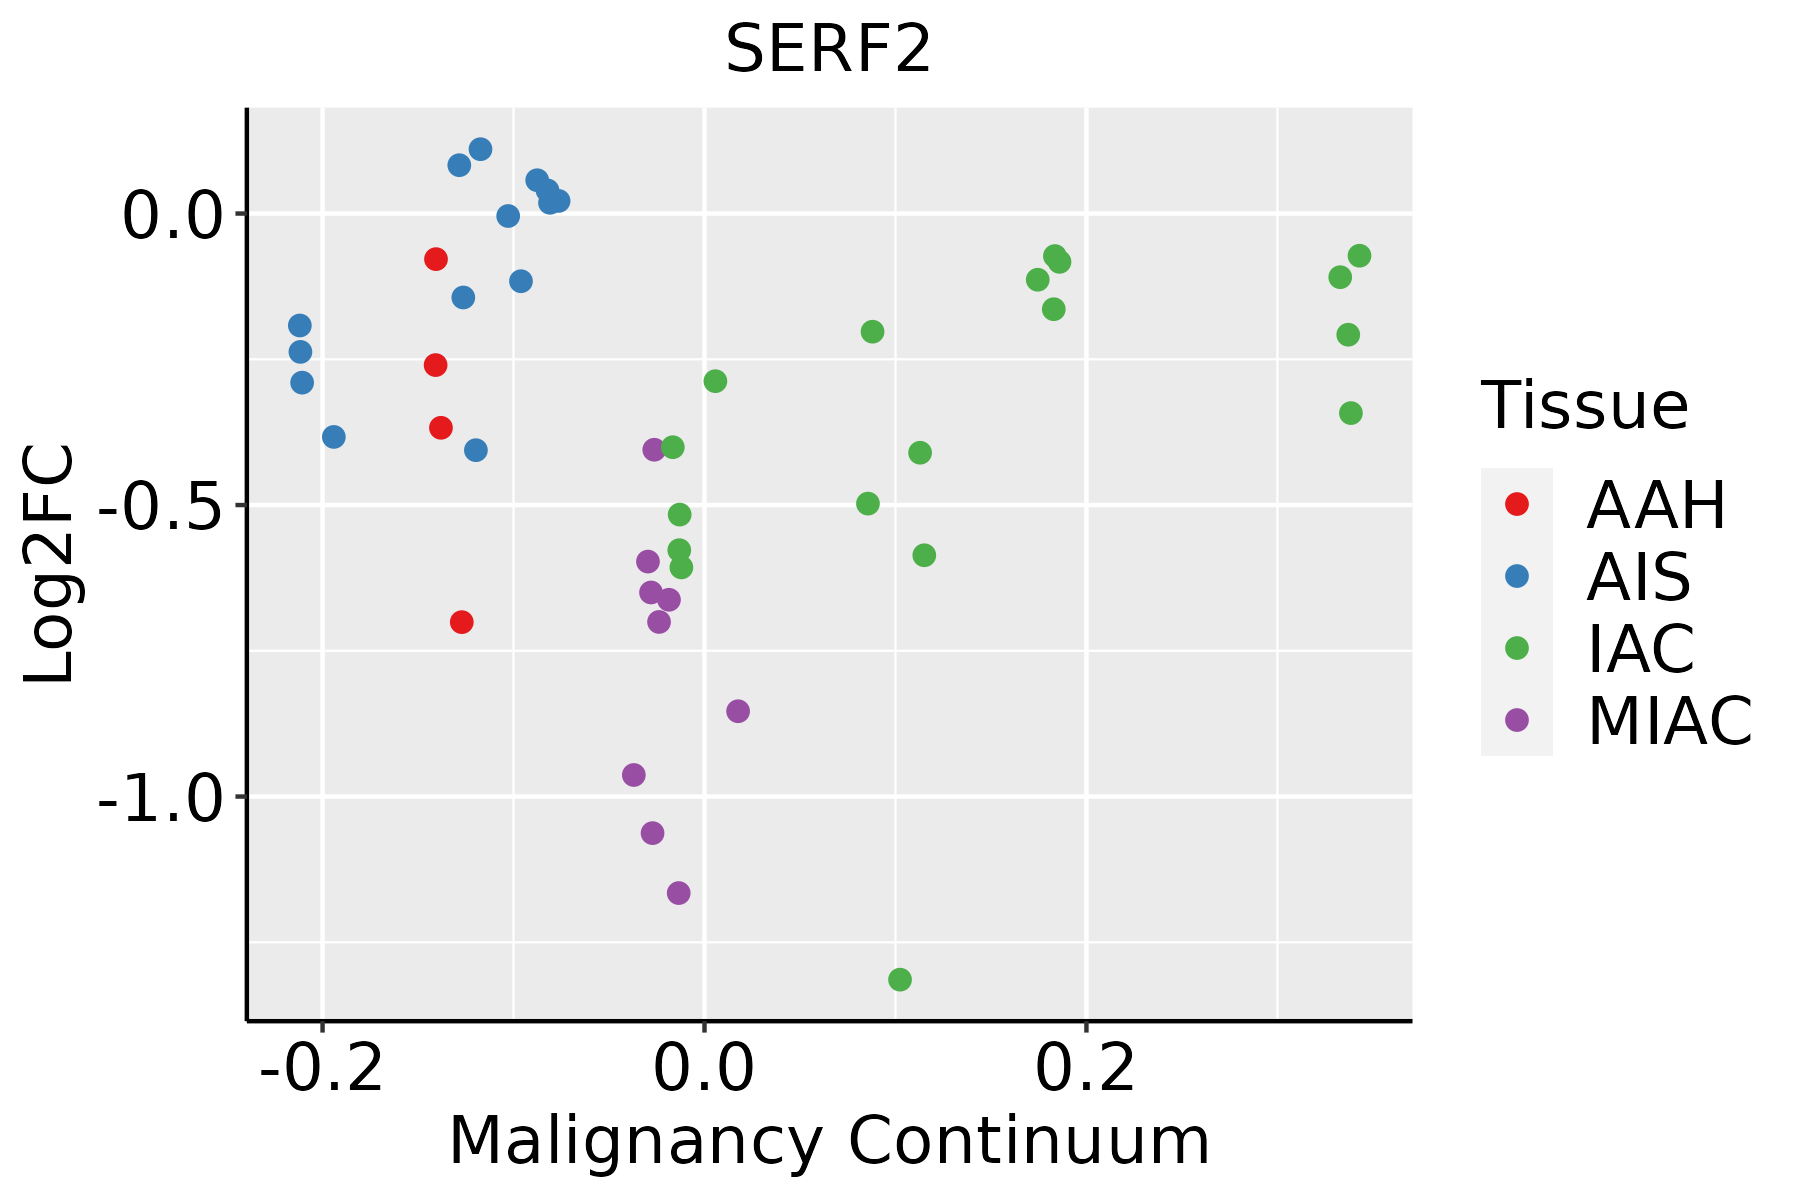
AAH: Atypical adenomatous hyperplasia
AIS: Adenocarcinoma in situ
IAC: Invasive lung adenocarcinoma
MIA: Minimally invasive adenocarcinoma
Oral CavityThe image shows the transcriptomic changes along malignancy continuum.log2FC in expression of this searched gene in stem-like cells from each diseased tissue sample relative to stem-like cells in normal samples in each tissue plotted against the malignancy continuum. Samples are colored based on if they are from different disease stage.EOLP: Erosive Oral lichen planus
LP: leukoplakia
NEOLP: Non-erosive oral lichen planus
OSCC: Oral squamous cell carcinoma
ProstateThe image shows the transcriptomic changes along malignancy continuum.log2FC in expression of this searched gene in stem-like cells from each diseased tissue sample relative to stem-like cells in normal samples in each tissue plotted against the malignancy continuum. Samples are colored based on if they are from different disease stage.
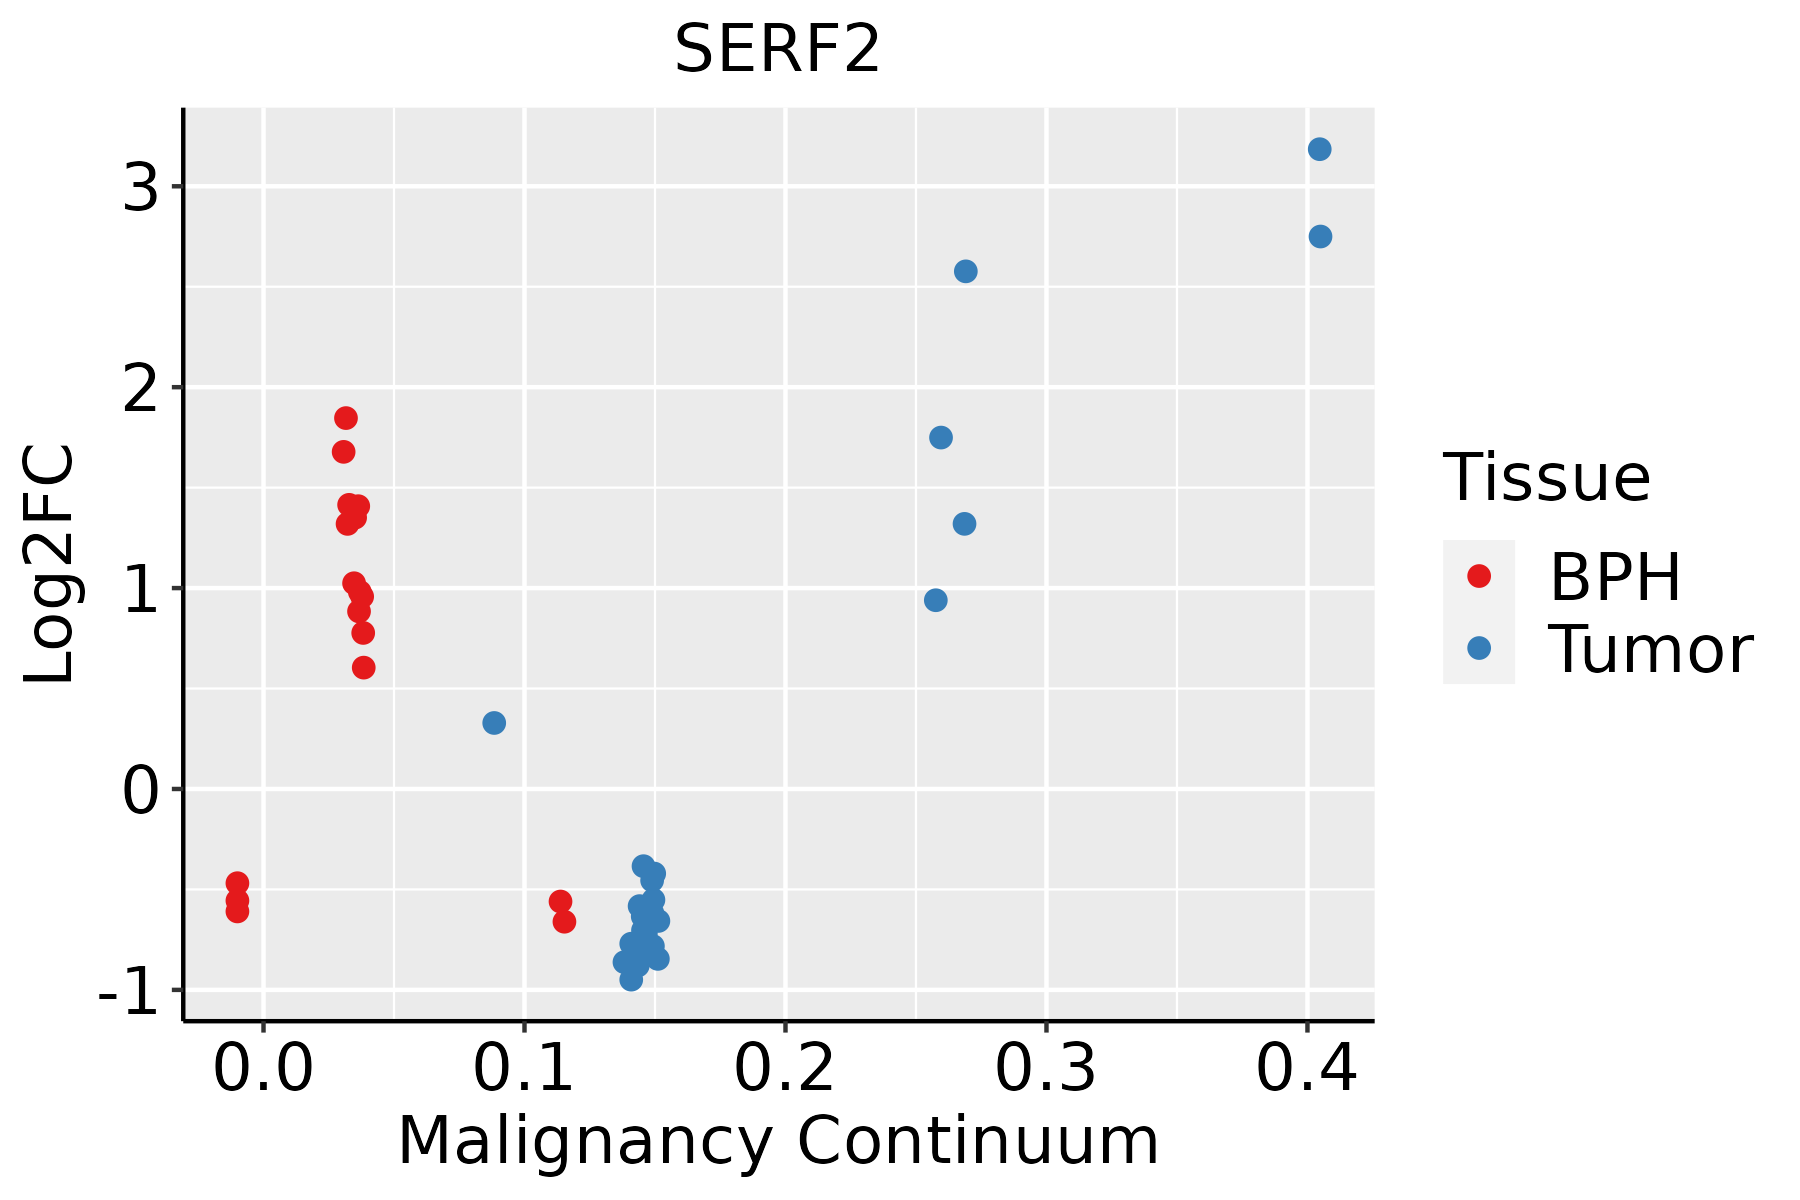
BPH: Benign Prostatic Hyperplasia
SkinThe image shows the transcriptomic changes along malignancy continuum.log2FC in expression of this searched gene in stem-like cells from each diseased tissue sample relative to stem-like cells in normal samples in each tissue plotted against the malignancy continuum. Samples are colored based on if they are from different disease stage.
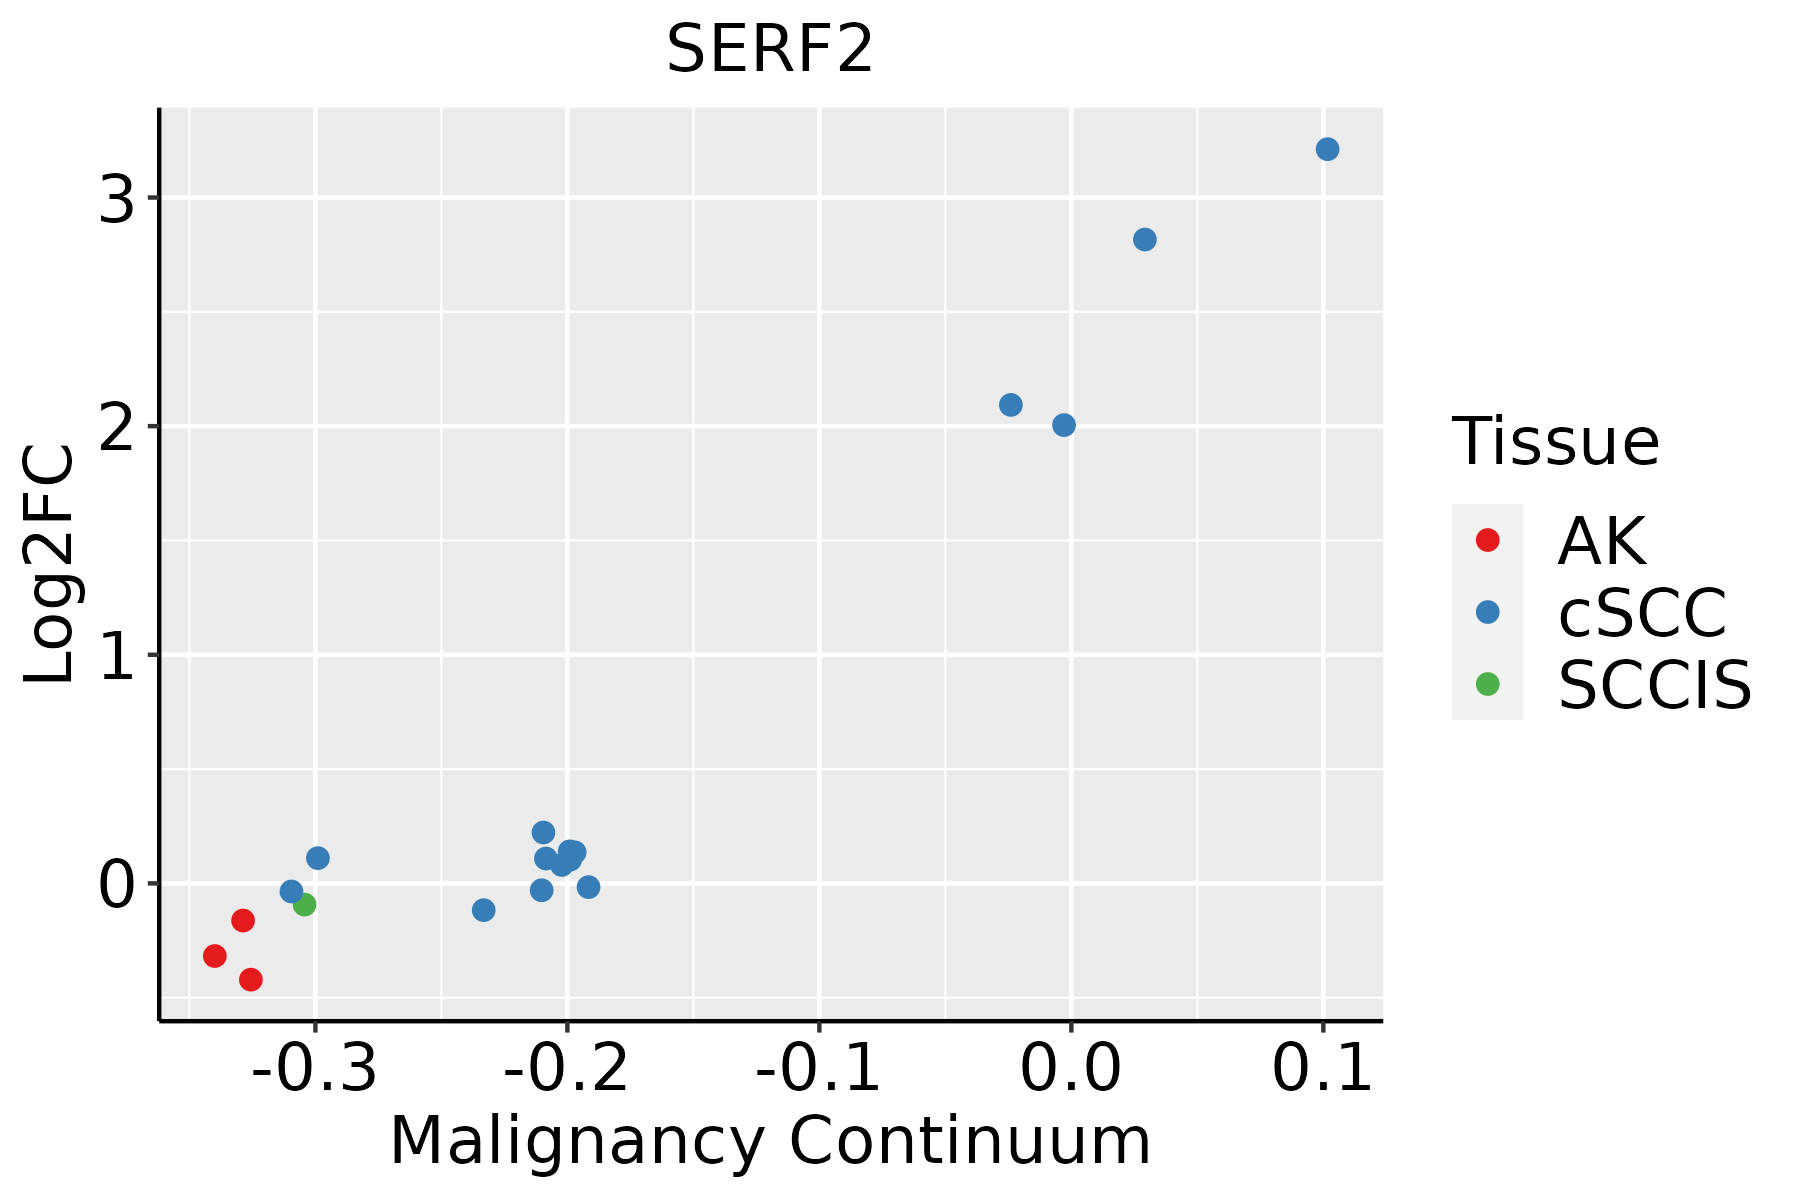
AK: Actinic keratosis
cSCC: Cutaneous squamous cell carcinoma
SCCIS:squamous cell carcinoma in situ
ThyroidThe image shows the transcriptomic changes along malignancy continuum.log2FC in expression of this searched gene in stem-like cells from each diseased tissue sample relative to stem-like cells in normal samples in each tissue plotted against the malignancy continuum. Samples are colored based on if they are from different disease stage.
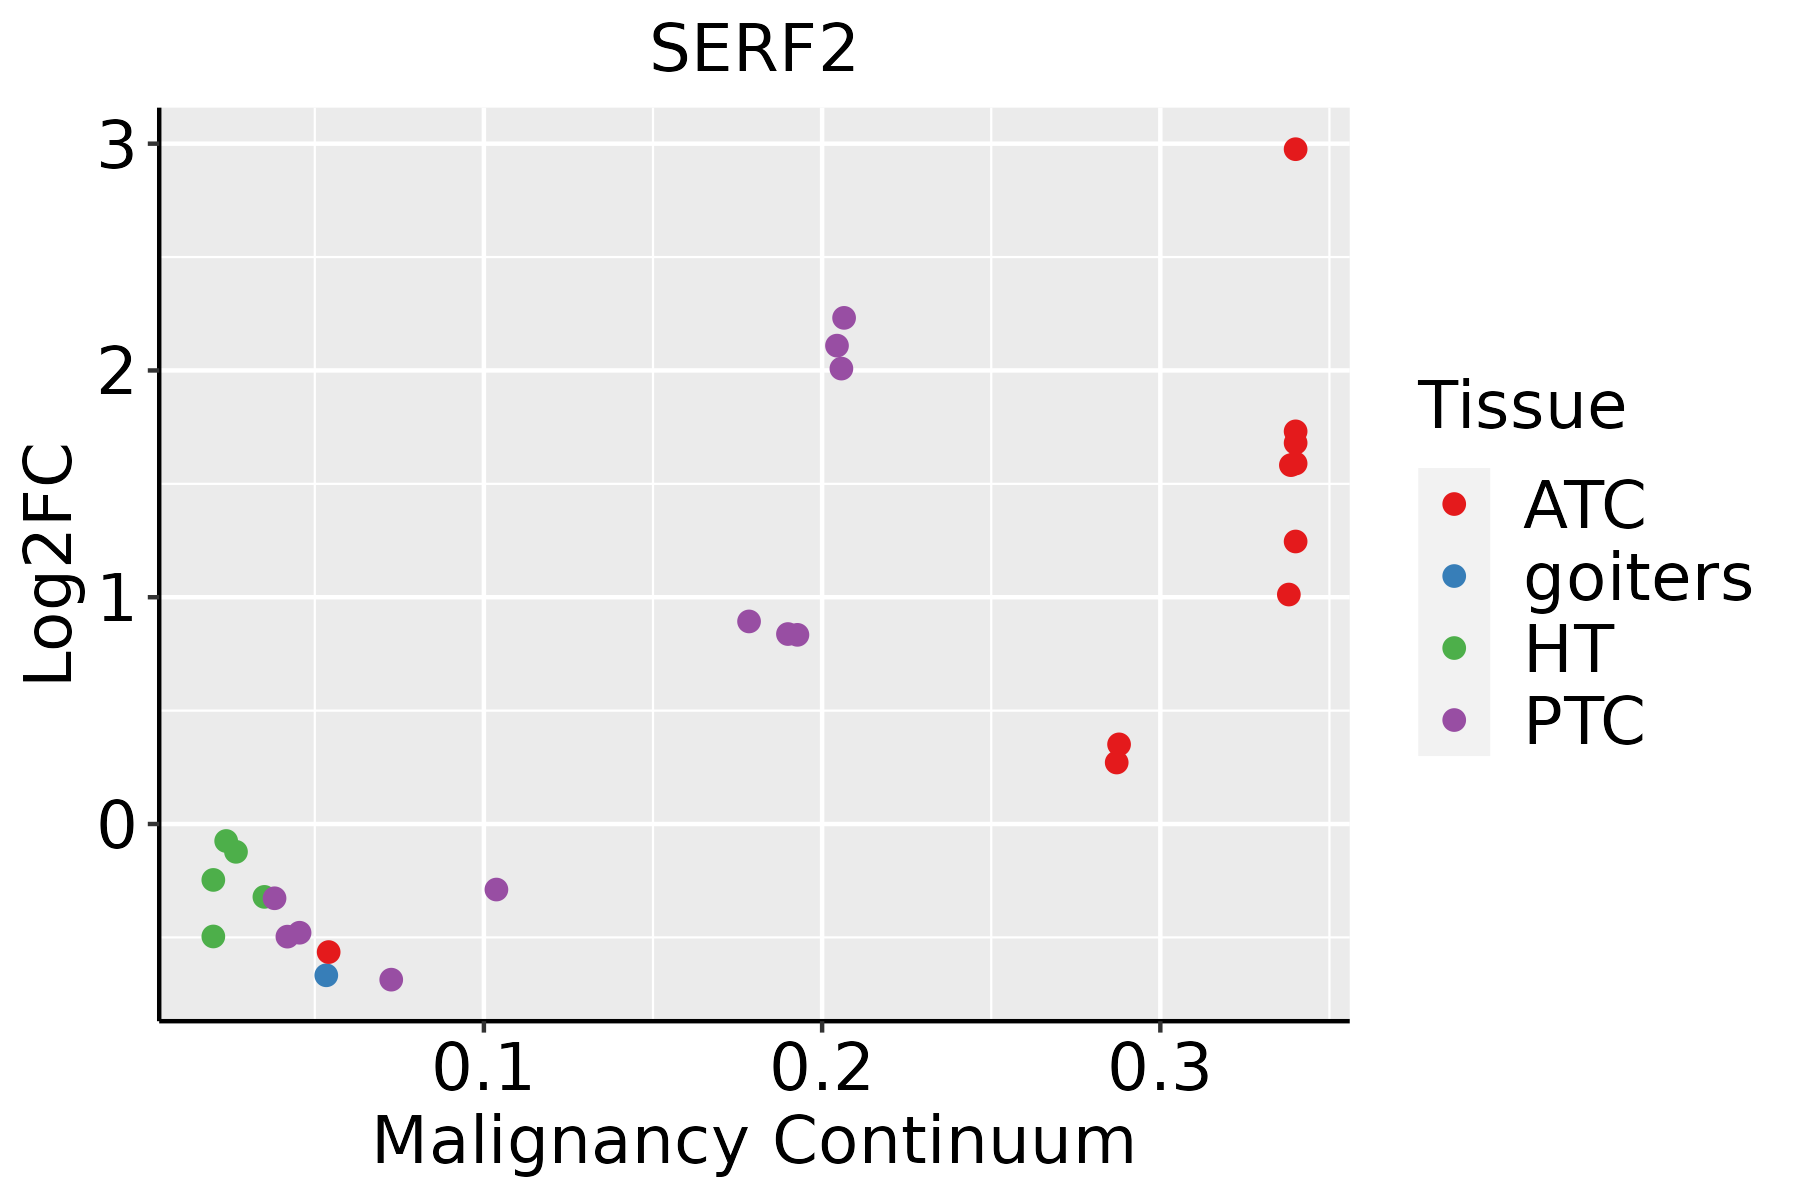
ATC: Anaplastic thyroid cancer
HT: Hashimoto's thyroiditis
PTC: Papillary thyroid cancer
∗log2FC in expression of this searched gene in stem-like cells from each diseased tissue sample relative to stem-like cells in normal samples in each tissue plotted against the malignancy continuum. Samples are colored based on if they are from different disease stage.

Top

Malignant transformation related pathway analysis

check buttonFind out the enriched GO biological processes and KEGG pathways involved in transition from healthy to precancer to cancer
check button Figure of enriched GO biological processes.
TissueDisease StageEnriched GO biological Processes
ColorectumADGO analysis - Figure of enriched GO biological processes: Top 15 enriched GO BP terms are showed in the bar plot of each disease state in each tissue. Each row represents a significant GO biological process which is colored according to the -log10(p.adjust).
ColorectumSERGO analysis - Figure of enriched GO biological processes: Top 15 enriched GO BP terms are showed in the bar plot of each disease state in each tissue. Each row represents a significant GO biological process which is colored according to the -log10(p.adjust).
ColorectumMSSGO analysis - Figure of enriched GO biological processes: Top 15 enriched GO BP terms are showed in the bar plot of each disease state in each tissue. Each row represents a significant GO biological process which is colored according to the -log10(p.adjust).
ColorectumMSI-HGO analysis - Figure of enriched GO biological processes: Top 15 enriched GO BP terms are showed in the bar plot of each disease state in each tissue. Each row represents a significant GO biological process which is colored according to the -log10(p.adjust).
ColorectumFAPGO analysis - Figure of enriched GO biological processes: Top 15 enriched GO BP terms are showed in the bar plot of each disease state in each tissue. Each row represents a significant GO biological process which is colored according to the -log10(p.adjust).
∗Top 15 enriched GO BP terms are showed in the bar plot of each disease state in each tissue. Each row represents a significant GO biological process which is colored according to the -log10(p.adjust).
Page: 1 2 3 4 5 6 7 8 9 

check button Enriched GO biological processes.
GO IDTissueDisease StageDescriptionGene RatioBg Ratiopvaluep.adjustCount
GO:00316481LiverCirrhoticprotein destabilization20/463446/187234.15e-032.22e-0220
GO:003164722LiverHCCregulation of protein stability211/7958298/187232.29e-235.01e-21211
GO:00316482LiverHCCprotein destabilization29/795846/187233.95e-031.74e-0229
GO:003164732LiverCystregulation of protein stability21/496298/187234.94e-052.67e-0321
GO:00316478LungIACregulation of protein stability62/2061298/187235.37e-073.32e-0562
GO:00316483LungIACprotein destabilization15/206146/187237.40e-051.55e-0315
GO:003164713LungAISregulation of protein stability62/1849298/187231.06e-081.63e-0662
GO:003164811LungAISprotein destabilization13/184946/187233.66e-046.46e-0313
GO:003164723LungMIACregulation of protein stability36/967298/187231.93e-062.42e-0436
GO:003164720Oral cavityOSCCregulation of protein stability193/7305298/187231.30e-191.95e-17193
GO:00316485Oral cavityOSCCprotein destabilization29/730546/187238.26e-044.38e-0329
GO:0031647110Oral cavityLPregulation of protein stability132/4623298/187238.16e-147.99e-12132
GO:003164726Oral cavityEOLPregulation of protein stability75/2218298/187231.22e-101.35e-0875
GO:003164733Oral cavityNEOLPregulation of protein stability73/2005298/187237.46e-121.17e-0973
GO:003164718ProstateBPHregulation of protein stability111/3107298/187234.58e-181.42e-15111
GO:003164719ProstateTumorregulation of protein stability112/3246298/187234.18e-171.18e-14112
GO:003164728SkinAKregulation of protein stability64/1910298/187235.93e-094.14e-0764
GO:0031647112SkinSCCISregulation of protein stability26/919298/187233.35e-033.00e-0226
GO:003164729SkincSCCregulation of protein stability144/4864298/187236.51e-176.80e-15144
GO:003164730ThyroidHTregulation of protein stability57/1272298/187238.04e-131.79e-1057
Page: 1 2 3 

check button Enriched KEGG pathways.
Pathway IDTissueDisease StageDescriptionGene RatioBg Ratiopvaluep.adjustqvalueCount
Page: 1 

Top

Cell-cell communication analysis

check buttonIdentification of potential cell-cell interactions between two cell types and their ligand-receptor pairs for different disease states
LigandReceptorLRpairPathwayTissueDisease Stage
Page: 1 

Top

Single-cell gene regulatory network inference analysis

check buttonFind out the significant the regulons (TFs) and the target genes of each regulon across cell types for different disease states
TFCell TypeTissueDisease StageTarget GeneRSSRegulon Activity
∗The dot plots of a searched regulon are shown for all cell subpopulations in each disease state of each tissue based on the regulon specific score inferred using pySCENIC and by calculating the average expression.
Page: 1 

Top

Somatic mutation of malignant transformation related genes

check buttonAnnotation of somatic variants for genes involved in malignant transformation
Hugo SymbolVariant ClassVariant ClassificationdbSNP RSHGVScHGVSpHGVSp ShortSWISSPROTBIOTYPESIFTPolyPhenTumor Sample BarcodeTissueHistologySexAgeStageTherapy TypesDrugsOutcome
SERF2SNVMissense_Mutationc.241C>Gp.Leu81Valp.L81VP84101protein_codingdeleterious_low_confidence(0)possibly_damaging(0.672)TCGA-AN-A0AJ-01Breastbreast invasive carcinomaFemale>=65I/IIUnknownUnknownSD
SERF2SNVMissense_Mutationc.475N>Gp.Gln159Glup.Q159EP84101protein_codingdeleterious_low_confidence(0)benign(0.125)TCGA-JW-A5VL-01Cervixcervical & endocervical cancerFemale<65I/IIUnknownUnknownSD
SERF2SNVMissense_Mutationc.136A>Cp.Asn46Hisp.N46HP84101protein_codingtolerated_low_confidence(1)benign(0)TCGA-AA-3977-01Colorectumcolon adenocarcinomaMale>=65I/IIUnknownUnknownSD
SERF2SNVMissense_Mutationc.352N>Gp.Cys118Glyp.C118GP84101protein_codingdeleterious_low_confidence(0.02)benign(0.014)TCGA-AA-A02R-01Colorectumcolon adenocarcinomaFemale>=65I/IIUnknownUnknownPD
SERF2SNVMissense_Mutationc.473C>Ap.Pro158Hisp.P158HP84101protein_codingdeleterious_low_confidence(0)probably_damaging(0.996)TCGA-CK-6746-01Colorectumcolon adenocarcinomaFemale>=65I/IIUnknownUnknownSD
SERF2SNVMissense_Mutationnovelc.260N>Tp.Arg87Ilep.R87IP84101protein_codingdeleterious_low_confidence(0)possibly_damaging(0.852)TCGA-A5-A0G2-01Endometriumuterine corpus endometrioid carcinomaFemale<65III/IVUnknownUnknownSD
SERF2SNVMissense_Mutationnovelc.418N>Ap.Asp140Asnp.D140NP84101protein_codingdeleterious_low_confidence(0)probably_damaging(0.978)TCGA-A5-A1OF-01Endometriumuterine corpus endometrioid carcinomaFemale<65I/IIUnknownUnknownSD
SERF2SNVMissense_Mutationnovelc.165N>Gp.His55Glnp.H55QP84101protein_codingdeleterious_low_confidence(0)benign(0.036)TCGA-S2-AA1A-01Lunglung adenocarcinomaFemale>=65I/IIUnknownUnknownSD
SERF2SNVMissense_Mutationc.101N>Tp.Ala34Valp.A34VP84101protein_codingdeleterious_low_confidence(0.02)probably_damaging(0.992)TCGA-34-A5IX-01Lunglung squamous cell carcinomaMale>=65I/IIUnknownUnknownSD
SERF2SNVMissense_Mutationnovelc.388N>Tp.Pro130Serp.P130SP84101protein_codingtolerated_low_confidence(0.54)benign(0.001)TCGA-90-A4ED-01Lunglung squamous cell carcinomaMale>=65I/IIUnknownUnknownSD
Page: 1 2 

Top

Related drugs of malignant transformation related genes

check buttonIdentification of chemicals and drugs interact with genes involved in malignant transfromation
(DGIdb 4.0)
Entrez IDSymbolCategoryInteraction TypesDrug Claim NameDrug NamePMIDs
Page: 1