
|
|||||
|
 | |
| |
| |
| |
| |
| |
|
Gene: SDSL |
Gene summary for SDSL |
| Gene information | Species | Human | Gene symbol | SDSL | Gene ID | 113675 |
| Gene name | serine dehydratase like | |
| Gene Alias | SDH 2 | |
| Cytomap | 12q24.13 | |
| Gene Type | protein-coding | GO ID | GO:0006082 | UniProtAcc | A0A024RBL2 |
Top |
Malignant transformation analysis |
| Identification of the aberrant gene expression in precancerous and cancerous lesions by comparing the gene expression of stem-like cells in diseased tissues with normal stem cells |
| Entrez ID | Symbol | Replicates | Species | Organ | Tissue | Adj P-value | Log2FC | Malignancy |
| 113675 | SDSL | HCC1_Meng | Human | Liver | HCC | 3.30e-68 | 2.73e-01 | 0.0246 |
| 113675 | SDSL | HCC2_Meng | Human | Liver | HCC | 9.91e-11 | 1.61e-02 | 0.0107 |
| 113675 | SDSL | cirrhotic3 | Human | Liver | Cirrhotic | 3.32e-04 | 1.44e-01 | 0.0215 |
| 113675 | SDSL | HCC2 | Human | Liver | HCC | 2.62e-07 | 3.26e+00 | 0.5341 |
| 113675 | SDSL | Pt13.b | Human | Liver | HCC | 1.17e-05 | 1.68e-01 | 0.0251 |
| 113675 | SDSL | Pt14.b | Human | Liver | HCC | 1.00e-05 | 3.10e-01 | 0.018 |
| 113675 | SDSL | S014 | Human | Liver | HCC | 8.05e-09 | 4.21e-01 | 0.2254 |
| 113675 | SDSL | S015 | Human | Liver | HCC | 2.06e-09 | 6.88e-01 | 0.2375 |
| 113675 | SDSL | S016 | Human | Liver | HCC | 1.91e-08 | 4.29e-01 | 0.2243 |
| 113675 | SDSL | S027 | Human | Liver | HCC | 4.92e-11 | 1.06e+00 | 0.2446 |
| 113675 | SDSL | S028 | Human | Liver | HCC | 2.72e-31 | 1.27e+00 | 0.2503 |
| 113675 | SDSL | S029 | Human | Liver | HCC | 1.26e-29 | 1.47e+00 | 0.2581 |
| 113675 | SDSL | male-WTA | Human | Thyroid | PTC | 4.36e-18 | 3.71e-02 | 0.1037 |
| 113675 | SDSL | PTC01 | Human | Thyroid | PTC | 4.48e-16 | 1.13e-01 | 0.1899 |
| 113675 | SDSL | PTC04 | Human | Thyroid | PTC | 3.37e-05 | 1.33e-01 | 0.1927 |
| 113675 | SDSL | PTC05 | Human | Thyroid | PTC | 5.07e-07 | 2.33e-01 | 0.2065 |
| 113675 | SDSL | PTC06 | Human | Thyroid | PTC | 1.11e-18 | 4.21e-01 | 0.2057 |
| 113675 | SDSL | PTC07 | Human | Thyroid | PTC | 3.73e-25 | 3.18e-01 | 0.2044 |
| 113675 | SDSL | ATC12 | Human | Thyroid | ATC | 2.21e-09 | -1.23e-02 | 0.34 |
| 113675 | SDSL | ATC13 | Human | Thyroid | ATC | 5.46e-18 | 4.61e-01 | 0.34 |
| Page: 1 2 |
| Tissue | Expression Dynamics | Abbreviation |
| Liver | 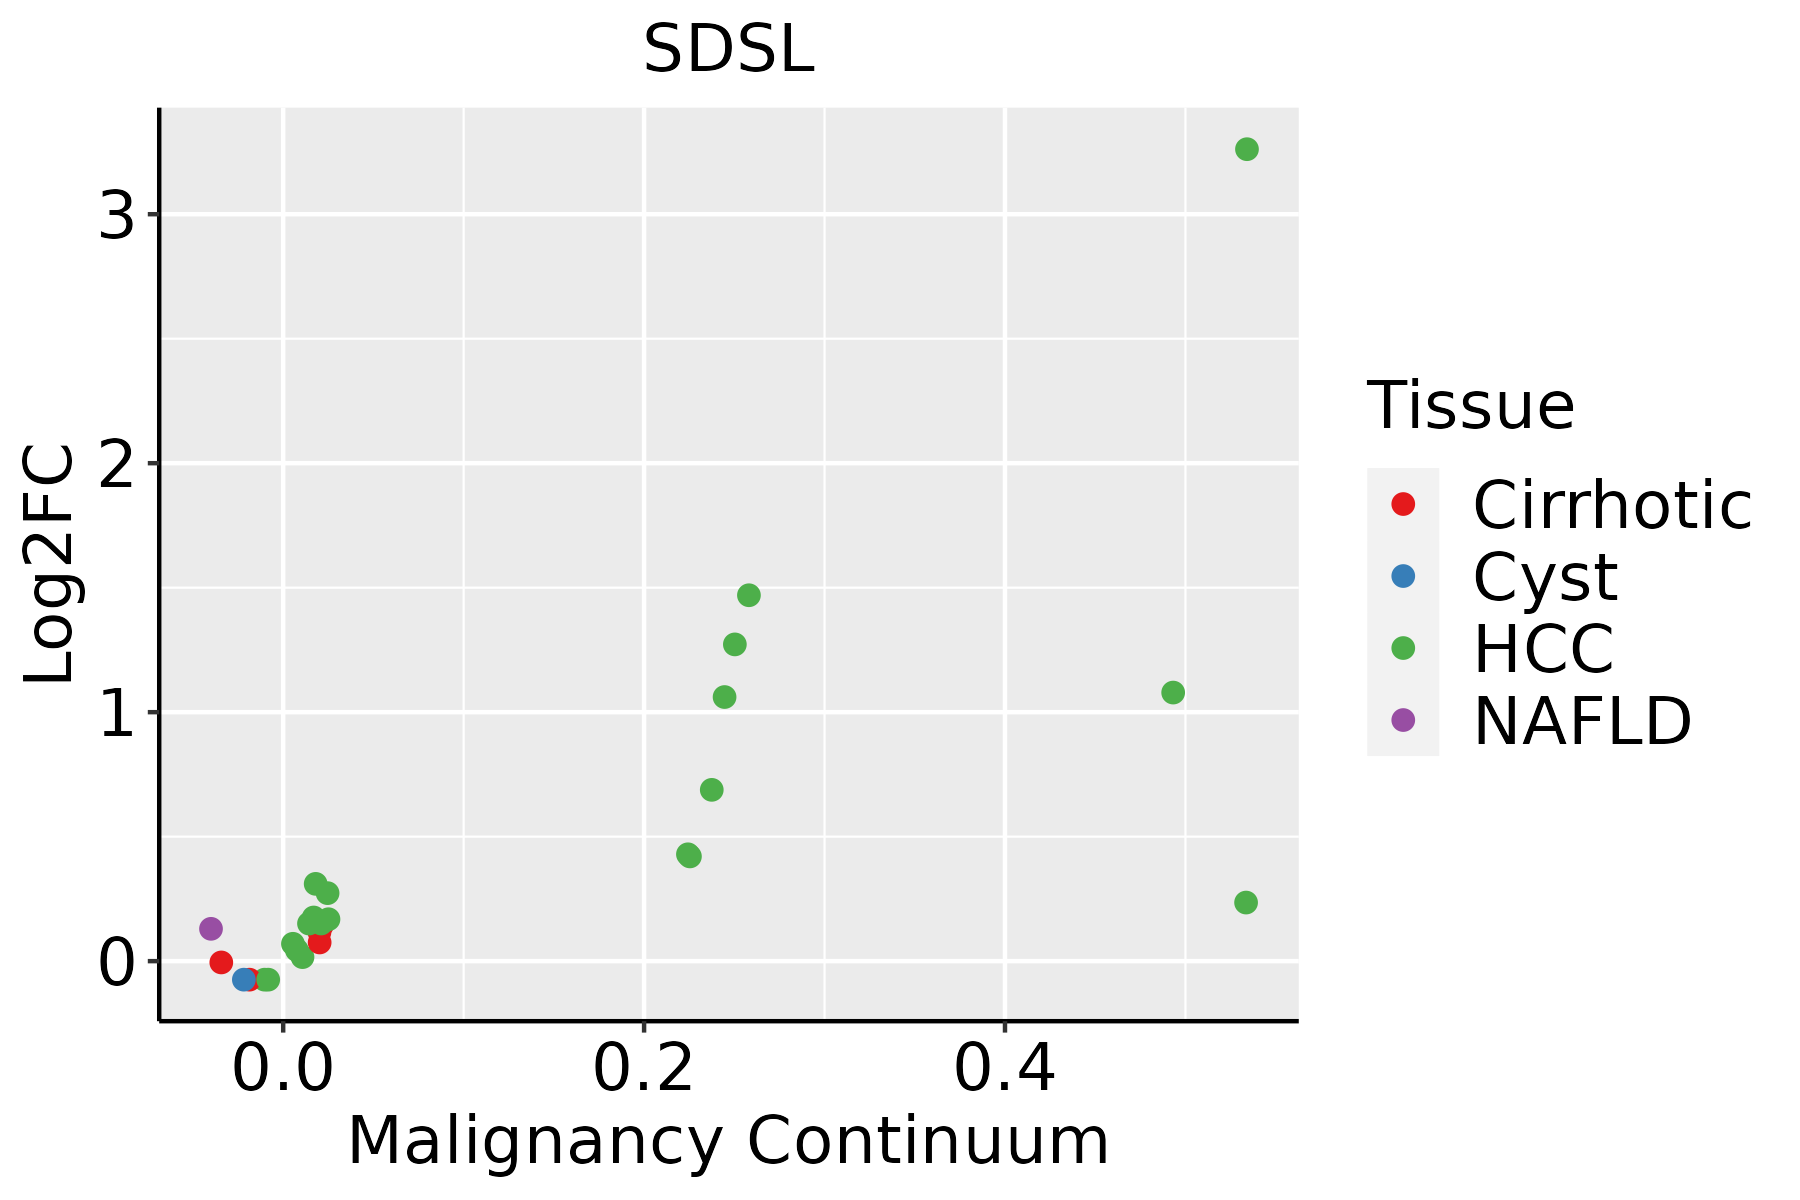 | HCC: Hepatocellular carcinoma |
| NAFLD: Non-alcoholic fatty liver disease | ||
| Thyroid | 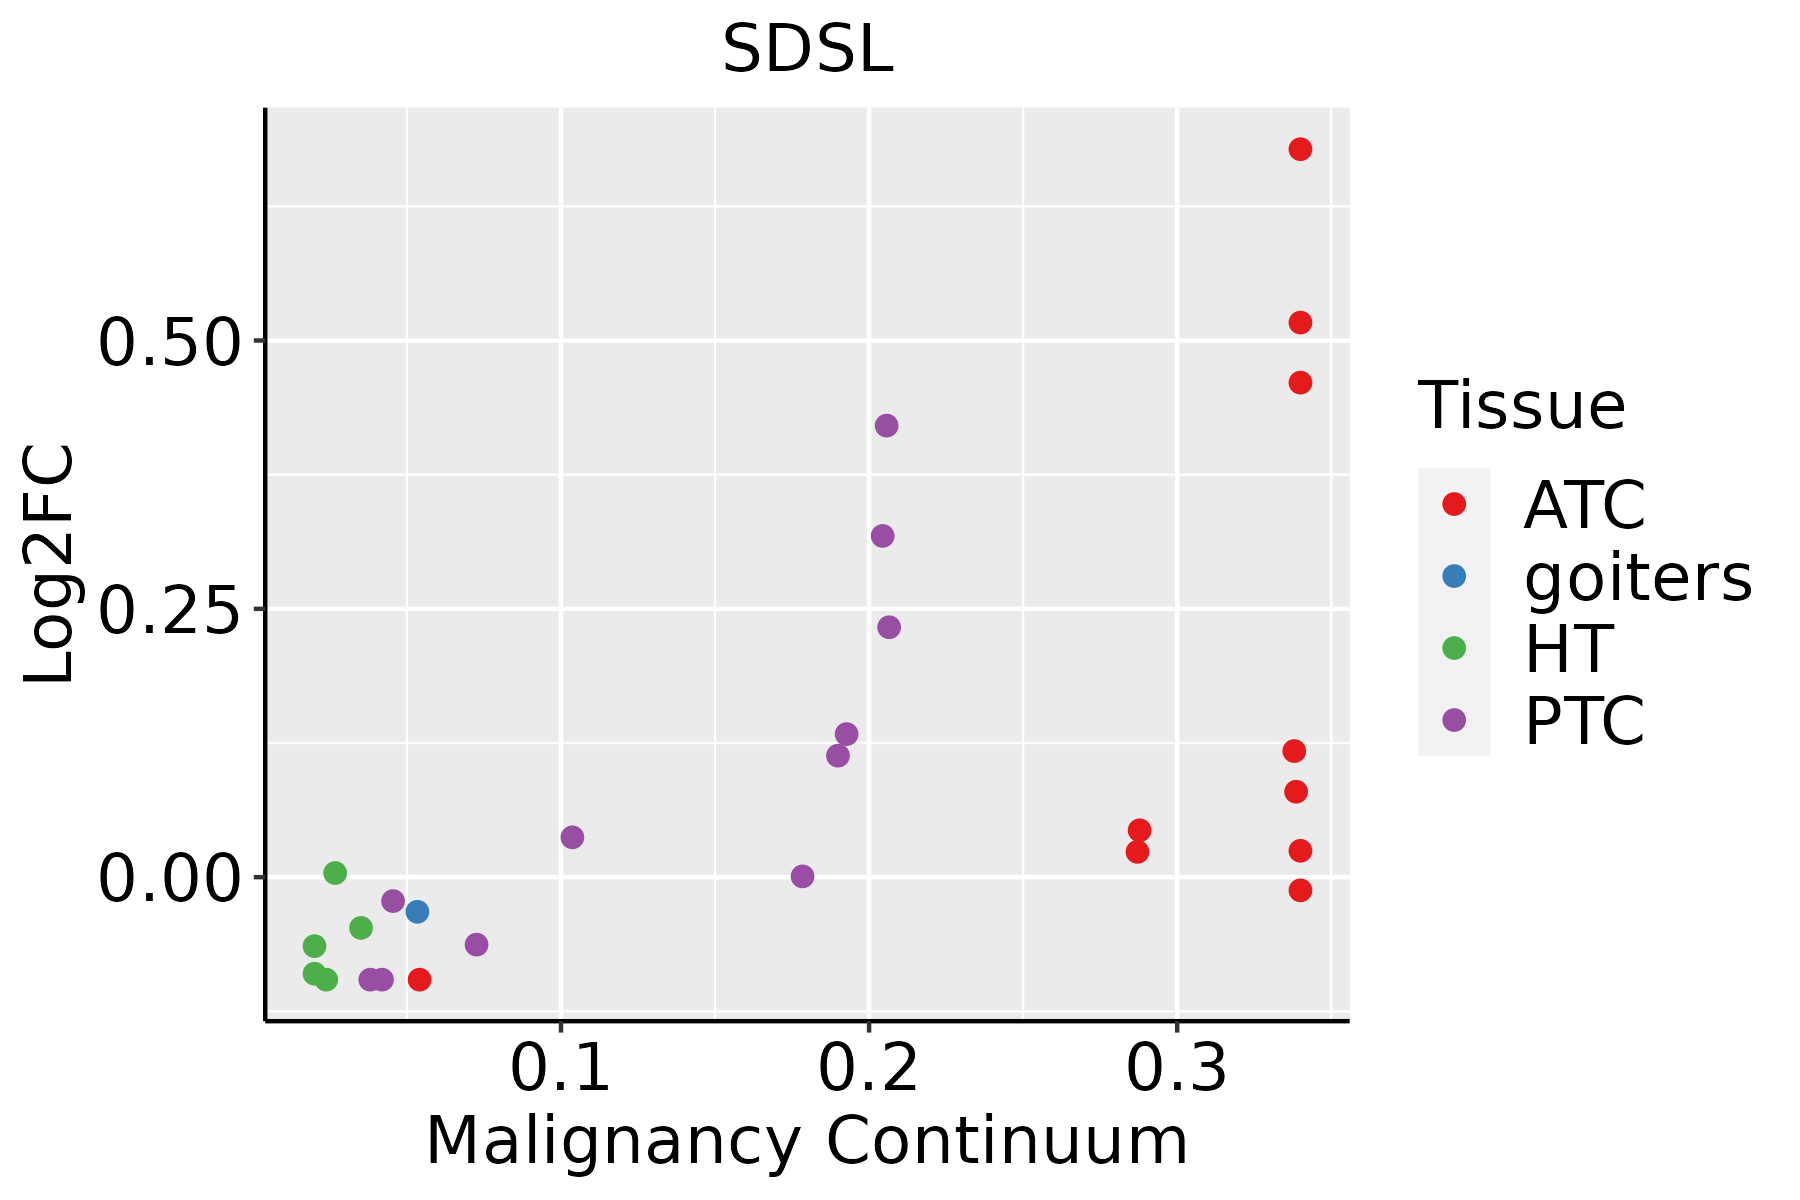 | ATC: Anaplastic thyroid cancer |
| HT: Hashimoto's thyroiditis | ||
| PTC: Papillary thyroid cancer |
| ∗log2FC in expression of this searched gene in stem-like cells from each diseased tissue sample relative to stem-like cells in normal samples in each tissue plotted against the malignancy continuum. Samples are colored based on if they are from different disease stage. |
Top |
Malignant transformation related pathway analysis |
| Find out the enriched GO biological processes and KEGG pathways involved in transition from healthy to precancer to cancer |
| Tissue | Disease Stage | Enriched GO biological Processes |
| Colorectum | AD |  |
| Colorectum | SER |  |
| Colorectum | MSS |  |
| Colorectum | MSI-H |  |
| Colorectum | FAP |  |
| ∗Top 15 enriched GO BP terms are showed in the bar plot of each disease state in each tissue. Each row represents a significant GO biological process which is colored according to the -log10(p.adjust). |
| Page: 1 2 3 4 5 6 7 8 9 |
| GO ID | Tissue | Disease Stage | Description | Gene Ratio | Bg Ratio | pvalue | p.adjust | Count |
| GO:19016072 | Liver | HCC | alpha-amino acid biosynthetic process | 53/7958 | 68/18723 | 2.62e-09 | 7.16e-08 | 53 |
| GO:00065202 | Liver | HCC | cellular amino acid metabolic process | 167/7958 | 284/18723 | 1.91e-08 | 4.56e-07 | 167 |
| GO:00090632 | Liver | HCC | cellular amino acid catabolic process | 70/7958 | 110/18723 | 6.12e-06 | 7.52e-05 | 70 |
| GO:00090662 | Liver | HCC | aspartate family amino acid metabolic process | 34/7958 | 49/18723 | 1.28e-04 | 1.06e-03 | 34 |
| GO:00090812 | Liver | HCC | branched-chain amino acid metabolic process | 16/7958 | 19/18723 | 2.37e-04 | 1.79e-03 | 16 |
| GO:19016062 | Liver | HCC | alpha-amino acid catabolic process | 53/7958 | 87/18723 | 4.01e-04 | 2.71e-03 | 53 |
| GO:19016077 | Thyroid | PTC | alpha-amino acid biosynthetic process | 33/5968 | 68/18723 | 3.04e-03 | 1.50e-02 | 33 |
| GO:00086527 | Thyroid | PTC | cellular amino acid biosynthetic process | 35/5968 | 76/18723 | 6.68e-03 | 2.89e-02 | 35 |
| GO:000865212 | Thyroid | ATC | cellular amino acid biosynthetic process | 39/6293 | 76/18723 | 1.07e-03 | 5.63e-03 | 39 |
| GO:190160712 | Thyroid | ATC | alpha-amino acid biosynthetic process | 35/6293 | 68/18723 | 1.76e-03 | 8.71e-03 | 35 |
| Page: 1 2 |
| Pathway ID | Tissue | Disease Stage | Description | Gene Ratio | Bg Ratio | pvalue | p.adjust | qvalue | Count |
| hsa0120041 | Liver | HCC | Carbon metabolism | 89/4020 | 115/8465 | 3.92e-11 | 6.56e-10 | 3.65e-10 | 89 |
| hsa0123021 | Liver | HCC | Biosynthesis of amino acids | 53/4020 | 75/8465 | 3.79e-05 | 2.11e-04 | 1.18e-04 | 53 |
| hsa002702 | Liver | HCC | Cysteine and methionine metabolism | 35/4020 | 52/8465 | 3.03e-03 | 9.94e-03 | 5.53e-03 | 35 |
| hsa002602 | Liver | HCC | Glycine, serine and threonine metabolism | 28/4020 | 40/8465 | 3.28e-03 | 1.07e-02 | 5.93e-03 | 28 |
| hsa0120051 | Liver | HCC | Carbon metabolism | 89/4020 | 115/8465 | 3.92e-11 | 6.56e-10 | 3.65e-10 | 89 |
| hsa0123031 | Liver | HCC | Biosynthesis of amino acids | 53/4020 | 75/8465 | 3.79e-05 | 2.11e-04 | 1.18e-04 | 53 |
| hsa002703 | Liver | HCC | Cysteine and methionine metabolism | 35/4020 | 52/8465 | 3.03e-03 | 9.94e-03 | 5.53e-03 | 35 |
| hsa002603 | Liver | HCC | Glycine, serine and threonine metabolism | 28/4020 | 40/8465 | 3.28e-03 | 1.07e-02 | 5.93e-03 | 28 |
| Page: 1 |
Top |
Cell-cell communication analysis |
| Identification of potential cell-cell interactions between two cell types and their ligand-receptor pairs for different disease states |
| Ligand | Receptor | LRpair | Pathway | Tissue | Disease Stage |
| Page: 1 |
Top |
Single-cell gene regulatory network inference analysis |
| Find out the significant the regulons (TFs) and the target genes of each regulon across cell types for different disease states |
| TF | Cell Type | Tissue | Disease Stage | Target Gene | RSS | Regulon Activity |
| ∗The dot plots of a searched regulon are shown for all cell subpopulations in each disease state of each tissue based on the regulon specific score inferred using pySCENIC and by calculating the average expression. |
| Page: 1 |
Top |
Somatic mutation of malignant transformation related genes |
| Annotation of somatic variants for genes involved in malignant transformation |
| Hugo Symbol | Variant Class | Variant Classification | dbSNP RS | HGVSc | HGVSp | HGVSp Short | SWISSPROT | BIOTYPE | SIFT | PolyPhen | Tumor Sample Barcode | Tissue | Histology | Sex | Age | Stage | Therapy Types | Drugs | Outcome |
| SDSL | SNV | Missense_Mutation | rs779164441 | c.936N>A | p.Asn312Lys | p.N312K | Q96GA7 | protein_coding | tolerated(0.05) | possibly_damaging(0.647) | TCGA-D8-A1JD-01 | Breast | breast invasive carcinoma | Female | <65 | I/II | Chemotherapy | adriamycin | SD |
| SDSL | insertion | In_Frame_Ins | novel | c.660_661insCAAATACATAATAAAGAAAAT | p.Pro220_Asp221insGlnIleHisAsnLysGluAsn | p.P220_D221insQIHNKEN | Q96GA7 | protein_coding | TCGA-A8-A09K-01 | Breast | breast invasive carcinoma | Female | >=65 | I/II | Unknown | Unknown | SD | ||
| SDSL | insertion | Nonsense_Mutation | novel | c.143_144insATAAAAATCACAATGAGAAACTACTGCACACCCGTGAGAAT | p.Ile49Ter | p.I49* | Q96GA7 | protein_coding | TCGA-E2-A10A-01 | Breast | breast invasive carcinoma | Female | <65 | I/II | Hormone Therapy | zoladex | SD | ||
| SDSL | SNV | Missense_Mutation | rs768208355 | c.337N>A | p.Val113Ile | p.V113I | Q96GA7 | protein_coding | deleterious(0.02) | possibly_damaging(0.854) | TCGA-2W-A8YY-01 | Cervix | cervical & endocervical cancer | Female | <65 | I/II | Chemotherapy | cisplatin | CR |
| SDSL | SNV | Missense_Mutation | c.454N>A | p.Ala152Thr | p.A152T | Q96GA7 | protein_coding | tolerated(0.36) | benign(0.076) | TCGA-AA-3864-01 | Colorectum | colon adenocarcinoma | Male | >=65 | I/II | Unknown | Unknown | SD | |
| SDSL | SNV | Missense_Mutation | c.801N>A | p.Asp267Glu | p.D267E | Q96GA7 | protein_coding | tolerated(0.11) | benign(0.067) | TCGA-AA-3875-01 | Colorectum | colon adenocarcinoma | Female | >=65 | I/II | Unknown | Unknown | SD | |
| SDSL | SNV | Missense_Mutation | c.893N>A | p.Pro298His | p.P298H | Q96GA7 | protein_coding | tolerated(0.16) | benign(0.026) | TCGA-AA-A022-01 | Colorectum | colon adenocarcinoma | Female | >=65 | I/II | Unknown | Unknown | SD | |
| SDSL | SNV | Missense_Mutation | c.910G>T | p.Val304Phe | p.V304F | Q96GA7 | protein_coding | deleterious(0) | probably_damaging(0.95) | TCGA-AZ-6599-01 | Colorectum | colon adenocarcinoma | Male | >=65 | I/II | Unknown | Unknown | SD | |
| SDSL | SNV | Missense_Mutation | rs777320814 | c.418C>T | p.Pro140Ser | p.P140S | Q96GA7 | protein_coding | tolerated(1) | benign(0.031) | TCGA-CK-4951-01 | Colorectum | colon adenocarcinoma | Female | >=65 | I/II | Unknown | Unknown | PD |
| SDSL | SNV | Missense_Mutation | c.407N>T | p.Trp136Leu | p.W136L | Q96GA7 | protein_coding | tolerated(0.23) | benign(0.065) | TCGA-CM-6680-01 | Colorectum | colon adenocarcinoma | Female | >=65 | III/IV | Unknown | Unknown | SD |
| Page: 1 2 3 4 |
Top |
Related drugs of malignant transformation related genes |
| Identification of chemicals and drugs interact with genes involved in malignant transfromation |
| (DGIdb 4.0) |
| Entrez ID | Symbol | Category | Interaction Types | Drug Claim Name | Drug Name | PMIDs |
| Page: 1 |

Copyright 2023-Present -The University of Texas Health Science Center at Houston |