
|
|||||
|
 | |
| |
| |
| |
| |
| |
|
Gene: SCNM1 |
Gene summary for SCNM1 |
| Gene information | Species | Human | Gene symbol | SCNM1 | Gene ID | 79005 |
| Gene name | sodium channel modifier 1 | |
| Gene Alias | SCNM1 | |
| Cytomap | 1q21.3 | |
| Gene Type | protein-coding | GO ID | GO:0000375 | UniProtAcc | Q9BWG6 |
Top |
Malignant transformation analysis |
| Identification of the aberrant gene expression in precancerous and cancerous lesions by comparing the gene expression of stem-like cells in diseased tissues with normal stem cells |
| Entrez ID | Symbol | Replicates | Species | Organ | Tissue | Adj P-value | Log2FC | Malignancy |
| 79005 | SCNM1 | LZE2T | Human | Esophagus | ESCC | 3.51e-05 | 9.35e-01 | 0.082 |
| 79005 | SCNM1 | LZE4T | Human | Esophagus | ESCC | 6.30e-16 | 3.92e-01 | 0.0811 |
| 79005 | SCNM1 | LZE7T | Human | Esophagus | ESCC | 6.56e-15 | 9.43e-01 | 0.0667 |
| 79005 | SCNM1 | LZE8T | Human | Esophagus | ESCC | 1.39e-09 | 1.88e-01 | 0.067 |
| 79005 | SCNM1 | LZE20T | Human | Esophagus | ESCC | 3.49e-13 | 4.19e-01 | 0.0662 |
| 79005 | SCNM1 | LZE22D1 | Human | Esophagus | HGIN | 7.00e-05 | 1.75e-01 | 0.0595 |
| 79005 | SCNM1 | LZE22T | Human | Esophagus | ESCC | 1.52e-08 | 7.95e-01 | 0.068 |
| 79005 | SCNM1 | LZE24T | Human | Esophagus | ESCC | 1.10e-24 | 7.03e-01 | 0.0596 |
| 79005 | SCNM1 | LZE21T | Human | Esophagus | ESCC | 7.30e-04 | 4.68e-01 | 0.0655 |
| 79005 | SCNM1 | LZE6T | Human | Esophagus | ESCC | 6.70e-09 | 5.17e-01 | 0.0845 |
| 79005 | SCNM1 | P1T-E | Human | Esophagus | ESCC | 3.11e-18 | 6.64e-01 | 0.0875 |
| 79005 | SCNM1 | P2T-E | Human | Esophagus | ESCC | 3.08e-33 | 7.13e-01 | 0.1177 |
| 79005 | SCNM1 | P4T-E | Human | Esophagus | ESCC | 1.05e-48 | 8.32e-01 | 0.1323 |
| 79005 | SCNM1 | P5T-E | Human | Esophagus | ESCC | 5.98e-43 | 8.43e-01 | 0.1327 |
| 79005 | SCNM1 | P8T-E | Human | Esophagus | ESCC | 4.04e-29 | 6.16e-01 | 0.0889 |
| 79005 | SCNM1 | P9T-E | Human | Esophagus | ESCC | 2.42e-38 | 9.13e-01 | 0.1131 |
| 79005 | SCNM1 | P10T-E | Human | Esophagus | ESCC | 3.01e-46 | 8.91e-01 | 0.116 |
| 79005 | SCNM1 | P11T-E | Human | Esophagus | ESCC | 7.50e-25 | 8.58e-01 | 0.1426 |
| 79005 | SCNM1 | P12T-E | Human | Esophagus | ESCC | 3.22e-28 | 5.89e-01 | 0.1122 |
| 79005 | SCNM1 | P15T-E | Human | Esophagus | ESCC | 2.97e-30 | 6.19e-01 | 0.1149 |
| Page: 1 2 3 4 5 6 |
| Tissue | Expression Dynamics | Abbreviation |
| Esophagus | 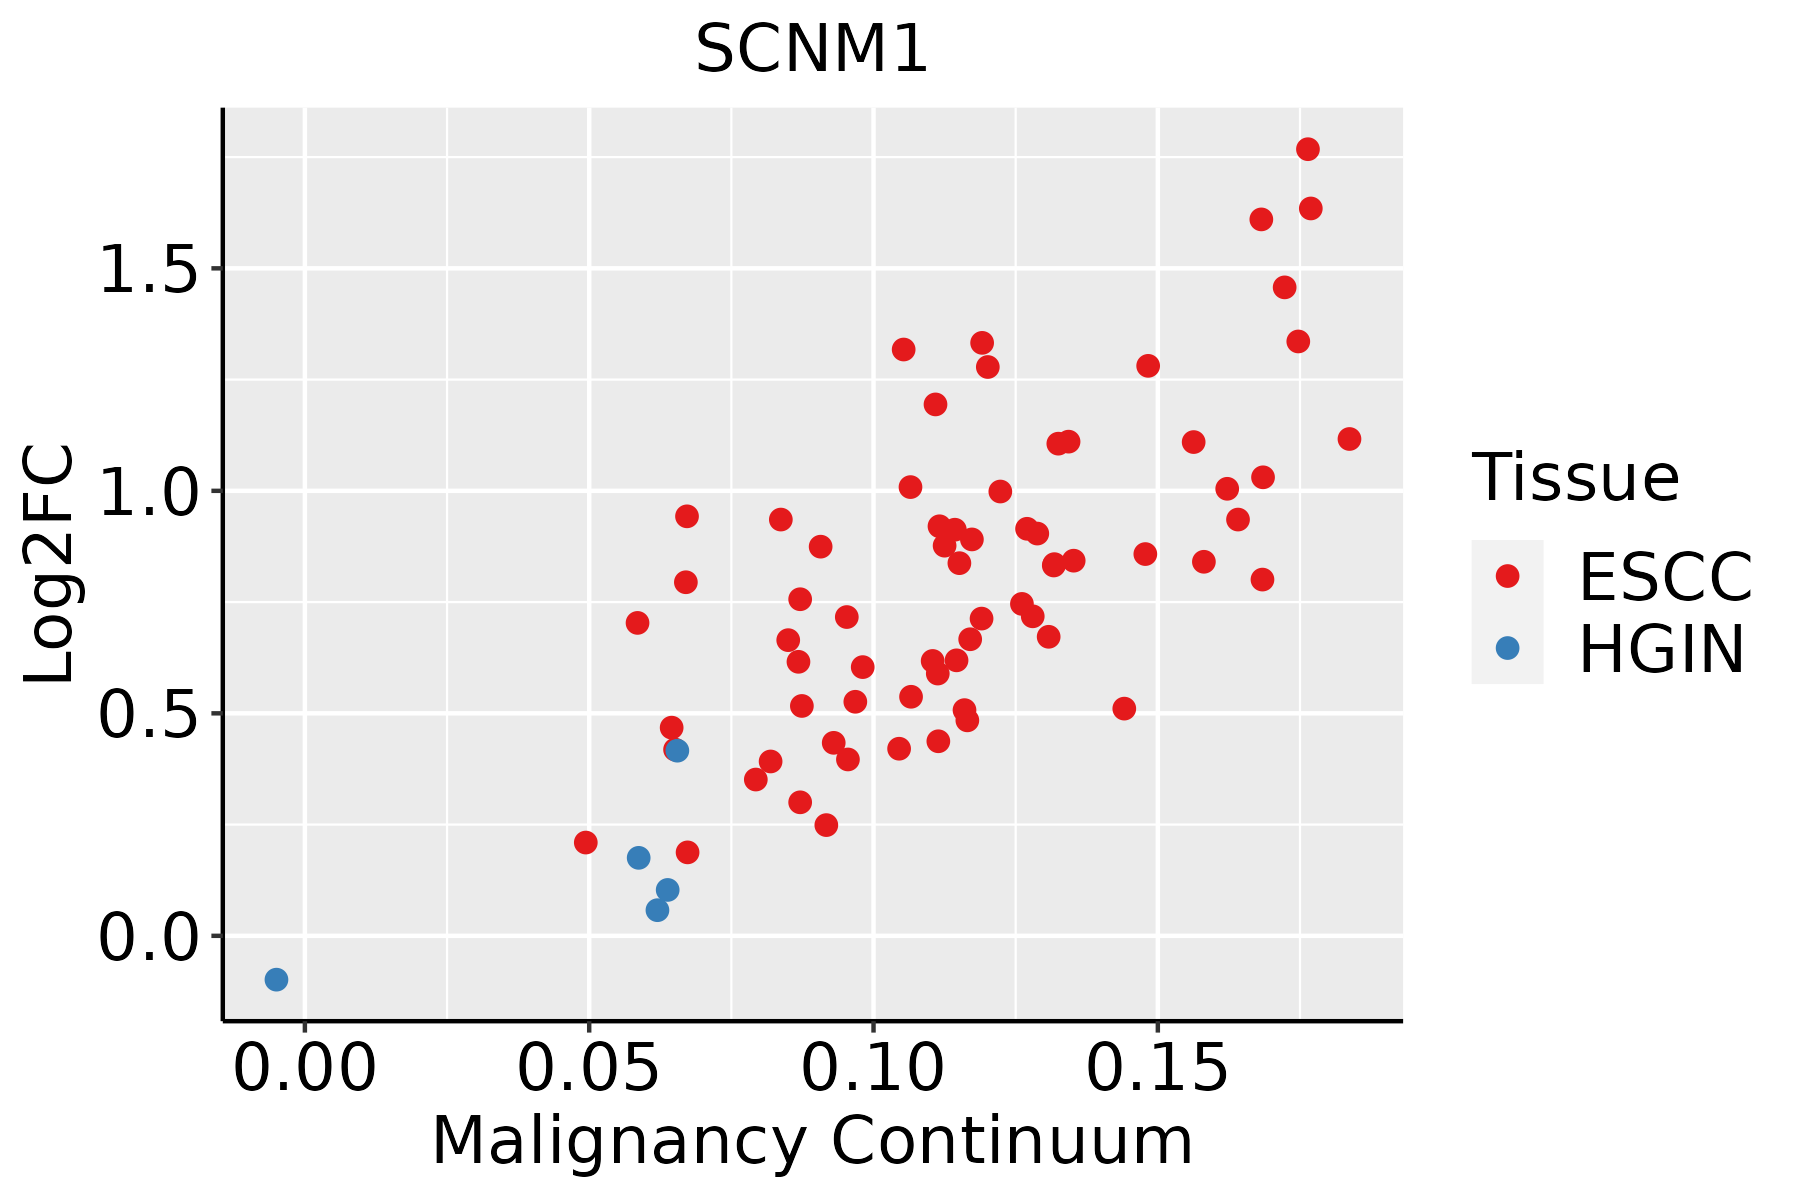 | ESCC: Esophageal squamous cell carcinoma |
| HGIN: High-grade intraepithelial neoplasias | ||
| LGIN: Low-grade intraepithelial neoplasias | ||
| Liver |  | HCC: Hepatocellular carcinoma |
| NAFLD: Non-alcoholic fatty liver disease | ||
| Oral Cavity |  | EOLP: Erosive Oral lichen planus |
| LP: leukoplakia | ||
| NEOLP: Non-erosive oral lichen planus | ||
| OSCC: Oral squamous cell carcinoma | ||
| Skin | 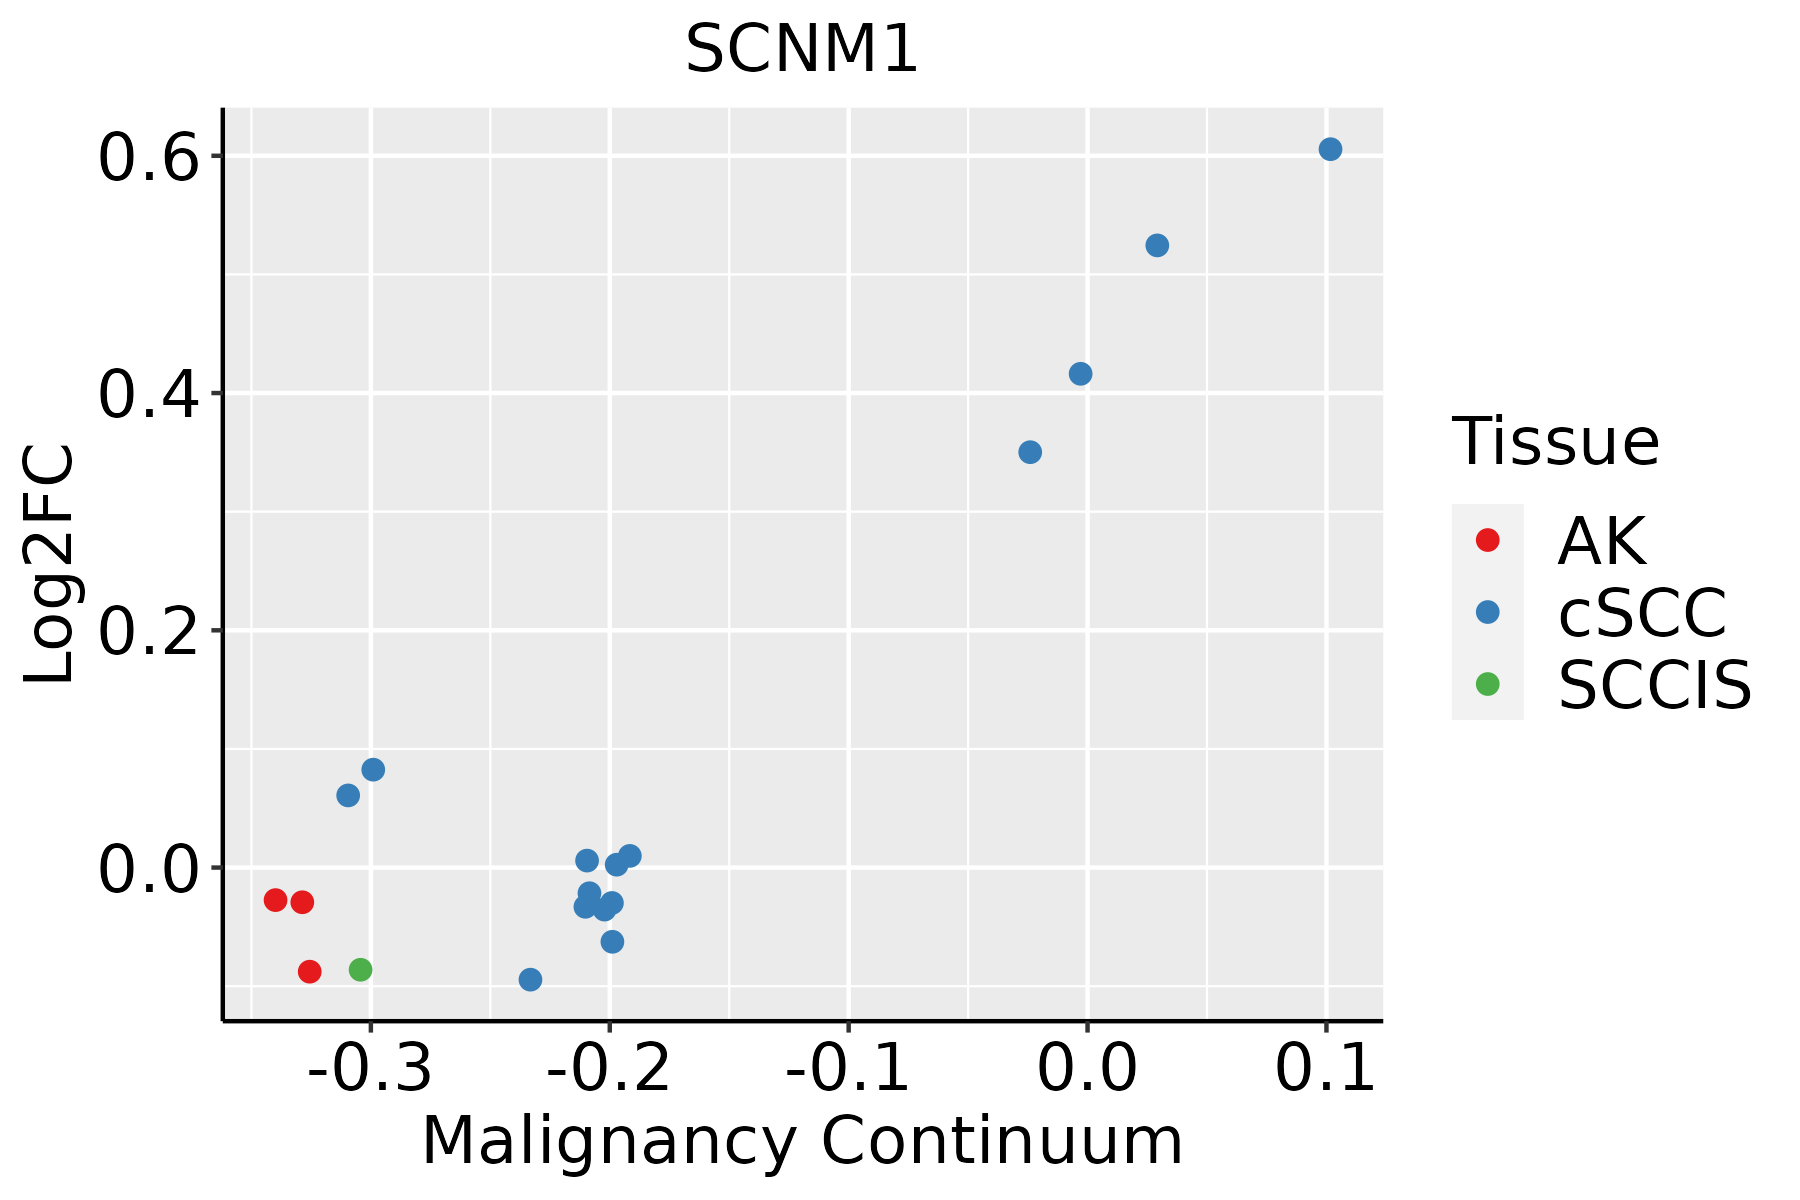 | AK: Actinic keratosis |
| cSCC: Cutaneous squamous cell carcinoma | ||
| SCCIS:squamous cell carcinoma in situ | ||
| Thyroid | 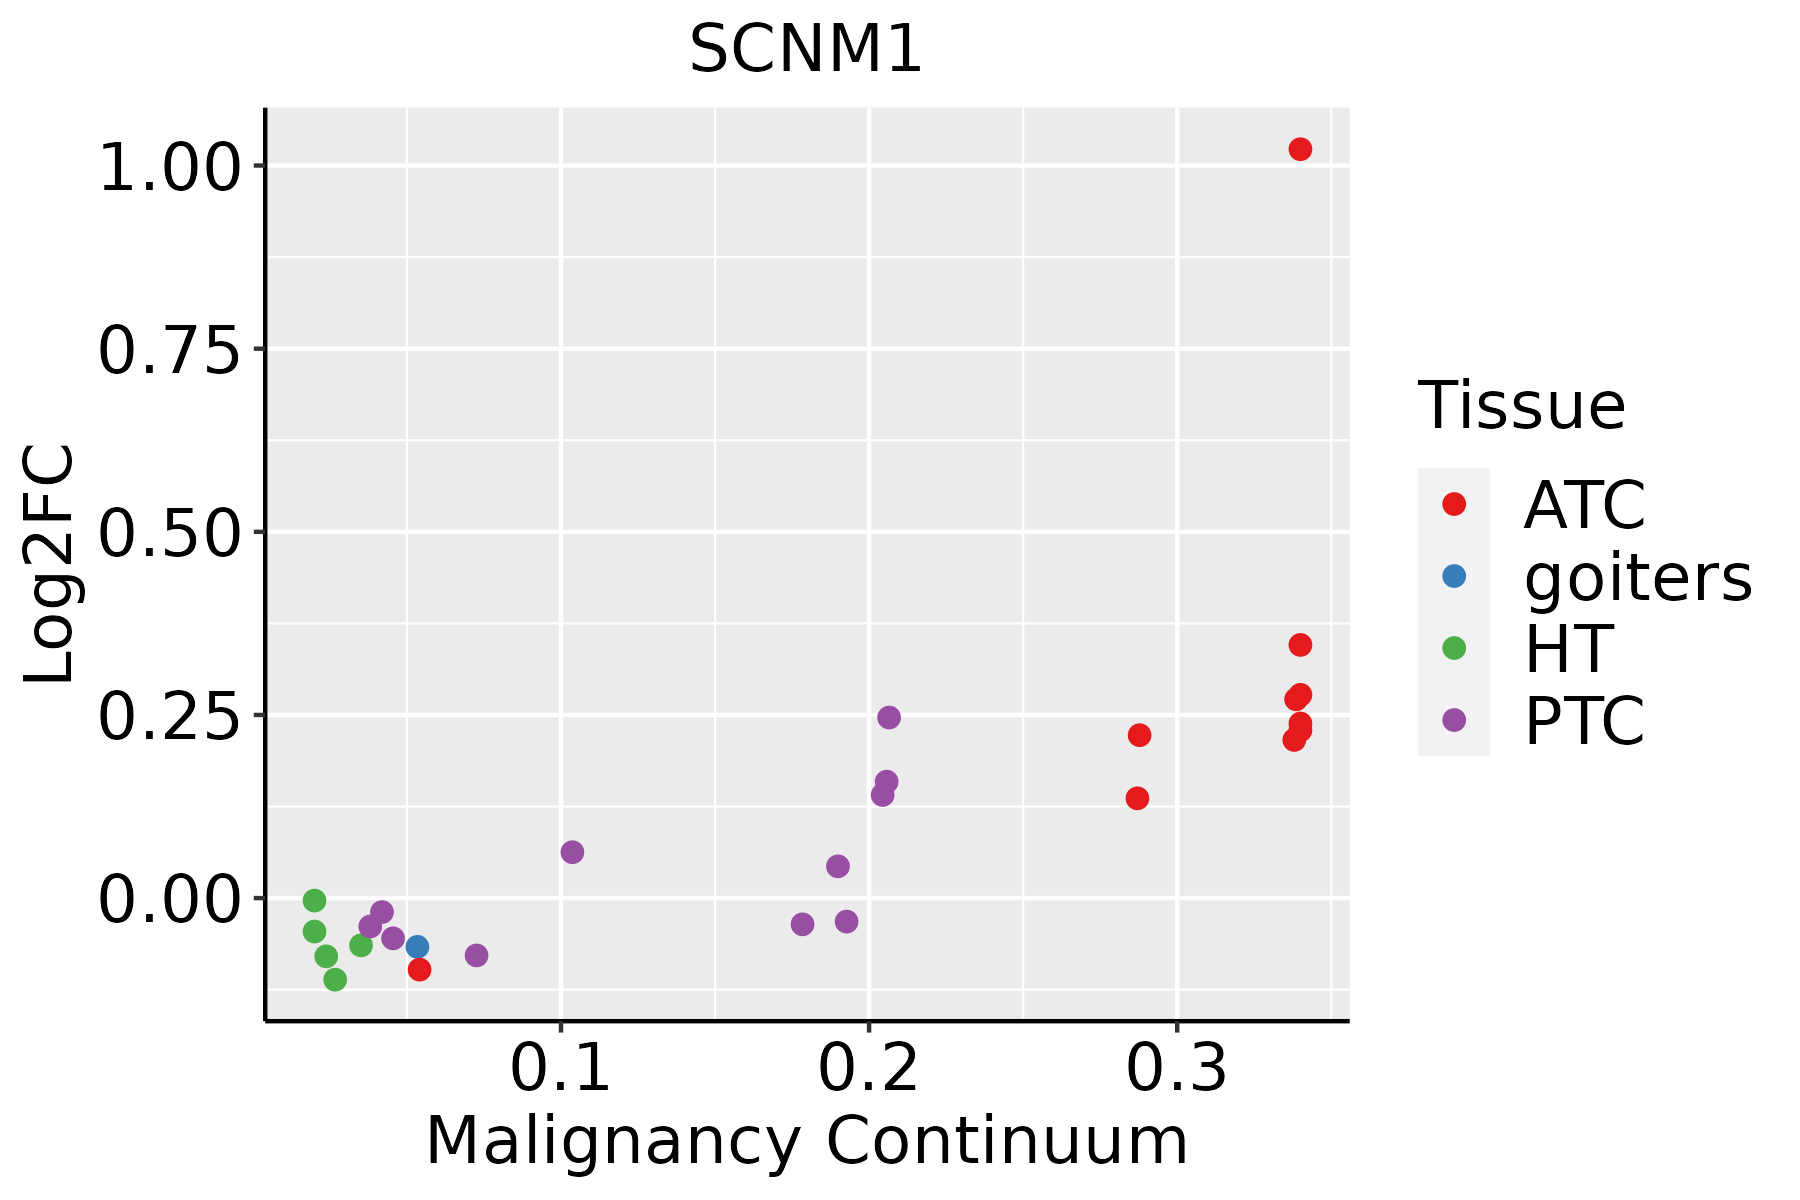 | ATC: Anaplastic thyroid cancer |
| HT: Hashimoto's thyroiditis | ||
| PTC: Papillary thyroid cancer |
| ∗log2FC in expression of this searched gene in stem-like cells from each diseased tissue sample relative to stem-like cells in normal samples in each tissue plotted against the malignancy continuum. Samples are colored based on if they are from different disease stage. |
Top |
Malignant transformation related pathway analysis |
| Find out the enriched GO biological processes and KEGG pathways involved in transition from healthy to precancer to cancer |
| Tissue | Disease Stage | Enriched GO biological Processes |
| Colorectum | AD |  |
| Colorectum | SER |  |
| Colorectum | MSS |  |
| Colorectum | MSI-H |  |
| Colorectum | FAP |  |
| ∗Top 15 enriched GO BP terms are showed in the bar plot of each disease state in each tissue. Each row represents a significant GO biological process which is colored according to the -log10(p.adjust). |
| Page: 1 2 3 4 5 6 7 8 9 |
| GO ID | Tissue | Disease Stage | Description | Gene Ratio | Bg Ratio | pvalue | p.adjust | Count |
| GO:000838020 | Oral cavity | OSCC | RNA splicing | 308/7305 | 434/18723 | 2.43e-42 | 7.70e-39 | 308 |
| GO:000037519 | Oral cavity | OSCC | RNA splicing, via transesterification reactions | 225/7305 | 324/18723 | 5.20e-29 | 2.99e-26 | 225 |
| GO:000037719 | Oral cavity | OSCC | RNA splicing, via transesterification reactions with bulged adenosine as nucleophile | 221/7305 | 320/18723 | 5.50e-28 | 2.18e-25 | 221 |
| GO:000039819 | Oral cavity | OSCC | mRNA splicing, via spliceosome | 221/7305 | 320/18723 | 5.50e-28 | 2.18e-25 | 221 |
| GO:000038016 | Oral cavity | OSCC | alternative mRNA splicing, via spliceosome | 51/7305 | 77/18723 | 1.19e-06 | 1.59e-05 | 51 |
| GO:0008380110 | Oral cavity | LP | RNA splicing | 237/4623 | 434/18723 | 1.82e-41 | 3.79e-38 | 237 |
| GO:0000375110 | Oral cavity | LP | RNA splicing, via transesterification reactions | 181/4623 | 324/18723 | 1.36e-33 | 1.70e-30 | 181 |
| GO:0000377110 | Oral cavity | LP | RNA splicing, via transesterification reactions with bulged adenosine as nucleophile | 179/4623 | 320/18723 | 2.48e-33 | 2.22e-30 | 179 |
| GO:0000398110 | Oral cavity | LP | mRNA splicing, via spliceosome | 179/4623 | 320/18723 | 2.48e-33 | 2.22e-30 | 179 |
| GO:000038017 | Oral cavity | LP | alternative mRNA splicing, via spliceosome | 38/4623 | 77/18723 | 2.47e-06 | 5.43e-05 | 38 |
| GO:0008380112 | Skin | cSCC | RNA splicing | 263/4864 | 434/18723 | 2.45e-53 | 5.13e-50 | 263 |
| GO:0000375112 | Skin | cSCC | RNA splicing, via transesterification reactions | 201/4864 | 324/18723 | 4.07e-43 | 5.10e-40 | 201 |
| GO:0000377112 | Skin | cSCC | RNA splicing, via transesterification reactions with bulged adenosine as nucleophile | 197/4864 | 320/18723 | 1.45e-41 | 1.14e-38 | 197 |
| GO:0000398112 | Skin | cSCC | mRNA splicing, via spliceosome | 197/4864 | 320/18723 | 1.45e-41 | 1.14e-38 | 197 |
| GO:0000380110 | Skin | cSCC | alternative mRNA splicing, via spliceosome | 47/4864 | 77/18723 | 9.03e-11 | 4.04e-09 | 47 |
| GO:0008380113 | Thyroid | PTC | RNA splicing | 273/5968 | 434/18723 | 4.44e-41 | 1.40e-37 | 273 |
| GO:0000375113 | Thyroid | PTC | RNA splicing, via transesterification reactions | 202/5968 | 324/18723 | 6.81e-30 | 3.91e-27 | 202 |
| GO:0000377113 | Thyroid | PTC | RNA splicing, via transesterification reactions with bulged adenosine as nucleophile | 199/5968 | 320/18723 | 2.96e-29 | 1.44e-26 | 199 |
| GO:0000398113 | Thyroid | PTC | mRNA splicing, via spliceosome | 199/5968 | 320/18723 | 2.96e-29 | 1.44e-26 | 199 |
| GO:0000380111 | Thyroid | PTC | alternative mRNA splicing, via spliceosome | 51/5968 | 77/18723 | 6.09e-10 | 1.92e-08 | 51 |
| Page: 1 2 3 |
| Pathway ID | Tissue | Disease Stage | Description | Gene Ratio | Bg Ratio | pvalue | p.adjust | qvalue | Count |
| Page: 1 |
Top |
Cell-cell communication analysis |
| Identification of potential cell-cell interactions between two cell types and their ligand-receptor pairs for different disease states |
| Ligand | Receptor | LRpair | Pathway | Tissue | Disease Stage |
| Page: 1 |
Top |
Single-cell gene regulatory network inference analysis |
| Find out the significant the regulons (TFs) and the target genes of each regulon across cell types for different disease states |
| TF | Cell Type | Tissue | Disease Stage | Target Gene | RSS | Regulon Activity |
| ∗The dot plots of a searched regulon are shown for all cell subpopulations in each disease state of each tissue based on the regulon specific score inferred using pySCENIC and by calculating the average expression. |
| Page: 1 |
Top |
Somatic mutation of malignant transformation related genes |
| Annotation of somatic variants for genes involved in malignant transformation |
| Hugo Symbol | Variant Class | Variant Classification | dbSNP RS | HGVSc | HGVSp | HGVSp Short | SWISSPROT | BIOTYPE | SIFT | PolyPhen | Tumor Sample Barcode | Tissue | Histology | Sex | Age | Stage | Therapy Types | Drugs | Outcome |
| SCNM1 | SNV | Missense_Mutation | c.16G>A | p.Glu6Lys | p.E6K | Q9BWG6 | protein_coding | deleterious(0.01) | probably_damaging(0.997) | TCGA-A8-A09X-01 | Breast | breast invasive carcinoma | Female | <65 | III/IV | Unknown | Unknown | SD | |
| SCNM1 | SNV | Missense_Mutation | rs780575915 | c.112N>T | p.Arg38Trp | p.R38W | Q9BWG6 | protein_coding | deleterious(0) | probably_damaging(0.987) | TCGA-EW-A3E8-01 | Breast | breast invasive carcinoma | Female | <65 | I/II | Hormone Therapy | anastrozole | SD |
| SCNM1 | insertion | Frame_Shift_Ins | novel | c.362_363insCTTGCTACGGTGGCCTGGAGGAGTGGCGAAACCGGAACAGAGAATT | p.Pro122LeufsTer19 | p.P122Lfs*19 | Q9BWG6 | protein_coding | TCGA-A8-A09Z-01 | Breast | breast invasive carcinoma | Female | >=65 | I/II | Unknown | Unknown | SD | ||
| SCNM1 | SNV | Missense_Mutation | novel | c.649N>C | p.Phe217Leu | p.F217L | Q9BWG6 | protein_coding | deleterious(0) | probably_damaging(0.994) | TCGA-AA-3877-01 | Colorectum | colon adenocarcinoma | Female | >=65 | I/II | Unknown | Unknown | SD |
| SCNM1 | SNV | Missense_Mutation | novel | c.263A>C | p.Asn88Thr | p.N88T | Q9BWG6 | protein_coding | tolerated(0.1) | benign(0.112) | TCGA-AA-A00N-01 | Colorectum | colon adenocarcinoma | Male | >=65 | I/II | Unknown | Unknown | PD |
| SCNM1 | SNV | Missense_Mutation | c.551N>A | p.Pro184His | p.P184H | Q9BWG6 | protein_coding | deleterious(0) | probably_damaging(0.967) | TCGA-D5-6930-01 | Colorectum | colon adenocarcinoma | Male | >=65 | I/II | Unknown | Unknown | SD | |
| SCNM1 | SNV | Missense_Mutation | novel | c.212G>A | p.Ser71Asn | p.S71N | Q9BWG6 | protein_coding | deleterious(0.04) | possibly_damaging(0.836) | TCGA-AP-A1E0-01 | Endometrium | uterine corpus endometrioid carcinoma | Female | <65 | III/IV | Chemotherapy | paclitaxel | SD |
| SCNM1 | SNV | Missense_Mutation | rs778971346 | c.494C>T | p.Ala165Val | p.A165V | Q9BWG6 | protein_coding | tolerated(0.34) | benign(0) | TCGA-AX-A1CE-01 | Endometrium | uterine corpus endometrioid carcinoma | Female | <65 | I/II | Unspecific | Paclitaxel | SD |
| SCNM1 | SNV | Missense_Mutation | c.214T>G | p.Leu72Val | p.L72V | Q9BWG6 | protein_coding | deleterious(0.01) | benign(0.147) | TCGA-B5-A11E-01 | Endometrium | uterine corpus endometrioid carcinoma | Female | <65 | I/II | Unknown | Unknown | SD | |
| SCNM1 | SNV | Missense_Mutation | novel | c.593N>T | p.Ser198Ile | p.S198I | Q9BWG6 | protein_coding | deleterious(0) | benign(0.01) | TCGA-BG-A220-01 | Endometrium | uterine corpus endometrioid carcinoma | Female | >=65 | I/II | Unknown | Unknown | SD |
| Page: 1 2 3 |
Top |
Related drugs of malignant transformation related genes |
| Identification of chemicals and drugs interact with genes involved in malignant transfromation |
| (DGIdb 4.0) |
| Entrez ID | Symbol | Category | Interaction Types | Drug Claim Name | Drug Name | PMIDs |
| Page: 1 |

Copyright 2023-Present -The University of Texas Health Science Center at Houston |