
|
|||||
|
 | |
| |
| |
| |
| |
| |
|
Gene: SCFD1 |
Gene summary for SCFD1 |
| Gene information | Species | Human | Gene symbol | SCFD1 | Gene ID | 23256 |
| Gene name | sec1 family domain containing 1 | |
| Gene Alias | C14orf163 | |
| Cytomap | 14q12 | |
| Gene Type | protein-coding | GO ID | GO:0000045 | UniProtAcc | Q8WVM8 |
Top |
Malignant transformation analysis |
| Identification of the aberrant gene expression in precancerous and cancerous lesions by comparing the gene expression of stem-like cells in diseased tissues with normal stem cells |
| Entrez ID | Symbol | Replicates | Species | Organ | Tissue | Adj P-value | Log2FC | Malignancy |
| 23256 | SCFD1 | CCI_1 | Human | Cervix | CC | 1.95e-03 | 6.29e-01 | 0.528 |
| 23256 | SCFD1 | CCI_2 | Human | Cervix | CC | 7.89e-06 | 9.42e-01 | 0.5249 |
| 23256 | SCFD1 | CCI_3 | Human | Cervix | CC | 2.97e-03 | 6.03e-01 | 0.516 |
| 23256 | SCFD1 | LZE2T | Human | Esophagus | ESCC | 1.59e-03 | 3.31e-01 | 0.082 |
| 23256 | SCFD1 | LZE4T | Human | Esophagus | ESCC | 7.77e-17 | 3.80e-01 | 0.0811 |
| 23256 | SCFD1 | LZE5T | Human | Esophagus | ESCC | 1.02e-07 | 5.18e-01 | 0.0514 |
| 23256 | SCFD1 | LZE7T | Human | Esophagus | ESCC | 3.32e-03 | 1.14e-01 | 0.0667 |
| 23256 | SCFD1 | LZE8T | Human | Esophagus | ESCC | 3.04e-08 | 5.49e-02 | 0.067 |
| 23256 | SCFD1 | LZE20T | Human | Esophagus | ESCC | 2.80e-06 | 1.37e-01 | 0.0662 |
| 23256 | SCFD1 | LZE22D1 | Human | Esophagus | HGIN | 2.22e-02 | 2.82e-02 | 0.0595 |
| 23256 | SCFD1 | LZE22T | Human | Esophagus | ESCC | 3.46e-05 | 5.18e-01 | 0.068 |
| 23256 | SCFD1 | LZE24T | Human | Esophagus | ESCC | 1.34e-12 | 2.92e-01 | 0.0596 |
| 23256 | SCFD1 | P1T-E | Human | Esophagus | ESCC | 1.51e-02 | 2.30e-01 | 0.0875 |
| 23256 | SCFD1 | P2T-E | Human | Esophagus | ESCC | 8.15e-22 | 3.58e-01 | 0.1177 |
| 23256 | SCFD1 | P4T-E | Human | Esophagus | ESCC | 4.40e-27 | 5.47e-01 | 0.1323 |
| 23256 | SCFD1 | P5T-E | Human | Esophagus | ESCC | 1.58e-23 | 5.24e-01 | 0.1327 |
| 23256 | SCFD1 | P8T-E | Human | Esophagus | ESCC | 2.46e-48 | 8.31e-01 | 0.0889 |
| 23256 | SCFD1 | P9T-E | Human | Esophagus | ESCC | 2.06e-10 | 1.98e-01 | 0.1131 |
| 23256 | SCFD1 | P10T-E | Human | Esophagus | ESCC | 1.00e-27 | 4.38e-01 | 0.116 |
| 23256 | SCFD1 | P11T-E | Human | Esophagus | ESCC | 6.04e-11 | 4.62e-01 | 0.1426 |
| Page: 1 2 3 4 5 6 7 |
| Tissue | Expression Dynamics | Abbreviation |
| Cervix | 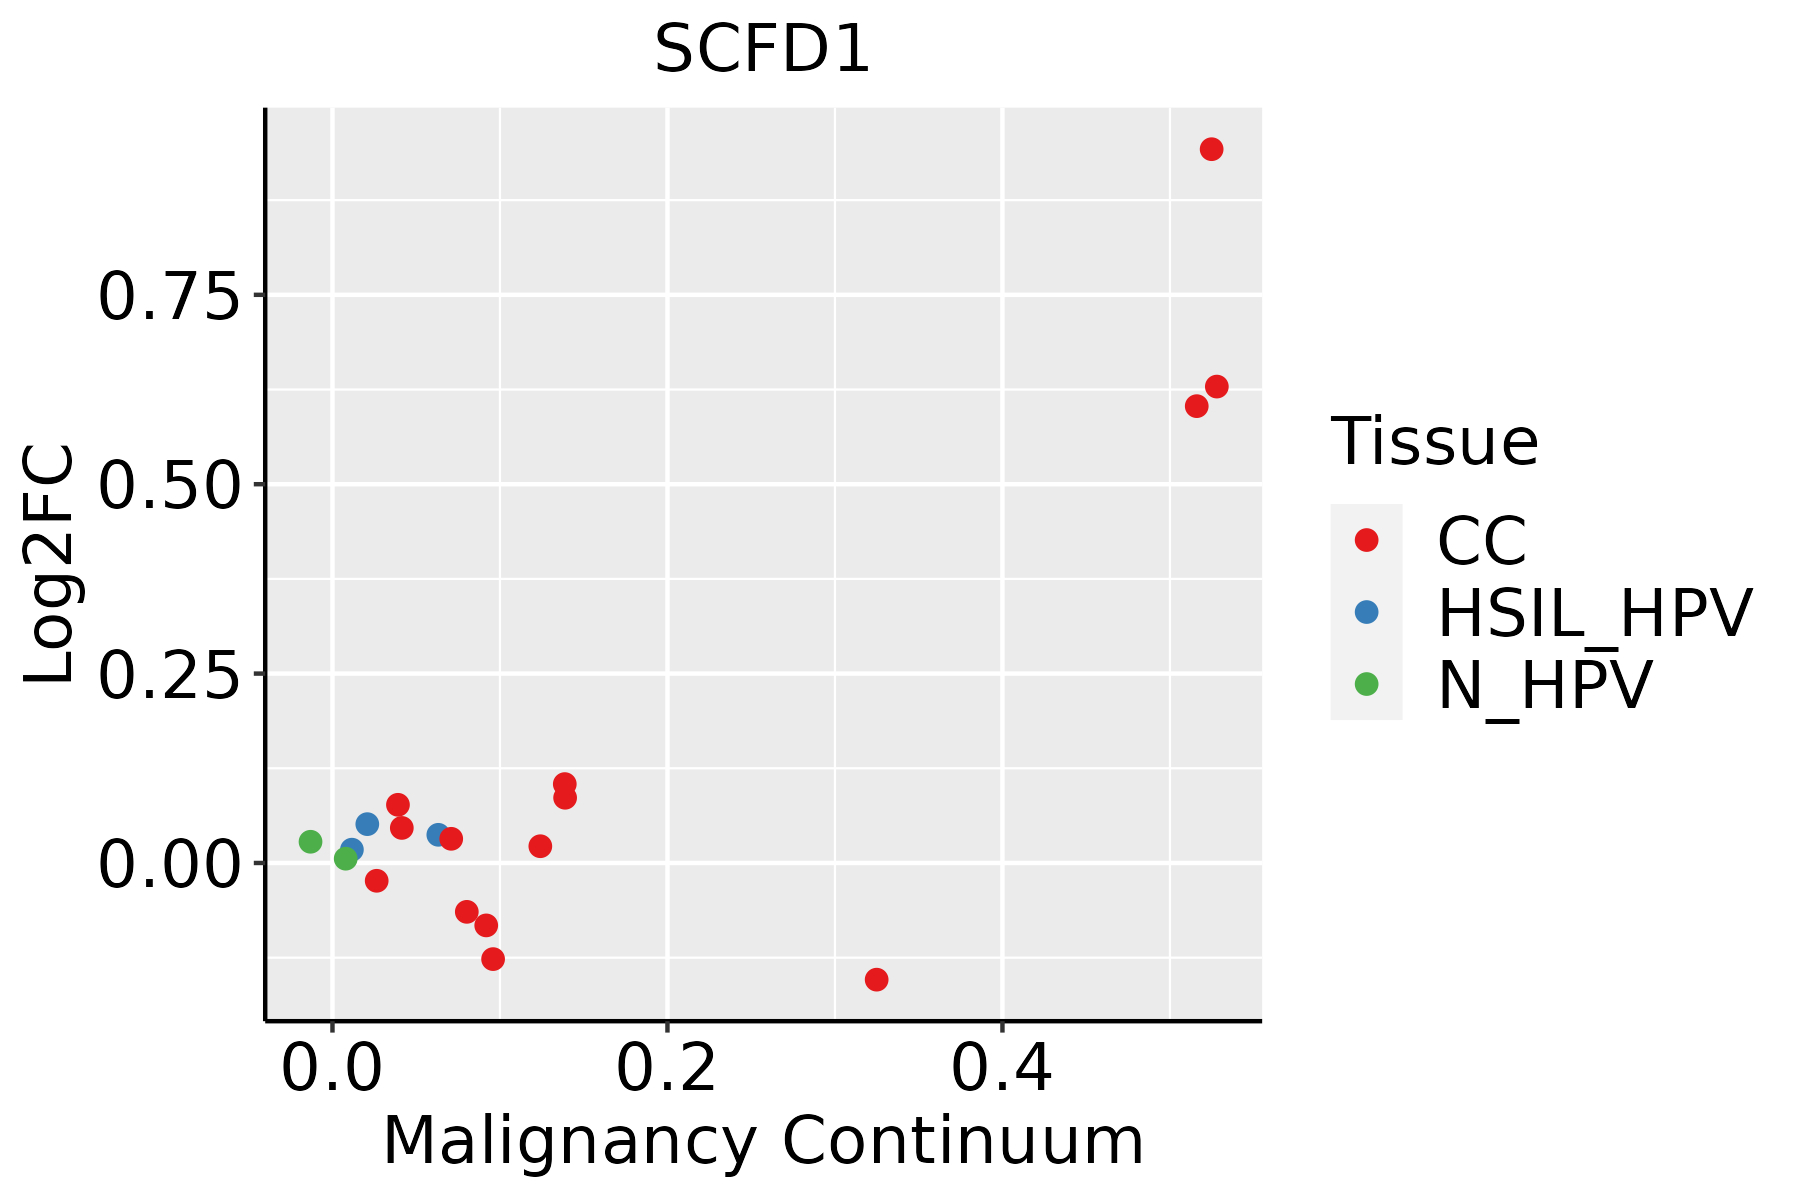 | CC: Cervix cancer |
| HSIL_HPV: HPV-infected high-grade squamous intraepithelial lesions | ||
| N_HPV: HPV-infected normal cervix | ||
| Esophagus |  | ESCC: Esophageal squamous cell carcinoma |
| HGIN: High-grade intraepithelial neoplasias | ||
| LGIN: Low-grade intraepithelial neoplasias | ||
| Lung | 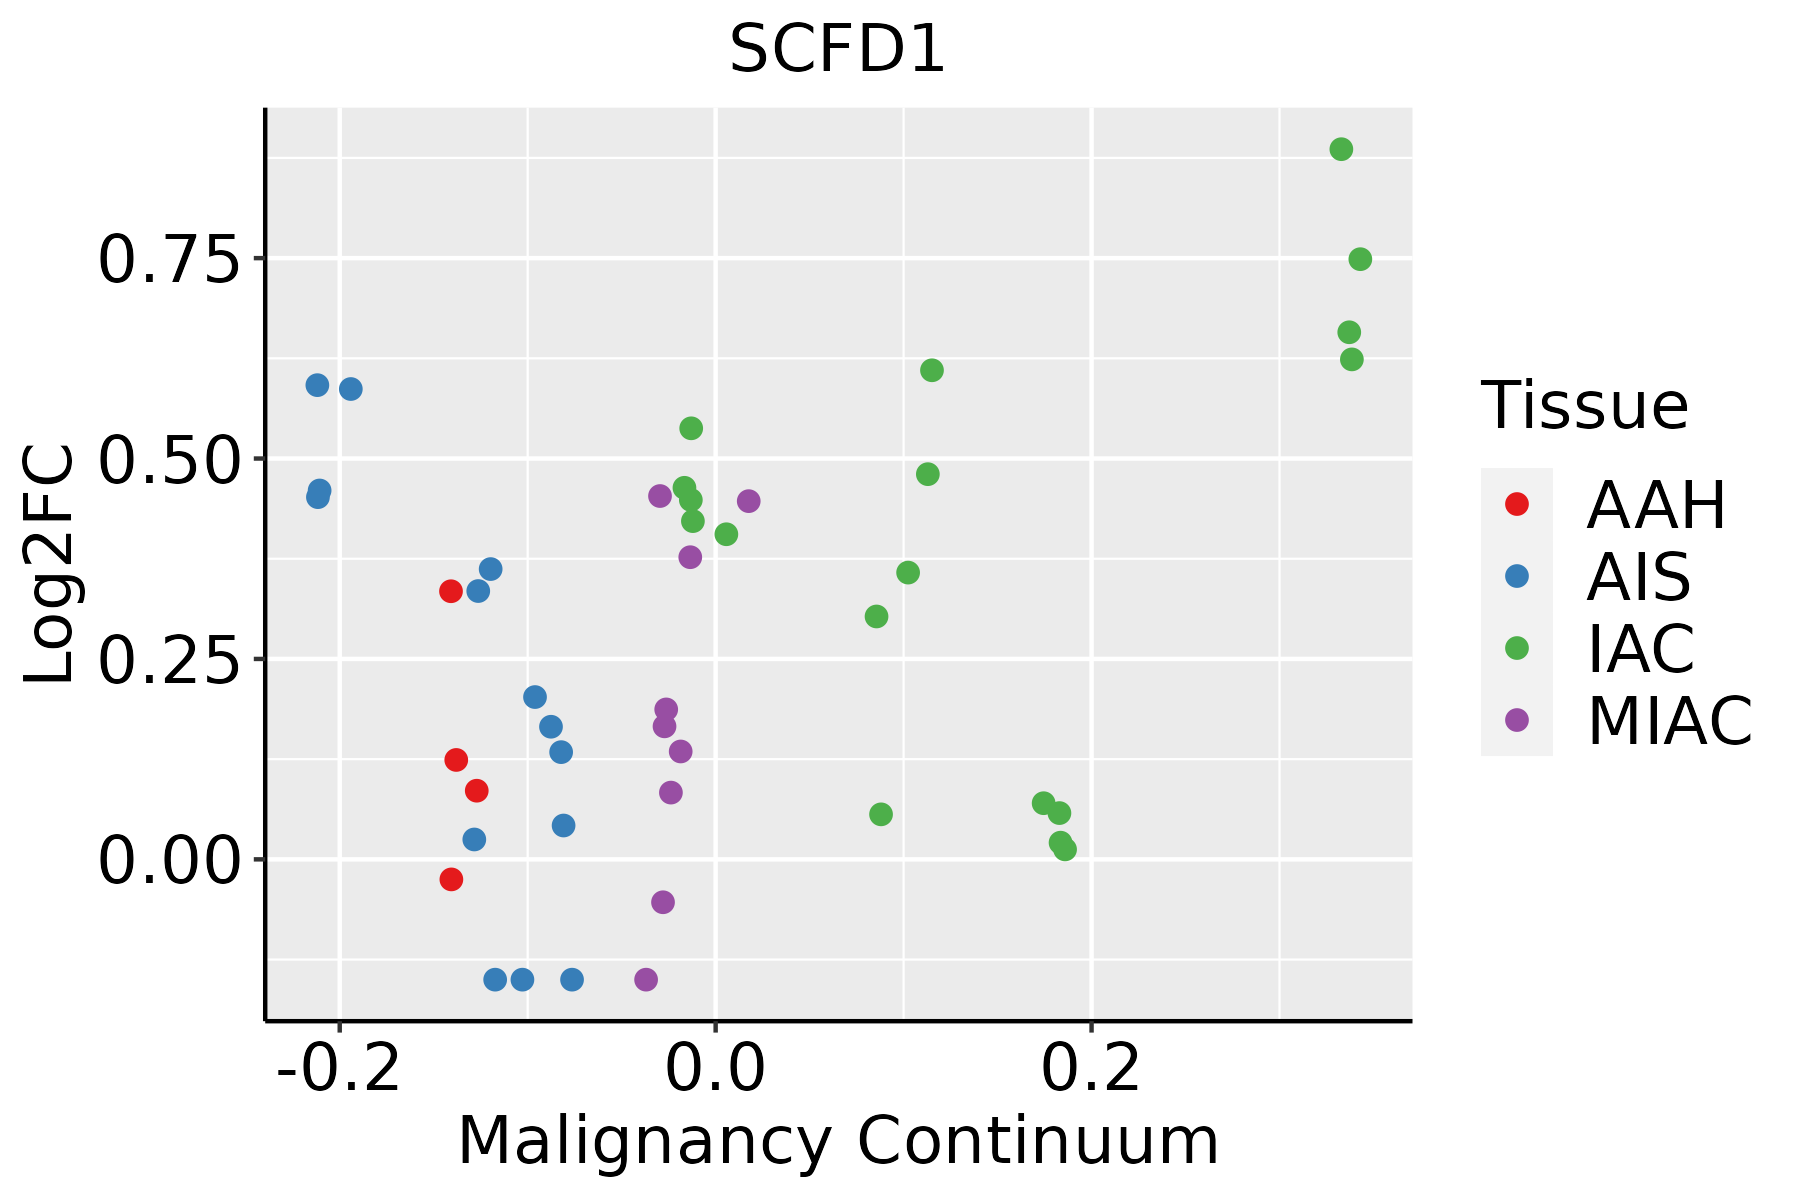 | AAH: Atypical adenomatous hyperplasia |
| AIS: Adenocarcinoma in situ | ||
| IAC: Invasive lung adenocarcinoma | ||
| MIA: Minimally invasive adenocarcinoma | ||
| Oral Cavity | 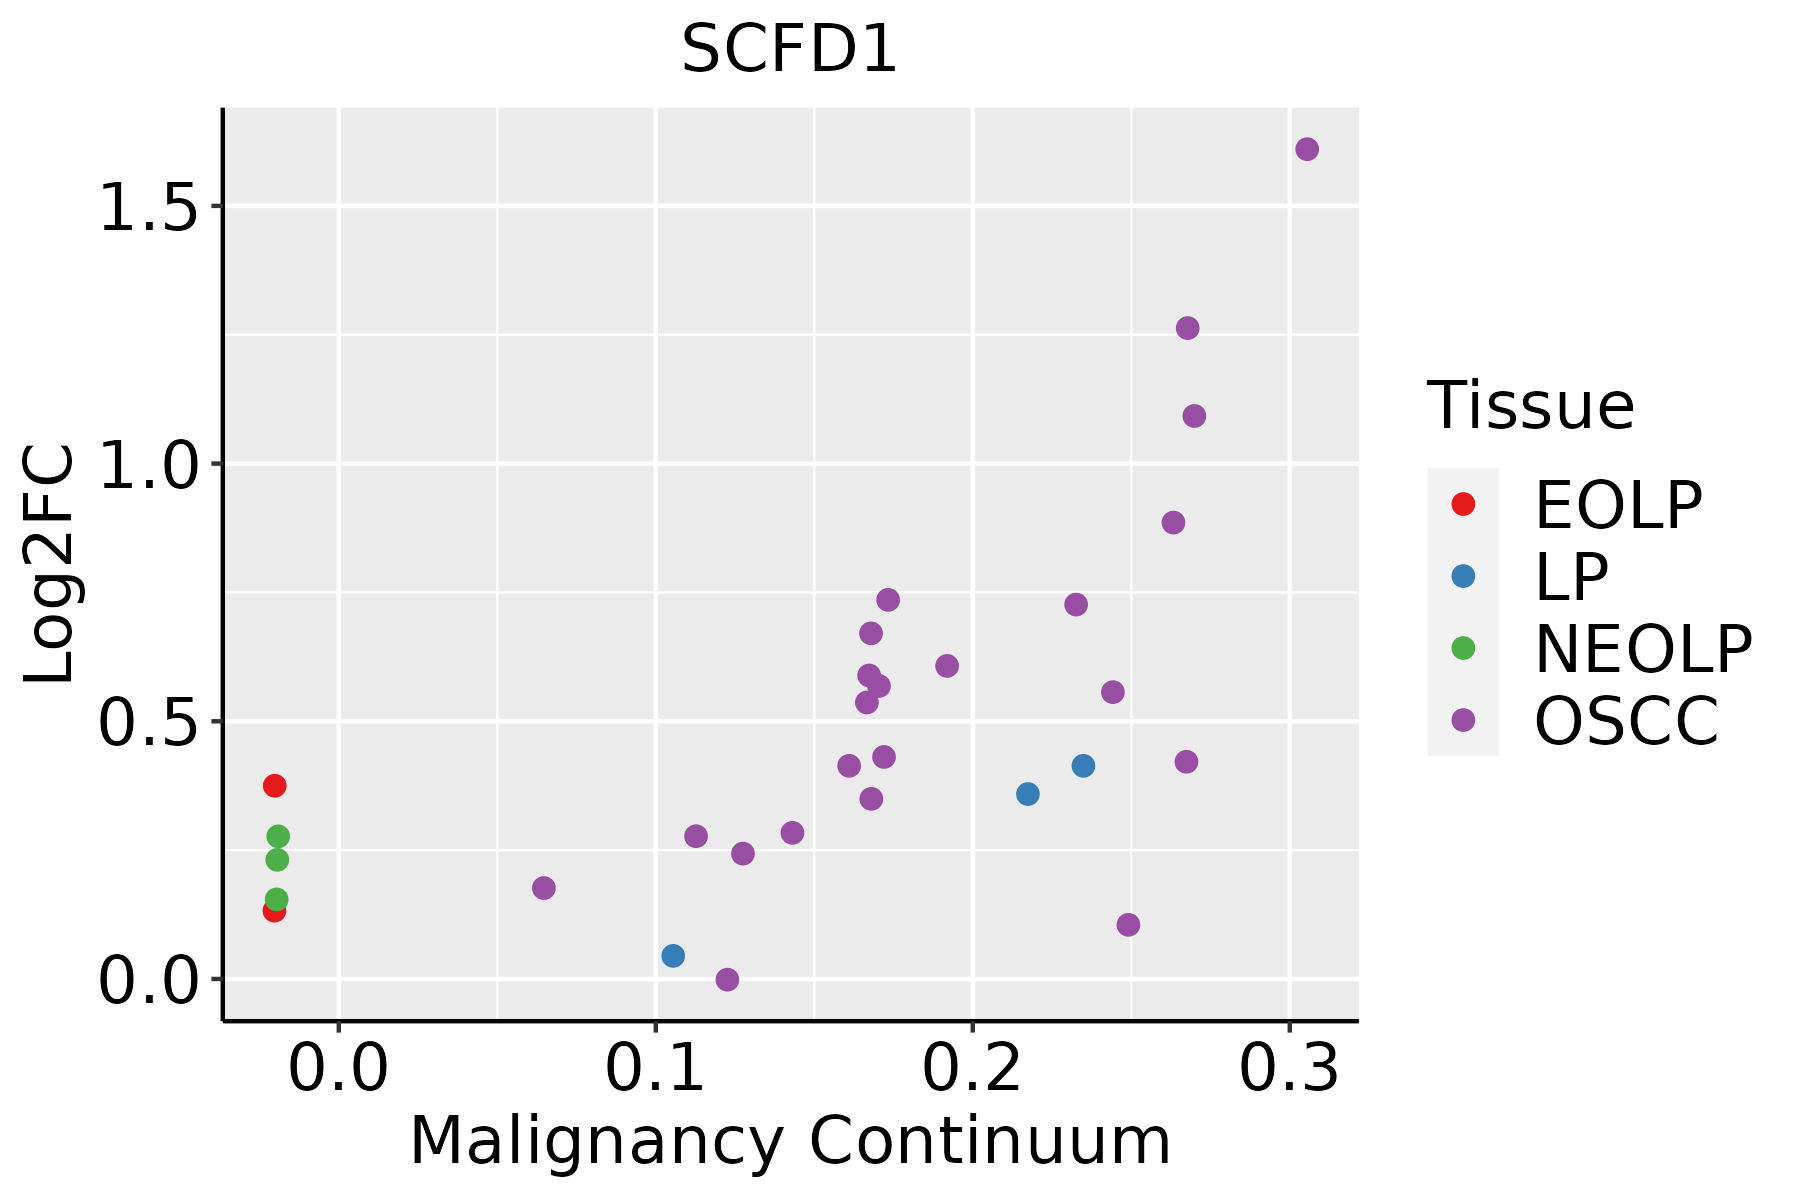 | EOLP: Erosive Oral lichen planus |
| LP: leukoplakia | ||
| NEOLP: Non-erosive oral lichen planus | ||
| OSCC: Oral squamous cell carcinoma | ||
| Skin | 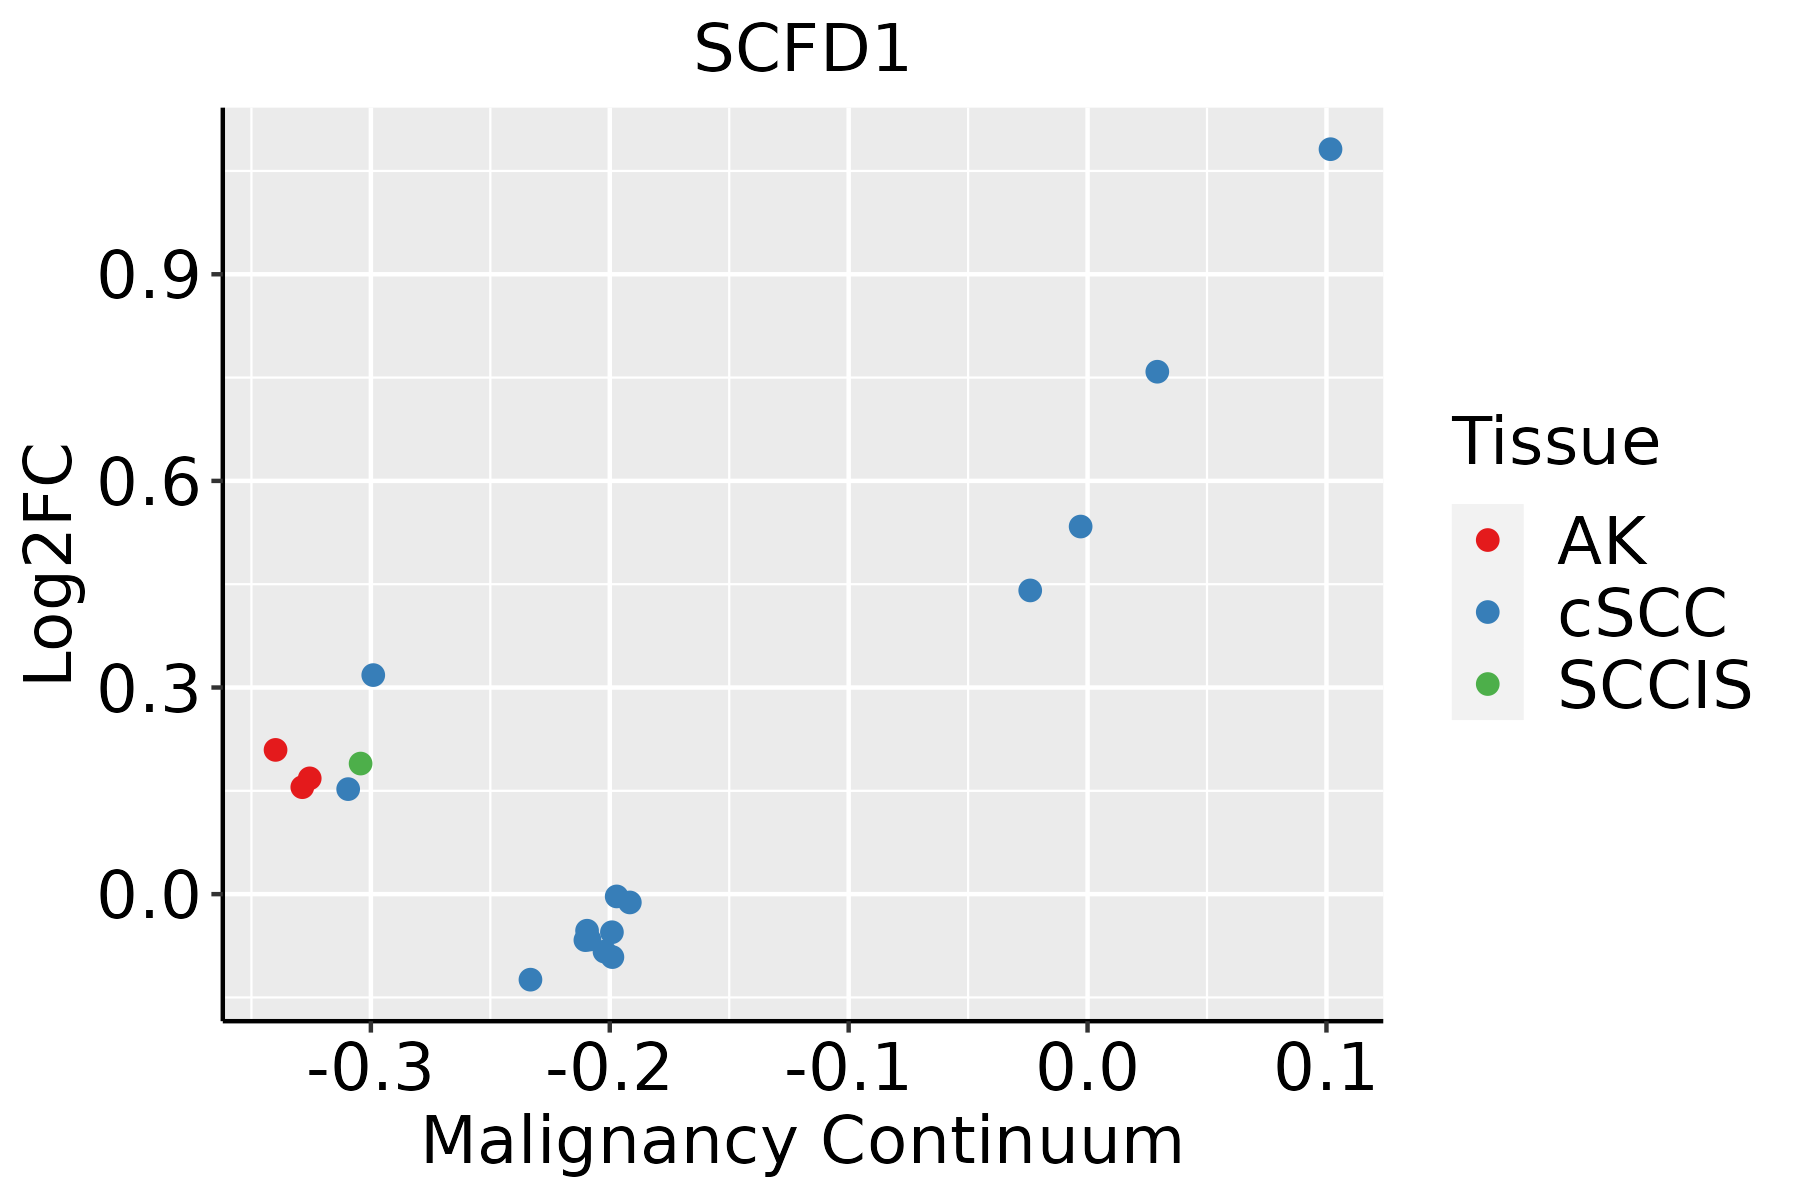 | AK: Actinic keratosis |
| cSCC: Cutaneous squamous cell carcinoma | ||
| SCCIS:squamous cell carcinoma in situ | ||
| Thyroid | 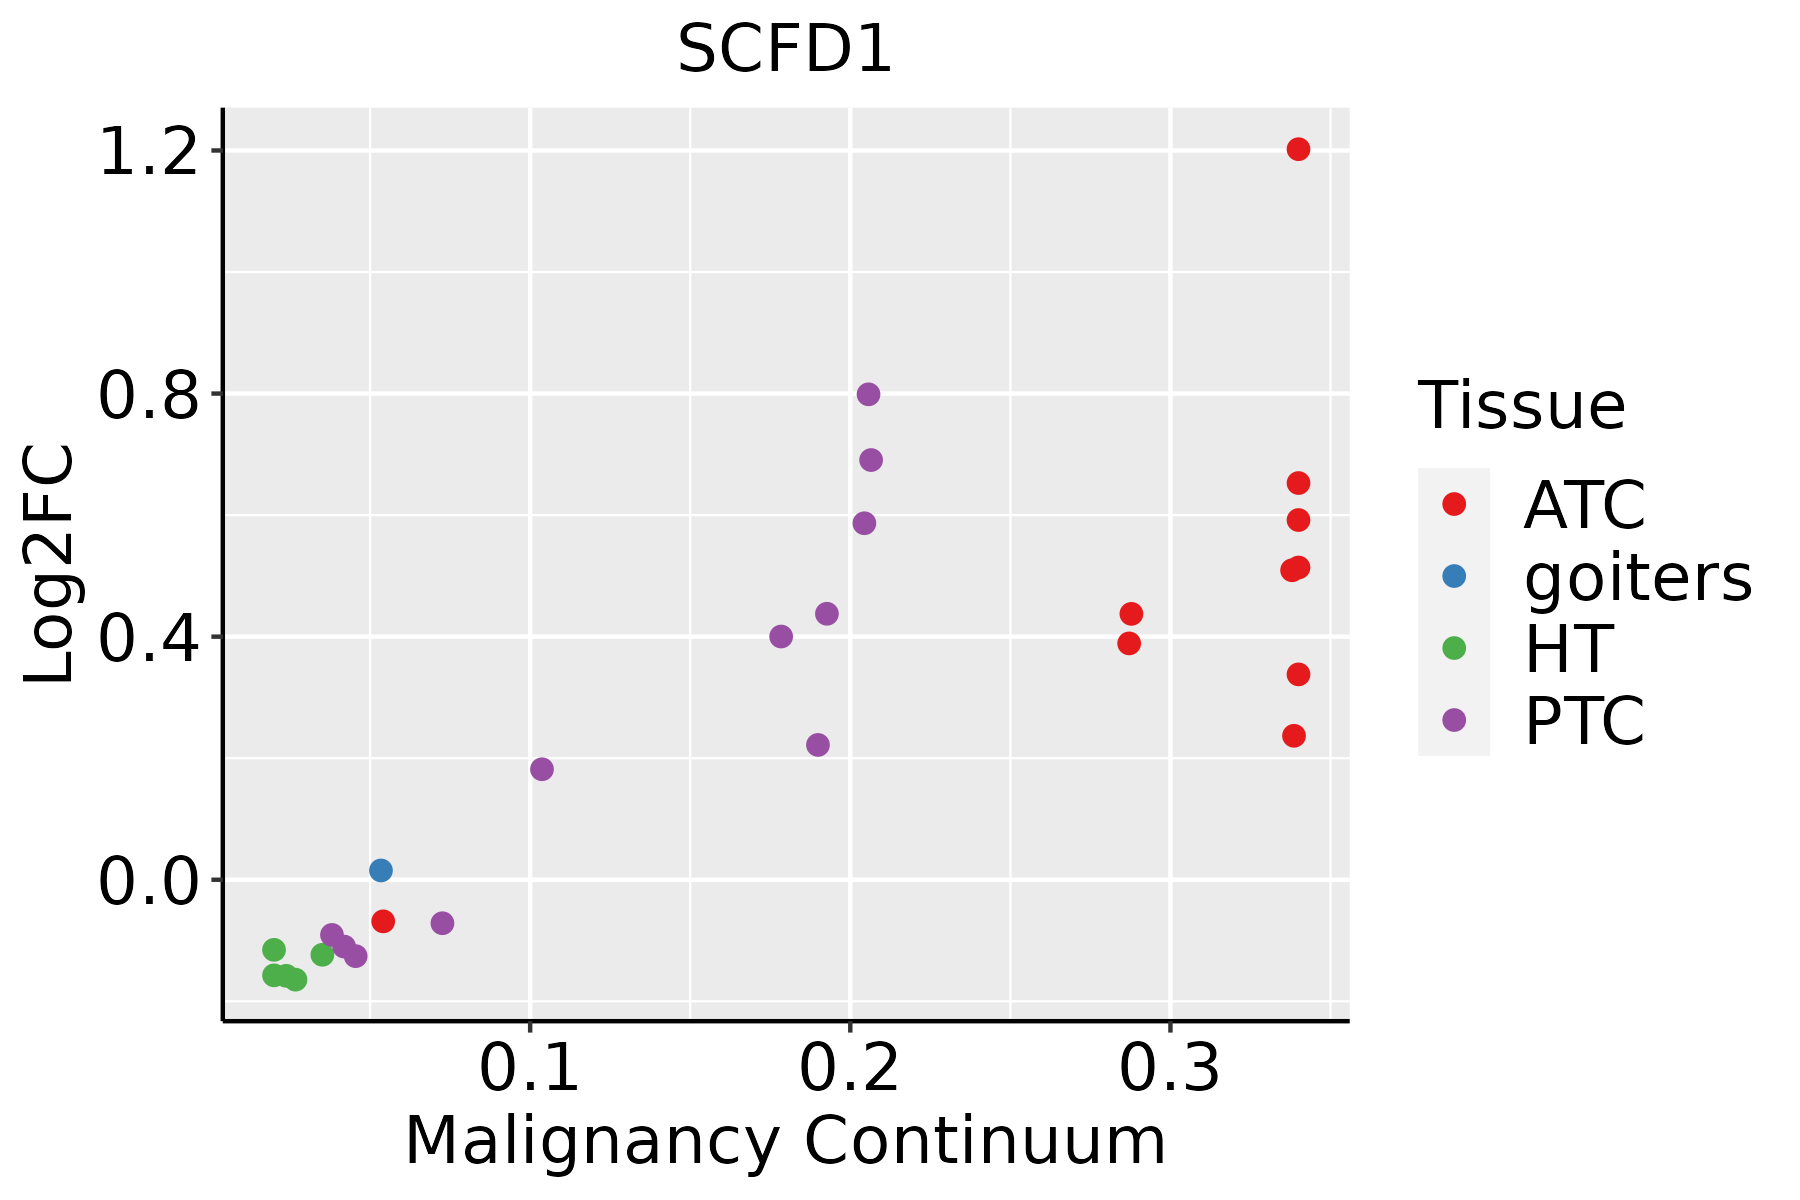 | ATC: Anaplastic thyroid cancer |
| HT: Hashimoto's thyroiditis | ||
| PTC: Papillary thyroid cancer |
| ∗log2FC in expression of this searched gene in stem-like cells from each diseased tissue sample relative to stem-like cells in normal samples in each tissue plotted against the malignancy continuum. Samples are colored based on if they are from different disease stage. |
Top |
Malignant transformation related pathway analysis |
| Find out the enriched GO biological processes and KEGG pathways involved in transition from healthy to precancer to cancer |
| Tissue | Disease Stage | Enriched GO biological Processes |
| Colorectum | AD |  |
| Colorectum | SER |  |
| Colorectum | MSS |  |
| Colorectum | MSI-H |  |
| Colorectum | FAP |  |
| ∗Top 15 enriched GO BP terms are showed in the bar plot of each disease state in each tissue. Each row represents a significant GO biological process which is colored according to the -log10(p.adjust). |
| Page: 1 2 3 4 5 6 7 8 9 |
| GO ID | Tissue | Disease Stage | Description | Gene Ratio | Bg Ratio | pvalue | p.adjust | Count |
| GO:00068889 | Esophagus | HGIN | endoplasmic reticulum to Golgi vesicle-mediated transport | 40/2587 | 130/18723 | 4.67e-07 | 2.07e-05 | 40 |
| GO:003238617 | Esophagus | HGIN | regulation of intracellular transport | 79/2587 | 337/18723 | 1.11e-06 | 4.36e-05 | 79 |
| GO:001063920 | Esophagus | HGIN | negative regulation of organelle organization | 79/2587 | 348/18723 | 4.12e-06 | 1.37e-04 | 79 |
| GO:00105076 | Esophagus | HGIN | negative regulation of autophagy | 27/2587 | 85/18723 | 1.72e-05 | 4.71e-04 | 27 |
| GO:007048220 | Esophagus | HGIN | response to oxygen levels | 76/2587 | 347/18723 | 2.36e-05 | 6.25e-04 | 76 |
| GO:00162418 | Esophagus | HGIN | regulation of macroautophagy | 38/2587 | 141/18723 | 2.80e-05 | 7.21e-04 | 38 |
| GO:000689016 | Esophagus | HGIN | retrograde vesicle-mediated transport, Golgi to endoplasmic reticulum | 19/2587 | 52/18723 | 3.44e-05 | 8.67e-04 | 19 |
| GO:19021156 | Esophagus | HGIN | regulation of organelle assembly | 46/2587 | 186/18723 | 4.63e-05 | 1.12e-03 | 46 |
| GO:003629320 | Esophagus | HGIN | response to decreased oxygen levels | 70/2587 | 322/18723 | 6.23e-05 | 1.44e-03 | 70 |
| GO:000166620 | Esophagus | HGIN | response to hypoxia | 67/2587 | 307/18723 | 7.82e-05 | 1.75e-03 | 67 |
| GO:00070336 | Esophagus | HGIN | vacuole organization | 44/2587 | 180/18723 | 8.97e-05 | 1.96e-03 | 44 |
| GO:19050375 | Esophagus | HGIN | autophagosome organization | 28/2587 | 103/18723 | 2.58e-04 | 4.53e-03 | 28 |
| GO:00440884 | Esophagus | HGIN | regulation of vacuole organization | 15/2587 | 45/18723 | 7.05e-04 | 9.52e-03 | 15 |
| GO:00000455 | Esophagus | HGIN | autophagosome assembly | 26/2587 | 99/18723 | 7.45e-04 | 9.90e-03 | 26 |
| GO:000689210 | Esophagus | HGIN | post-Golgi vesicle-mediated transport | 26/2587 | 104/18723 | 1.63e-03 | 1.81e-02 | 26 |
| GO:19021162 | Esophagus | HGIN | negative regulation of organelle assembly | 13/2587 | 41/18723 | 2.62e-03 | 2.58e-02 | 13 |
| GO:00162422 | Esophagus | HGIN | negative regulation of macroautophagy | 11/2587 | 34/18723 | 4.61e-03 | 3.96e-02 | 11 |
| GO:20007853 | Esophagus | HGIN | regulation of autophagosome assembly | 12/2587 | 39/18723 | 4.97e-03 | 4.18e-02 | 12 |
| GO:004819318 | Esophagus | ESCC | Golgi vesicle transport | 231/8552 | 296/18723 | 1.82e-30 | 9.63e-28 | 231 |
| GO:001623617 | Esophagus | ESCC | macroautophagy | 216/8552 | 291/18723 | 1.94e-23 | 4.57e-21 | 216 |
| Page: 1 2 3 4 5 6 7 8 9 10 11 12 13 |
| Pathway ID | Tissue | Disease Stage | Description | Gene Ratio | Bg Ratio | pvalue | p.adjust | qvalue | Count |
| Page: 1 |
Top |
Cell-cell communication analysis |
| Identification of potential cell-cell interactions between two cell types and their ligand-receptor pairs for different disease states |
| Ligand | Receptor | LRpair | Pathway | Tissue | Disease Stage |
| Page: 1 |
Top |
Single-cell gene regulatory network inference analysis |
| Find out the significant the regulons (TFs) and the target genes of each regulon across cell types for different disease states |
| TF | Cell Type | Tissue | Disease Stage | Target Gene | RSS | Regulon Activity |
| ∗The dot plots of a searched regulon are shown for all cell subpopulations in each disease state of each tissue based on the regulon specific score inferred using pySCENIC and by calculating the average expression. |
| Page: 1 |
Top |
Somatic mutation of malignant transformation related genes |
| Annotation of somatic variants for genes involved in malignant transformation |
| Hugo Symbol | Variant Class | Variant Classification | dbSNP RS | HGVSc | HGVSp | HGVSp Short | SWISSPROT | BIOTYPE | SIFT | PolyPhen | Tumor Sample Barcode | Tissue | Histology | Sex | Age | Stage | Therapy Types | Drugs | Outcome |
| SCFD1 | SNV | Missense_Mutation | c.1193N>G | p.Leu398Arg | p.L398R | Q8WVM8 | protein_coding | deleterious(0) | benign(0.301) | TCGA-A8-A09X-01 | Breast | breast invasive carcinoma | Female | <65 | III/IV | Unknown | Unknown | SD | |
| SCFD1 | SNV | Missense_Mutation | c.673C>A | p.Leu225Ile | p.L225I | Q8WVM8 | protein_coding | deleterious(0.02) | possibly_damaging(0.811) | TCGA-BH-A0DK-01 | Breast | breast invasive carcinoma | Female | <65 | I/II | Hormone Therapy | tamoxiphen | SD | |
| SCFD1 | SNV | Missense_Mutation | c.617C>T | p.Ala206Val | p.A206V | Q8WVM8 | protein_coding | tolerated(0.47) | benign(0.009) | TCGA-BH-A0EI-01 | Breast | breast invasive carcinoma | Female | <65 | I/II | Unknown | Unknown | SD | |
| SCFD1 | SNV | Missense_Mutation | novel | c.34N>C | p.Ala12Pro | p.A12P | Q8WVM8 | protein_coding | tolerated(0.18) | possibly_damaging(0.665) | TCGA-BH-A18F-01 | Breast | breast invasive carcinoma | Female | <65 | I/II | Chemotherapy | taxotere | CR |
| SCFD1 | SNV | Missense_Mutation | c.1736N>C | p.Ser579Thr | p.S579T | Q8WVM8 | protein_coding | tolerated(0.45) | benign(0.056) | TCGA-E9-A1R4-01 | Breast | breast invasive carcinoma | Female | >=65 | I/II | Chemotherapy | 5-fluorouracil | SD | |
| SCFD1 | SNV | Missense_Mutation | novel | c.730N>A | p.Asp244Asn | p.D244N | Q8WVM8 | protein_coding | tolerated(0.31) | possibly_damaging(0.528) | TCGA-E9-A2JT-01 | Breast | breast invasive carcinoma | Female | <65 | I/II | Hormone Therapy | tamoxiphen | SD |
| SCFD1 | SNV | Missense_Mutation | novel | c.57N>C | p.Gln19His | p.Q19H | Q8WVM8 | protein_coding | deleterious(0) | probably_damaging(0.998) | TCGA-VS-A8EK-01 | Cervix | cervical & endocervical cancer | Female | >=65 | I/II | Chemotherapy | cisplatin | PD |
| SCFD1 | SNV | Missense_Mutation | c.1244C>A | p.Ala415Glu | p.A415E | Q8WVM8 | protein_coding | tolerated(1) | benign(0.011) | TCGA-A6-5665-01 | Colorectum | colon adenocarcinoma | Female | >=65 | I/II | Unknown | Unknown | PD | |
| SCFD1 | SNV | Missense_Mutation | rs561696273 | c.320N>A | p.Arg107Gln | p.R107Q | Q8WVM8 | protein_coding | tolerated(0.7) | benign(0.022) | TCGA-AA-3510-01 | Colorectum | colon adenocarcinoma | Male | >=65 | I/II | Unknown | Unknown | SD |
| SCFD1 | SNV | Missense_Mutation | novel | c.829N>C | p.Tyr277His | p.Y277H | Q8WVM8 | protein_coding | deleterious(0) | probably_damaging(1) | TCGA-AA-3984-01 | Colorectum | colon adenocarcinoma | Female | <65 | I/II | Unknown | Unknown | SD |
| Page: 1 2 3 4 5 6 |
Top |
Related drugs of malignant transformation related genes |
| Identification of chemicals and drugs interact with genes involved in malignant transfromation |
| (DGIdb 4.0) |
| Entrez ID | Symbol | Category | Interaction Types | Drug Claim Name | Drug Name | PMIDs |
| Page: 1 |

Copyright 2023-Present -The University of Texas Health Science Center at Houston |