
|
|||||
|
 | |
| |
| |
| |
| |
| |
|
Gene: SAC3D1 |
Gene summary for SAC3D1 |
| Gene information | Species | Human | Gene symbol | SAC3D1 | Gene ID | 29901 |
| Gene name | SAC3 domain containing 1 | |
| Gene Alias | HSU79266 | |
| Cytomap | 11q13.1 | |
| Gene Type | protein-coding | GO ID | GO:0000226 | UniProtAcc | F8WC89 |
Top |
Malignant transformation analysis |
| Identification of the aberrant gene expression in precancerous and cancerous lesions by comparing the gene expression of stem-like cells in diseased tissues with normal stem cells |
| Entrez ID | Symbol | Replicates | Species | Organ | Tissue | Adj P-value | Log2FC | Malignancy |
| 29901 | SAC3D1 | LZE22T | Human | Esophagus | ESCC | 1.54e-04 | 3.02e-01 | 0.068 |
| 29901 | SAC3D1 | LZE24T | Human | Esophagus | ESCC | 7.85e-14 | 3.54e-01 | 0.0596 |
| 29901 | SAC3D1 | LZE21T | Human | Esophagus | ESCC | 6.52e-03 | 2.24e-01 | 0.0655 |
| 29901 | SAC3D1 | P1T-E | Human | Esophagus | ESCC | 1.09e-04 | 2.34e-01 | 0.0875 |
| 29901 | SAC3D1 | P2T-E | Human | Esophagus | ESCC | 9.78e-30 | 4.99e-01 | 0.1177 |
| 29901 | SAC3D1 | P4T-E | Human | Esophagus | ESCC | 4.26e-43 | 1.04e+00 | 0.1323 |
| 29901 | SAC3D1 | P5T-E | Human | Esophagus | ESCC | 2.55e-31 | 5.63e-01 | 0.1327 |
| 29901 | SAC3D1 | P8T-E | Human | Esophagus | ESCC | 1.62e-13 | 2.89e-01 | 0.0889 |
| 29901 | SAC3D1 | P9T-E | Human | Esophagus | ESCC | 1.57e-24 | 5.20e-01 | 0.1131 |
| 29901 | SAC3D1 | P10T-E | Human | Esophagus | ESCC | 1.75e-25 | 4.66e-01 | 0.116 |
| 29901 | SAC3D1 | P11T-E | Human | Esophagus | ESCC | 1.06e-12 | 5.67e-01 | 0.1426 |
| 29901 | SAC3D1 | P12T-E | Human | Esophagus | ESCC | 6.36e-33 | 5.64e-01 | 0.1122 |
| 29901 | SAC3D1 | P15T-E | Human | Esophagus | ESCC | 4.29e-21 | 4.13e-01 | 0.1149 |
| 29901 | SAC3D1 | P16T-E | Human | Esophagus | ESCC | 1.46e-28 | 5.01e-01 | 0.1153 |
| 29901 | SAC3D1 | P17T-E | Human | Esophagus | ESCC | 2.26e-13 | 5.15e-01 | 0.1278 |
| 29901 | SAC3D1 | P19T-E | Human | Esophagus | ESCC | 2.95e-08 | 5.91e-01 | 0.1662 |
| 29901 | SAC3D1 | P20T-E | Human | Esophagus | ESCC | 2.19e-19 | 4.31e-01 | 0.1124 |
| 29901 | SAC3D1 | P21T-E | Human | Esophagus | ESCC | 4.71e-53 | 9.71e-01 | 0.1617 |
| 29901 | SAC3D1 | P22T-E | Human | Esophagus | ESCC | 1.30e-15 | 2.85e-01 | 0.1236 |
| 29901 | SAC3D1 | P23T-E | Human | Esophagus | ESCC | 4.96e-26 | 5.42e-01 | 0.108 |
| Page: 1 2 3 4 5 6 |
| Tissue | Expression Dynamics | Abbreviation |
| Esophagus |  | ESCC: Esophageal squamous cell carcinoma |
| HGIN: High-grade intraepithelial neoplasias | ||
| LGIN: Low-grade intraepithelial neoplasias | ||
| Liver | 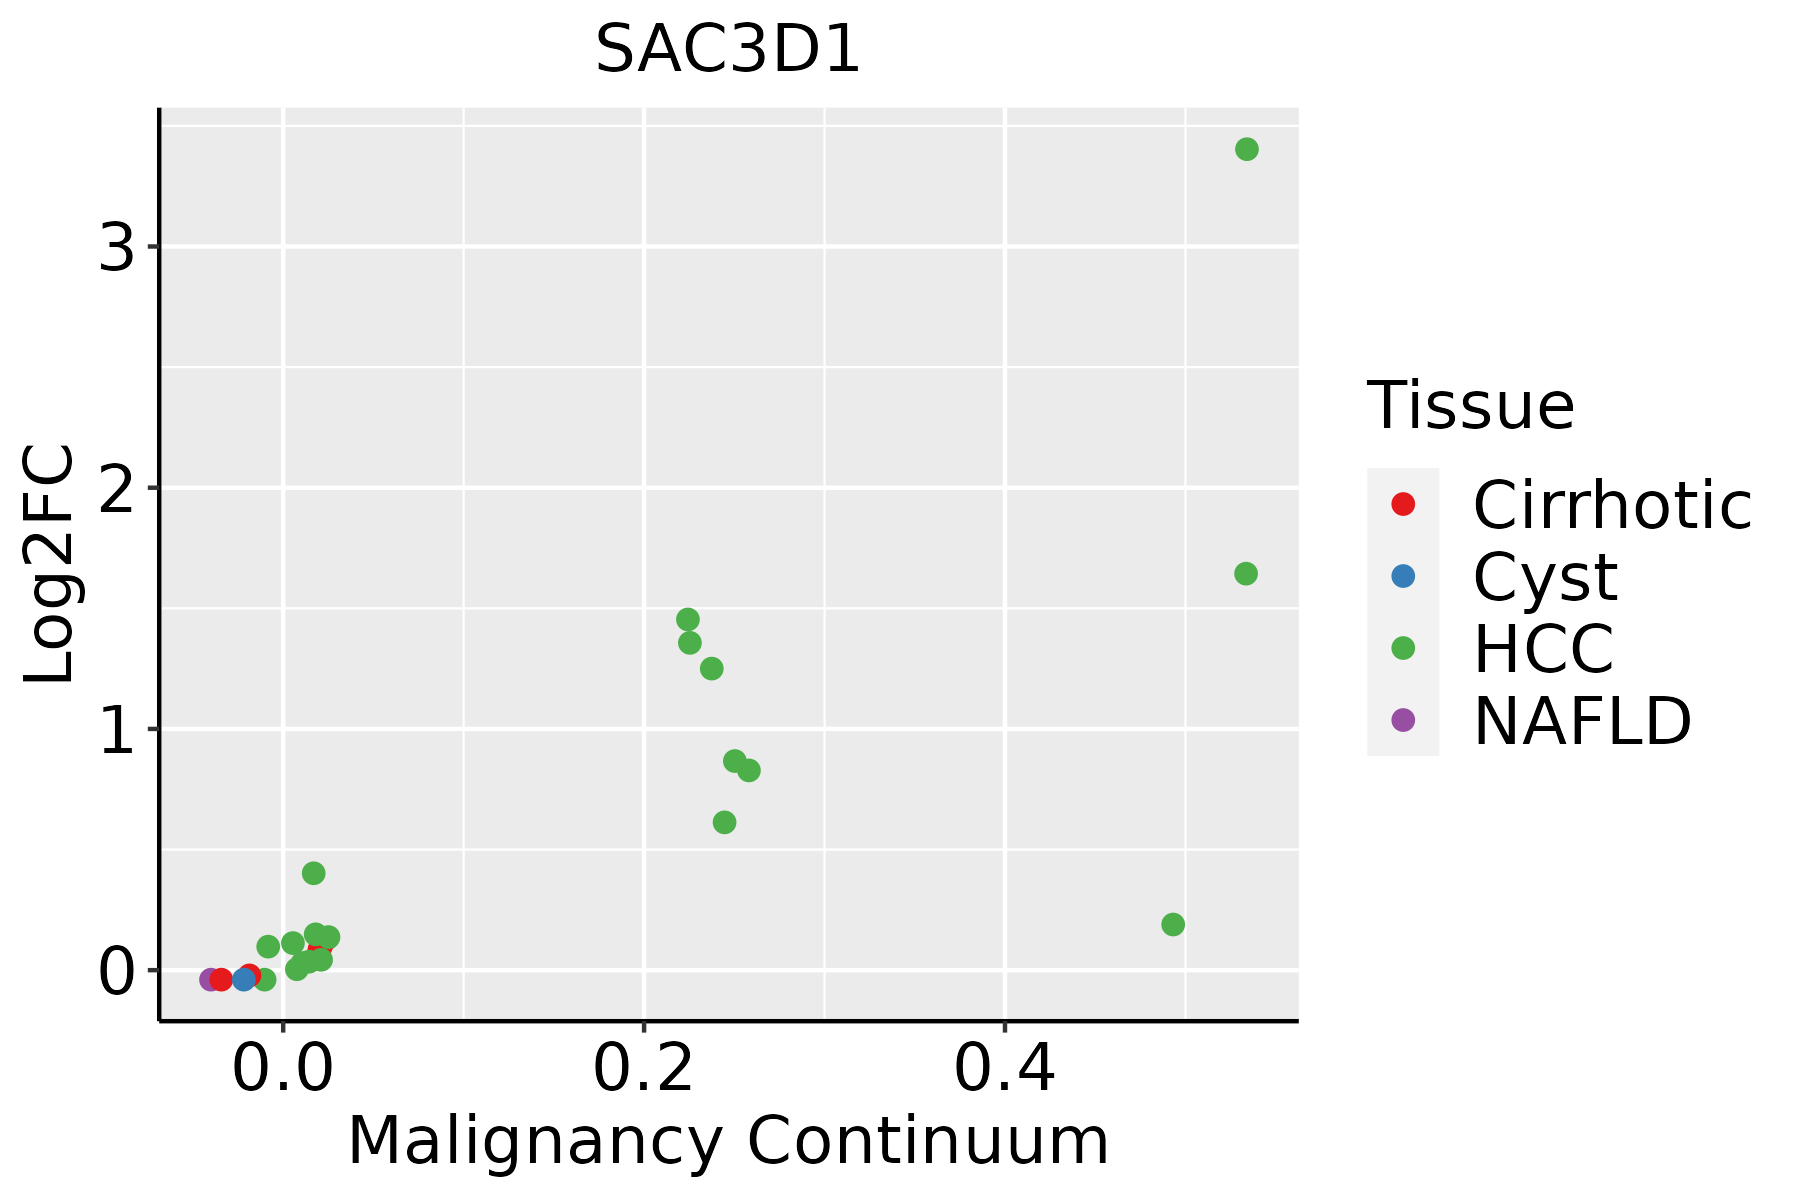 | HCC: Hepatocellular carcinoma |
| NAFLD: Non-alcoholic fatty liver disease | ||
| Oral Cavity | 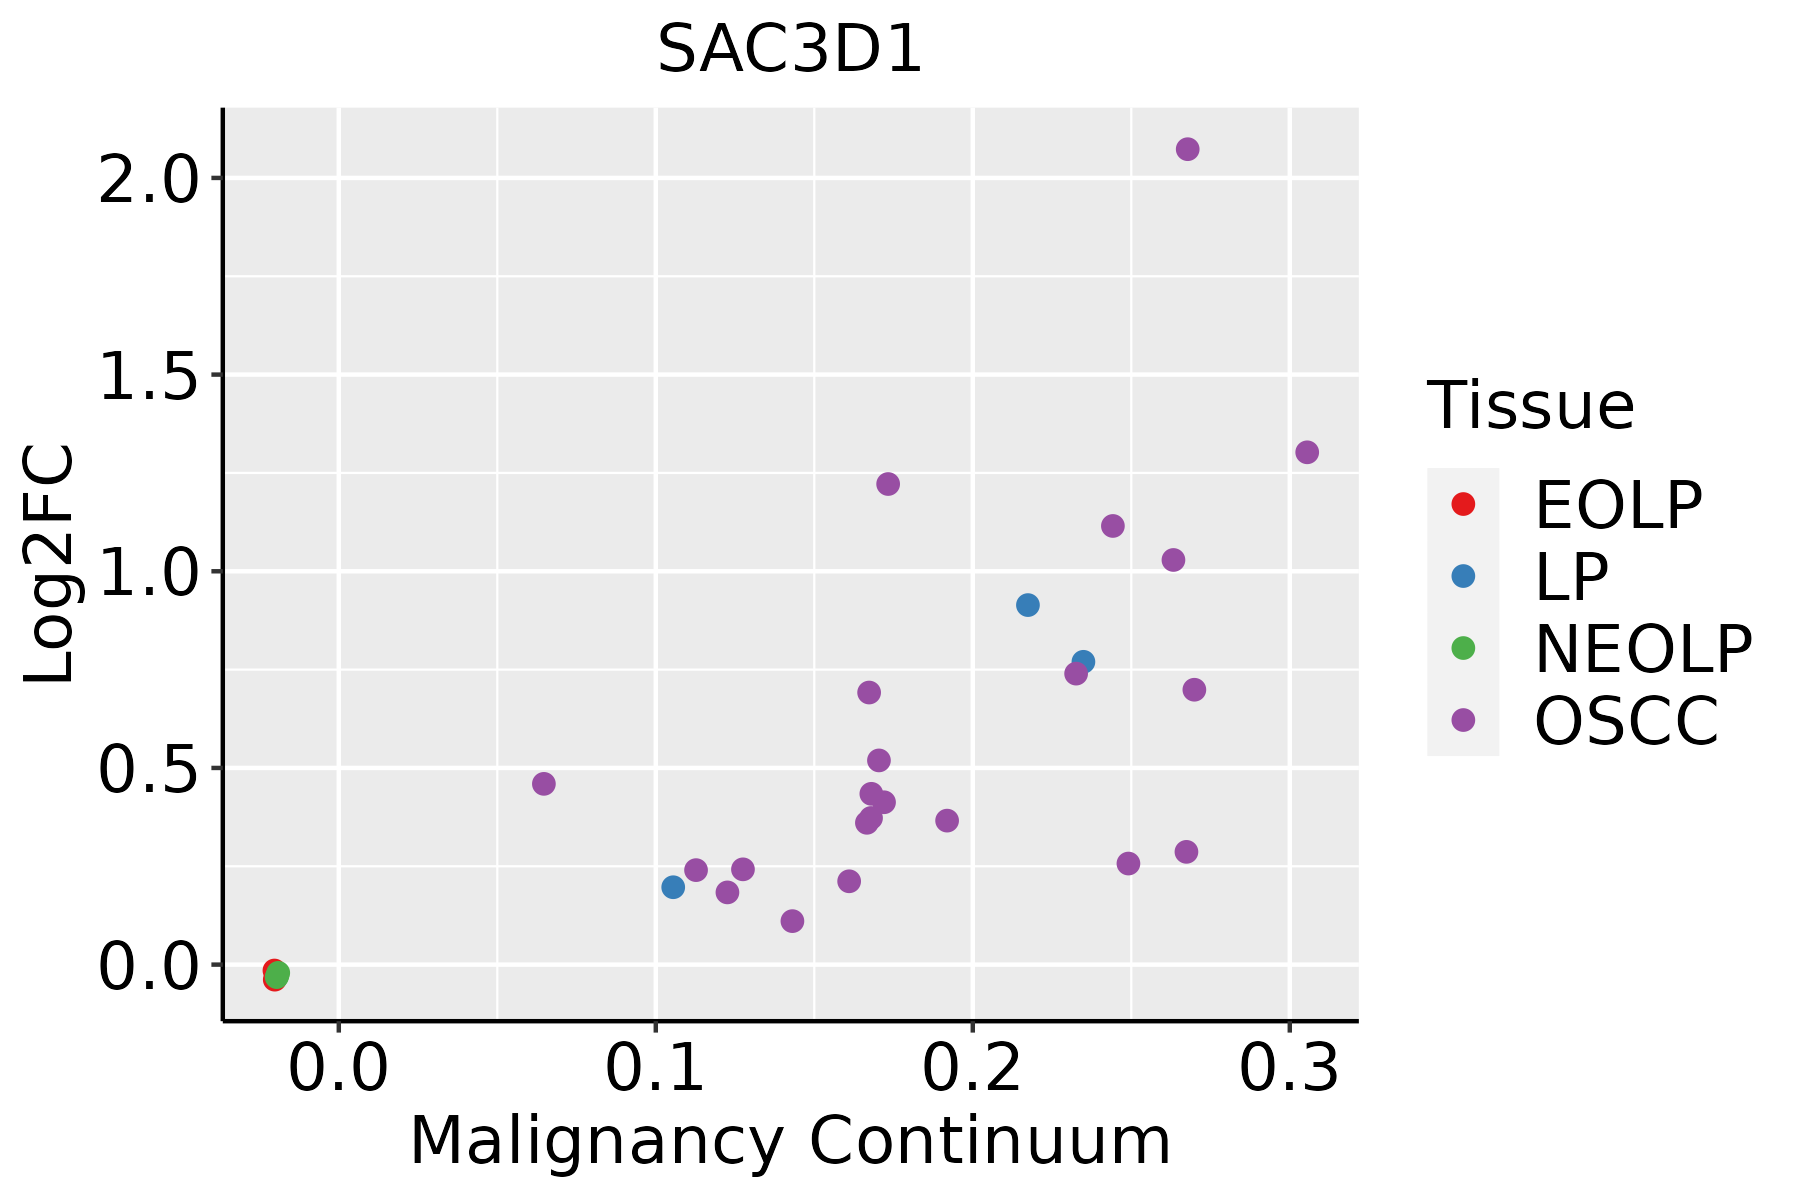 | EOLP: Erosive Oral lichen planus |
| LP: leukoplakia | ||
| NEOLP: Non-erosive oral lichen planus | ||
| OSCC: Oral squamous cell carcinoma | ||
| Skin | 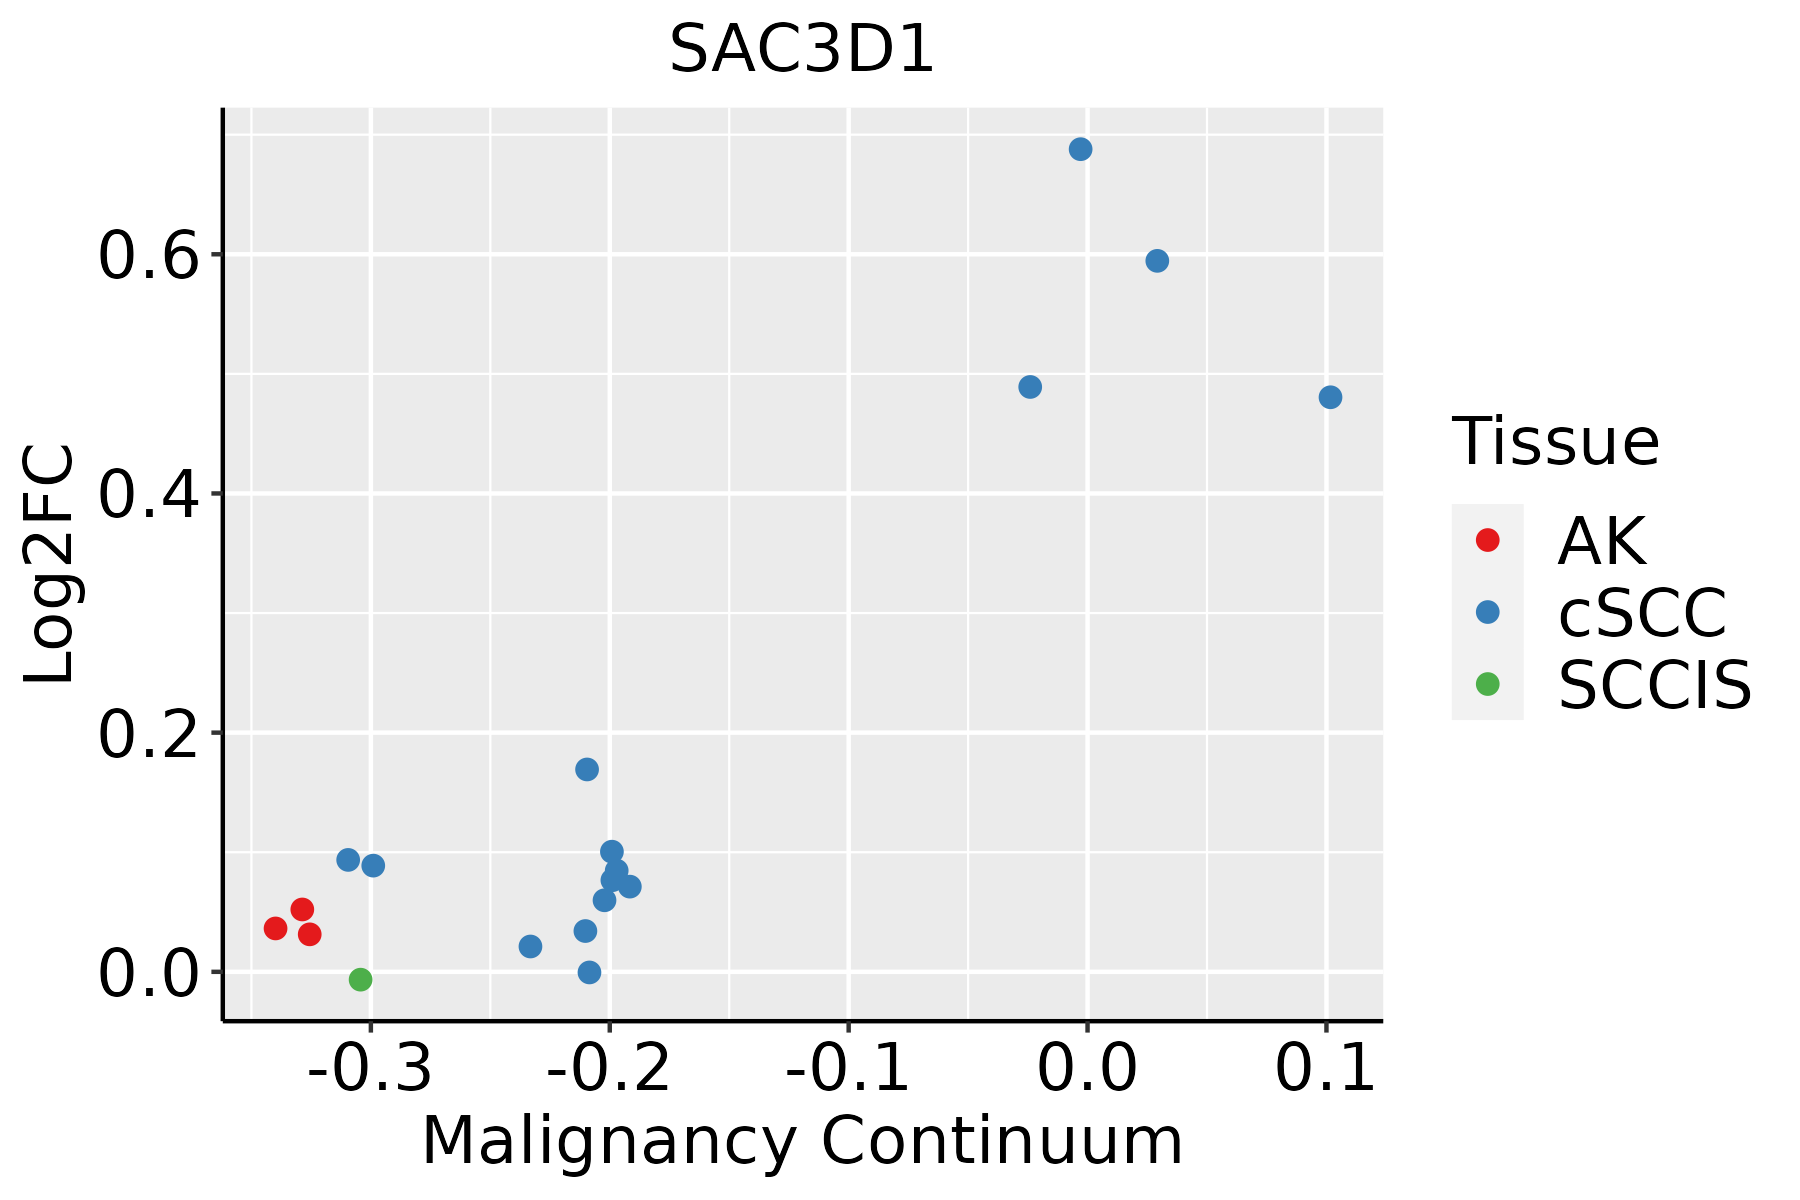 | AK: Actinic keratosis |
| cSCC: Cutaneous squamous cell carcinoma | ||
| SCCIS:squamous cell carcinoma in situ | ||
| Thyroid | 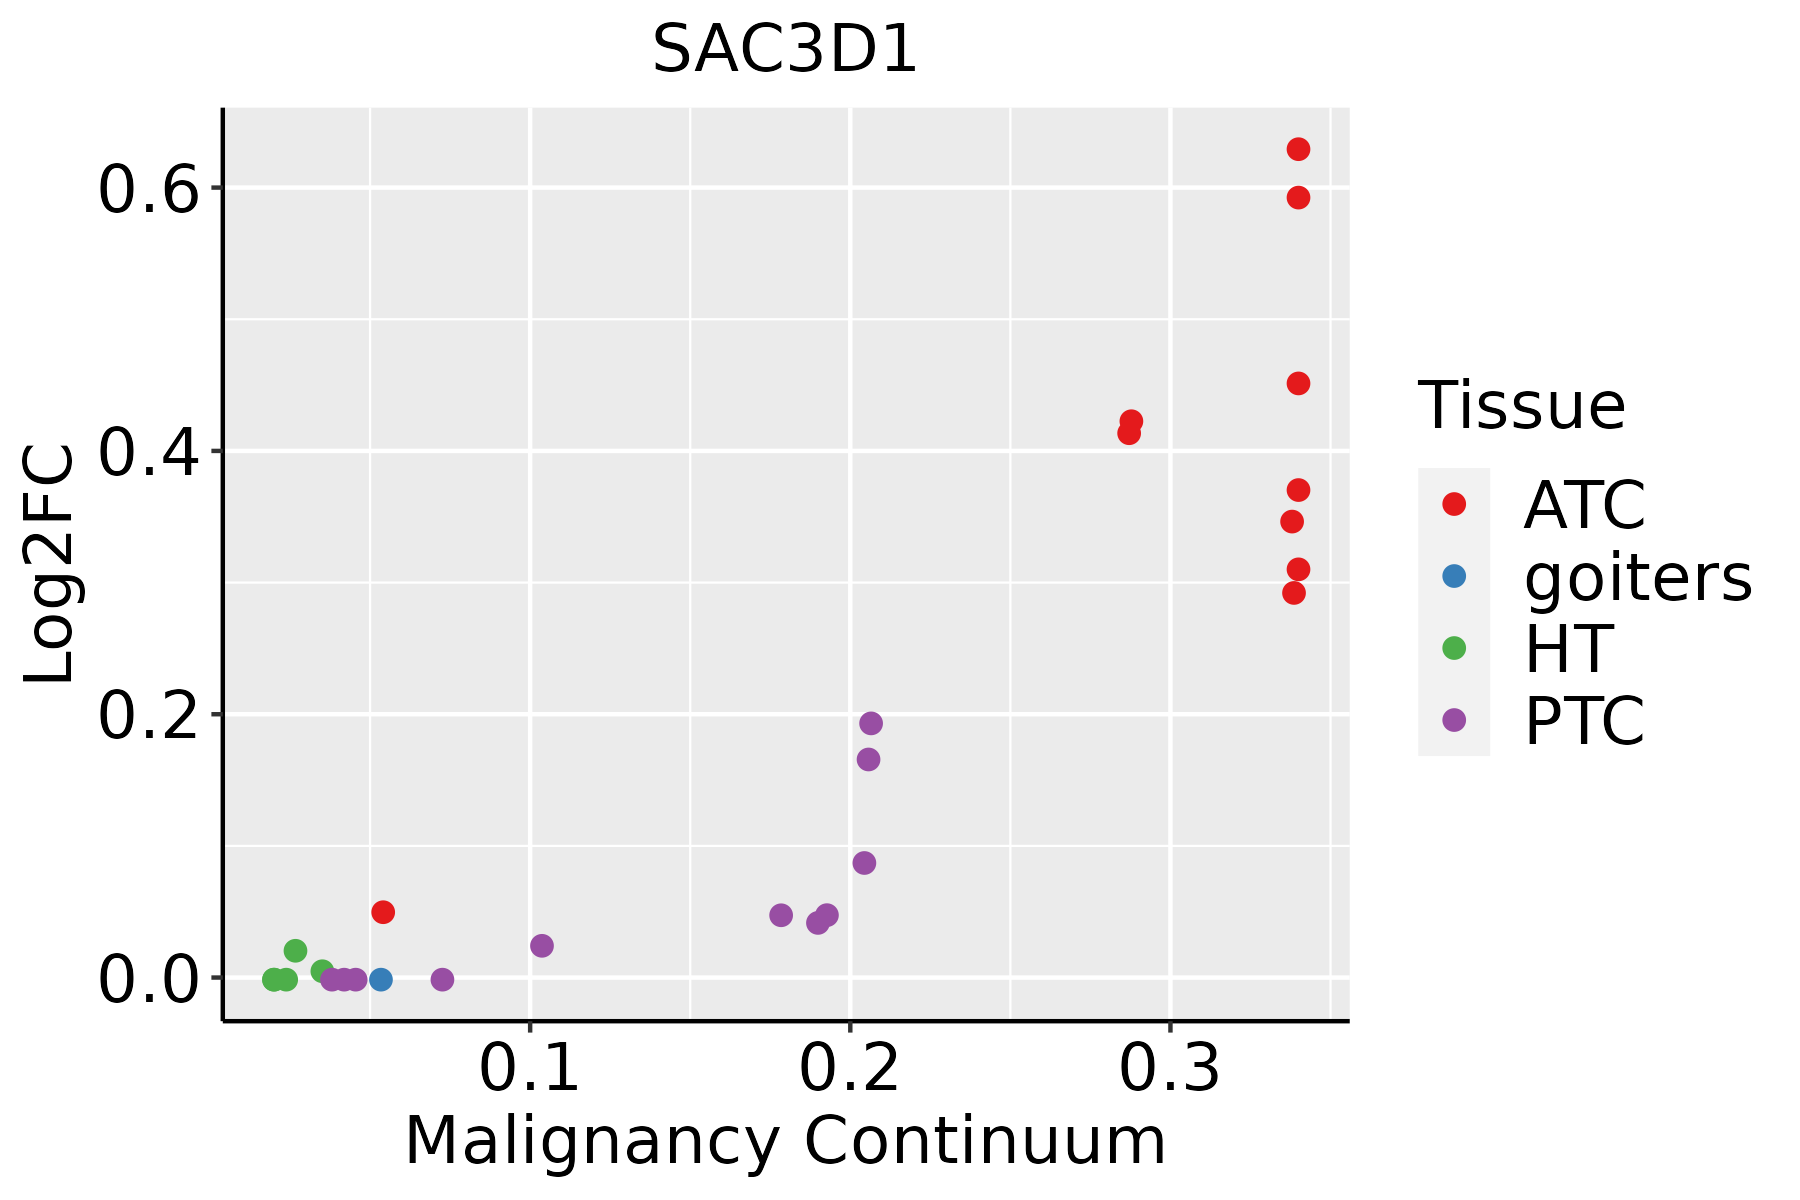 | ATC: Anaplastic thyroid cancer |
| HT: Hashimoto's thyroiditis | ||
| PTC: Papillary thyroid cancer |
| ∗log2FC in expression of this searched gene in stem-like cells from each diseased tissue sample relative to stem-like cells in normal samples in each tissue plotted against the malignancy continuum. Samples are colored based on if they are from different disease stage. |
Top |
Malignant transformation related pathway analysis |
| Find out the enriched GO biological processes and KEGG pathways involved in transition from healthy to precancer to cancer |
| Tissue | Disease Stage | Enriched GO biological Processes |
| Colorectum | AD |  |
| Colorectum | SER |  |
| Colorectum | MSS |  |
| Colorectum | MSI-H |  |
| Colorectum | FAP |  |
| ∗Top 15 enriched GO BP terms are showed in the bar plot of each disease state in each tissue. Each row represents a significant GO biological process which is colored according to the -log10(p.adjust). |
| Page: 1 2 3 4 5 6 7 8 9 |
| GO ID | Tissue | Disease Stage | Description | Gene Ratio | Bg Ratio | pvalue | p.adjust | Count |
| GO:000705116 | Thyroid | PTC | spindle organization | 92/5968 | 184/18723 | 2.21e-07 | 3.92e-06 | 92 |
| GO:005122514 | Thyroid | PTC | spindle assembly | 56/5968 | 117/18723 | 2.17e-04 | 1.60e-03 | 56 |
| GO:00310235 | Thyroid | PTC | microtubule organizing center organization | 65/5968 | 143/18723 | 4.48e-04 | 2.96e-03 | 65 |
| GO:00070984 | Thyroid | PTC | centrosome cycle | 59/5968 | 130/18723 | 8.39e-04 | 5.16e-03 | 59 |
| GO:0051298 | Thyroid | PTC | centrosome duplication | 36/5968 | 73/18723 | 1.41e-03 | 7.89e-03 | 36 |
| GO:000705122 | Thyroid | ATC | spindle organization | 109/6293 | 184/18723 | 7.99e-13 | 3.46e-11 | 109 |
| GO:005122521 | Thyroid | ATC | spindle assembly | 66/6293 | 117/18723 | 3.28e-07 | 4.88e-06 | 66 |
| GO:003102311 | Thyroid | ATC | microtubule organizing center organization | 71/6293 | 143/18723 | 5.11e-05 | 3.99e-04 | 71 |
| GO:000709811 | Thyroid | ATC | centrosome cycle | 65/6293 | 130/18723 | 7.95e-05 | 5.97e-04 | 65 |
| GO:00512981 | Thyroid | ATC | centrosome duplication | 36/6293 | 73/18723 | 3.91e-03 | 1.70e-02 | 36 |
| Page: 1 2 |
| Pathway ID | Tissue | Disease Stage | Description | Gene Ratio | Bg Ratio | pvalue | p.adjust | qvalue | Count |
| Page: 1 |
Top |
Cell-cell communication analysis |
| Identification of potential cell-cell interactions between two cell types and their ligand-receptor pairs for different disease states |
| Ligand | Receptor | LRpair | Pathway | Tissue | Disease Stage |
| Page: 1 |
Top |
Single-cell gene regulatory network inference analysis |
| Find out the significant the regulons (TFs) and the target genes of each regulon across cell types for different disease states |
| TF | Cell Type | Tissue | Disease Stage | Target Gene | RSS | Regulon Activity |
| ∗The dot plots of a searched regulon are shown for all cell subpopulations in each disease state of each tissue based on the regulon specific score inferred using pySCENIC and by calculating the average expression. |
| Page: 1 |
Top |
Somatic mutation of malignant transformation related genes |
| Annotation of somatic variants for genes involved in malignant transformation |
| Hugo Symbol | Variant Class | Variant Classification | dbSNP RS | HGVSc | HGVSp | HGVSp Short | SWISSPROT | BIOTYPE | SIFT | PolyPhen | Tumor Sample Barcode | Tissue | Histology | Sex | Age | Stage | Therapy Types | Drugs | Outcome |
| SAC3D1 | deletion | In_Frame_Del | novel | c.582_587delNNNNNN | p.Glu195_Ala196del | p.E195_A196del | protein_coding | TCGA-A8-A09X-01 | Breast | breast invasive carcinoma | Female | <65 | III/IV | Unknown | Unknown | SD | |||
| SAC3D1 | insertion | Nonsense_Mutation | novel | c.937_938insCTGCATGAGGTTCTACAGCTGCCT | p.Arg313delinsProAlaTerGlySerThrAlaAlaCys | p.R313delinsPA*GSTAAC | protein_coding | TCGA-A8-A09X-01 | Breast | breast invasive carcinoma | Female | <65 | III/IV | Unknown | Unknown | SD | |||
| SAC3D1 | SNV | Missense_Mutation | rs775031585 | c.892G>A | p.Gly298Arg | p.G298R | protein_coding | deleterious(0.02) | probably_damaging(0.983) | TCGA-A6-5661-01 | Colorectum | colon adenocarcinoma | Female | >=65 | I/II | Unknown | Unknown | SD | |
| SAC3D1 | SNV | Missense_Mutation | rs374748039 | c.1006N>T | p.Arg336Cys | p.R336C | protein_coding | tolerated(0.19) | benign(0.017) | TCGA-CM-6171-01 | Colorectum | colon adenocarcinoma | Female | >=65 | I/II | Unknown | Unknown | SD | |
| SAC3D1 | SNV | Missense_Mutation | c.682N>A | p.Ala228Thr | p.A228T | protein_coding | tolerated(0.4) | benign(0.005) | TCGA-D5-6930-01 | Colorectum | colon adenocarcinoma | Male | >=65 | I/II | Unknown | Unknown | SD | ||
| SAC3D1 | deletion | Frame_Shift_Del | novel | c.972delN | p.Cys325AlafsTer4 | p.C325Afs*4 | protein_coding | TCGA-G4-6588-01 | Colorectum | colon adenocarcinoma | Female | <65 | I/II | Unknown | Unknown | SD | |||
| SAC3D1 | SNV | Missense_Mutation | novel | c.640C>T | p.Arg214Cys | p.R214C | protein_coding | tolerated(0.15) | benign(0.013) | TCGA-A5-A0G1-01 | Endometrium | uterine corpus endometrioid carcinoma | Female | >=65 | I/II | Unknown | Unknown | SD | |
| SAC3D1 | SNV | Missense_Mutation | rs748178524 | c.698N>A | p.Arg233His | p.R233H | protein_coding | deleterious(0) | probably_damaging(0.999) | TCGA-A5-A0G2-01 | Endometrium | uterine corpus endometrioid carcinoma | Female | <65 | III/IV | Unknown | Unknown | SD | |
| SAC3D1 | SNV | Missense_Mutation | rs374748039 | c.1006N>T | p.Arg336Cys | p.R336C | protein_coding | tolerated(0.19) | benign(0.017) | TCGA-A5-A0G2-01 | Endometrium | uterine corpus endometrioid carcinoma | Female | <65 | III/IV | Unknown | Unknown | SD | |
| SAC3D1 | SNV | Missense_Mutation | rs775031585 | c.892N>A | p.Gly298Arg | p.G298R | protein_coding | deleterious(0.02) | probably_damaging(0.983) | TCGA-A5-A0GA-01 | Endometrium | uterine corpus endometrioid carcinoma | Female | >=65 | III/IV | Chemotherapy | taxol | PD |
| Page: 1 2 3 |
Top |
Related drugs of malignant transformation related genes |
| Identification of chemicals and drugs interact with genes involved in malignant transfromation |
| (DGIdb 4.0) |
| Entrez ID | Symbol | Category | Interaction Types | Drug Claim Name | Drug Name | PMIDs |
| Page: 1 |

Copyright 2023-Present -The University of Texas Health Science Center at Houston |