| Tissue | Expression Dynamics | Abbreviation |
| Colorectum (GSE201348) | 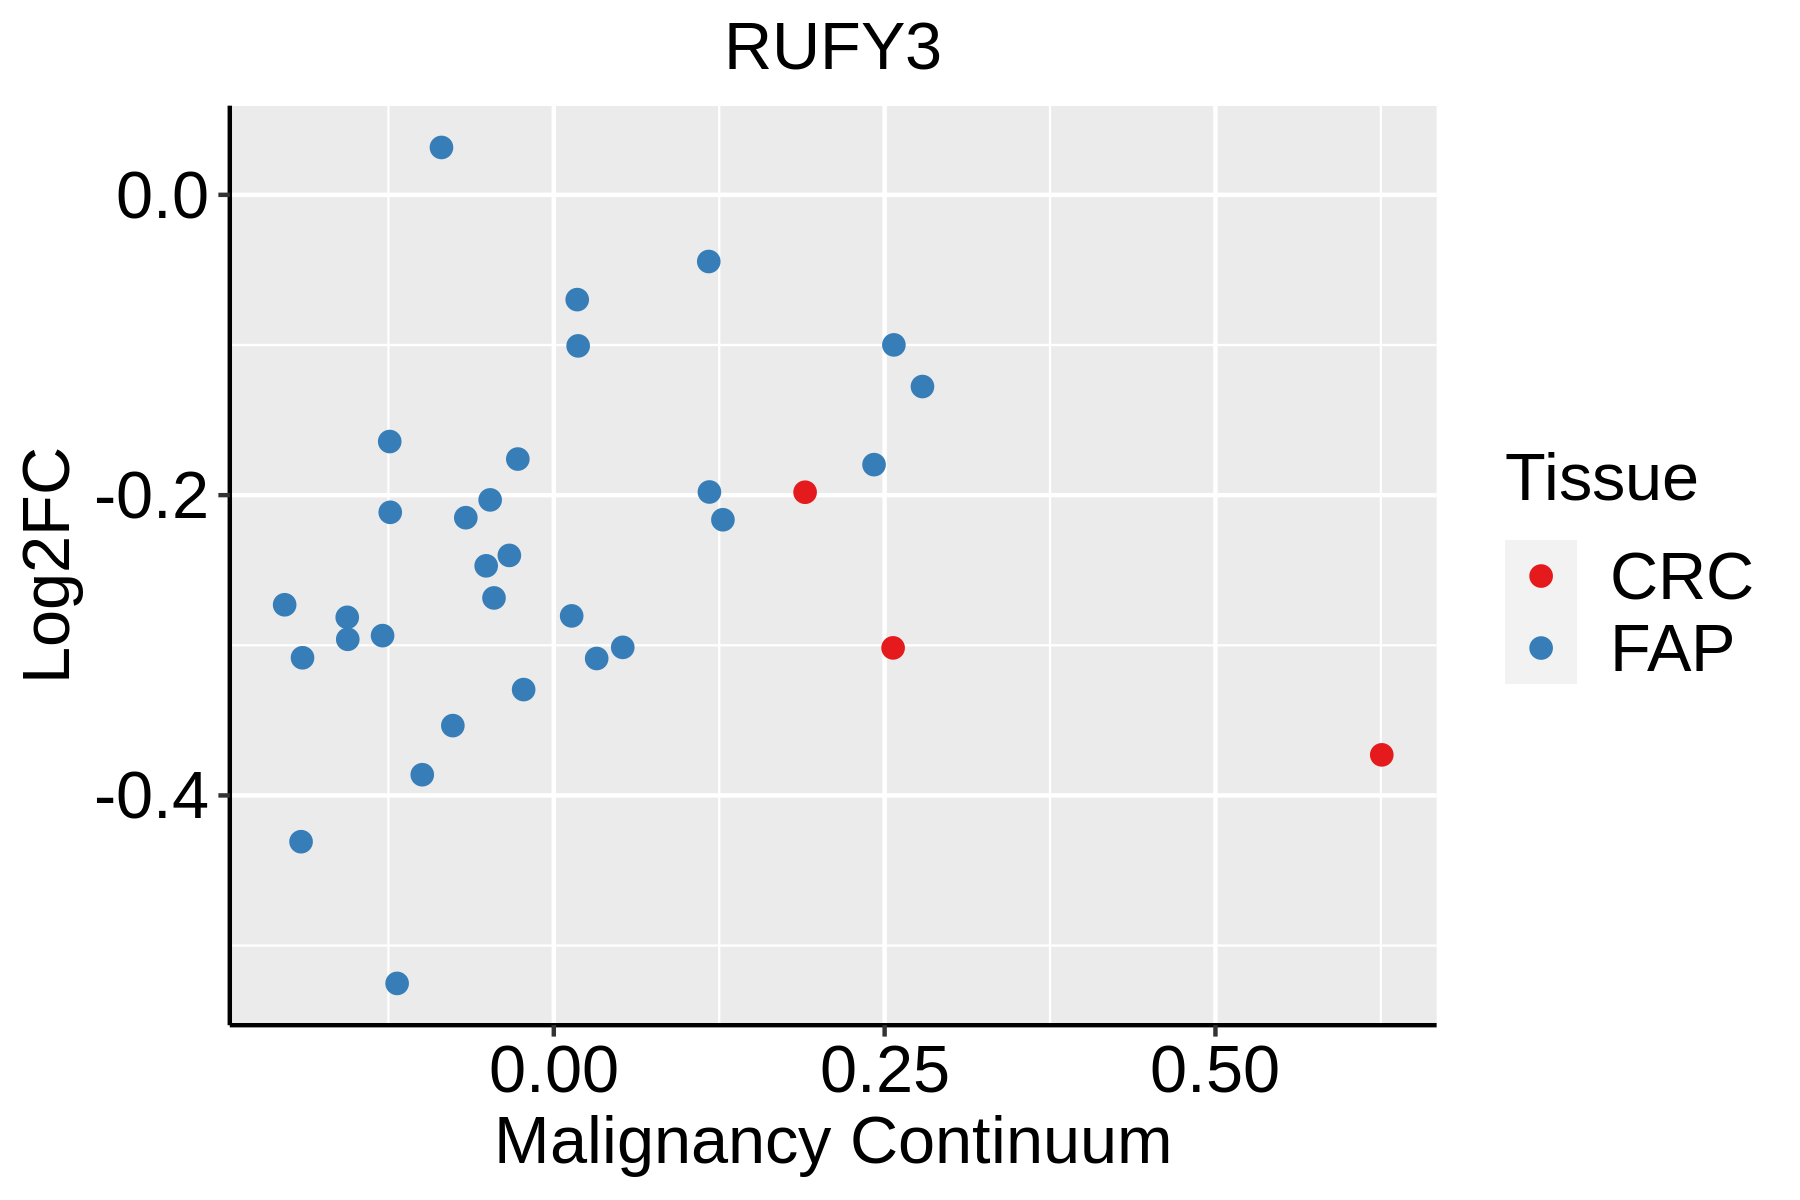 | FAP: Familial adenomatous polyposis |
| CRC: Colorectal cancer |
| Colorectum (HTA11) | 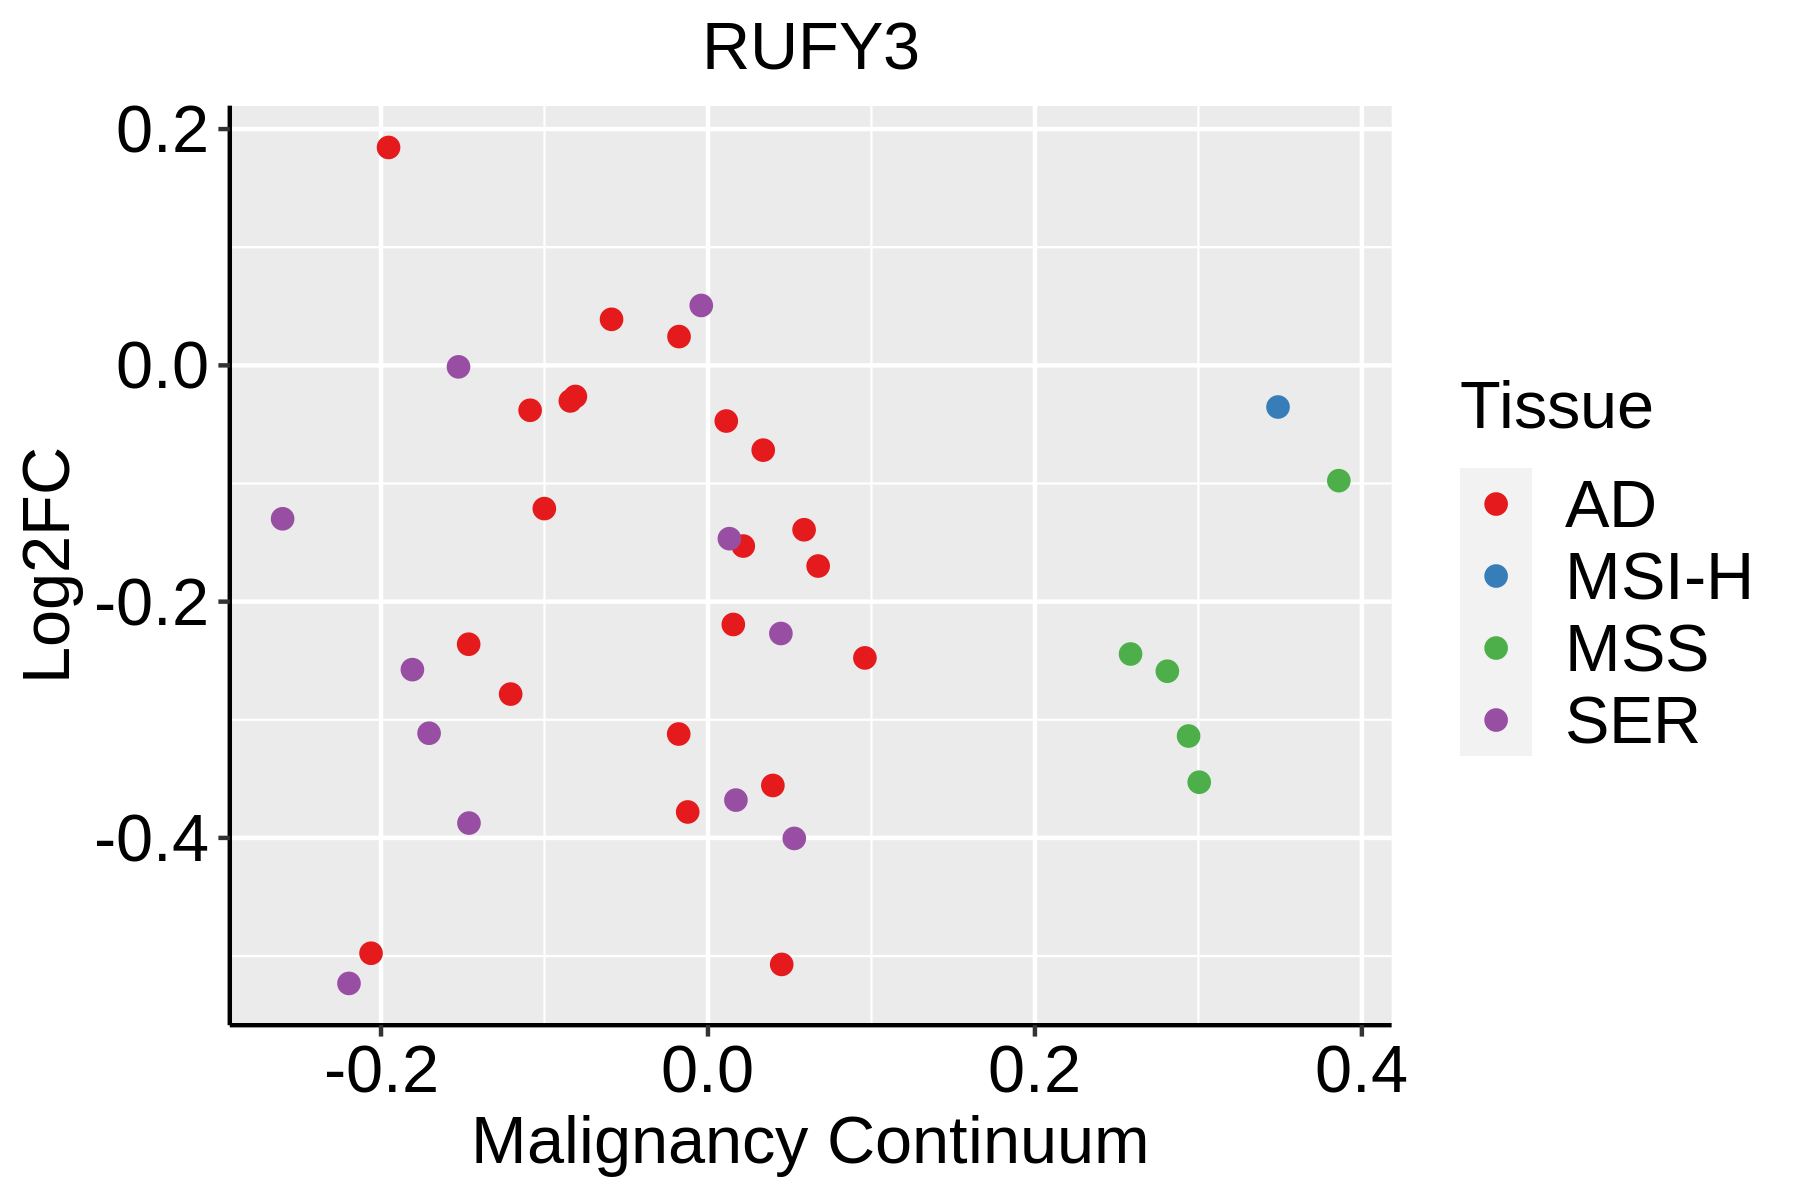 | AD: Adenomas |
| SER: Sessile serrated lesions |
| MSI-H: Microsatellite-high colorectal cancer |
| MSS: Microsatellite stable colorectal cancer |
| Esophagus | 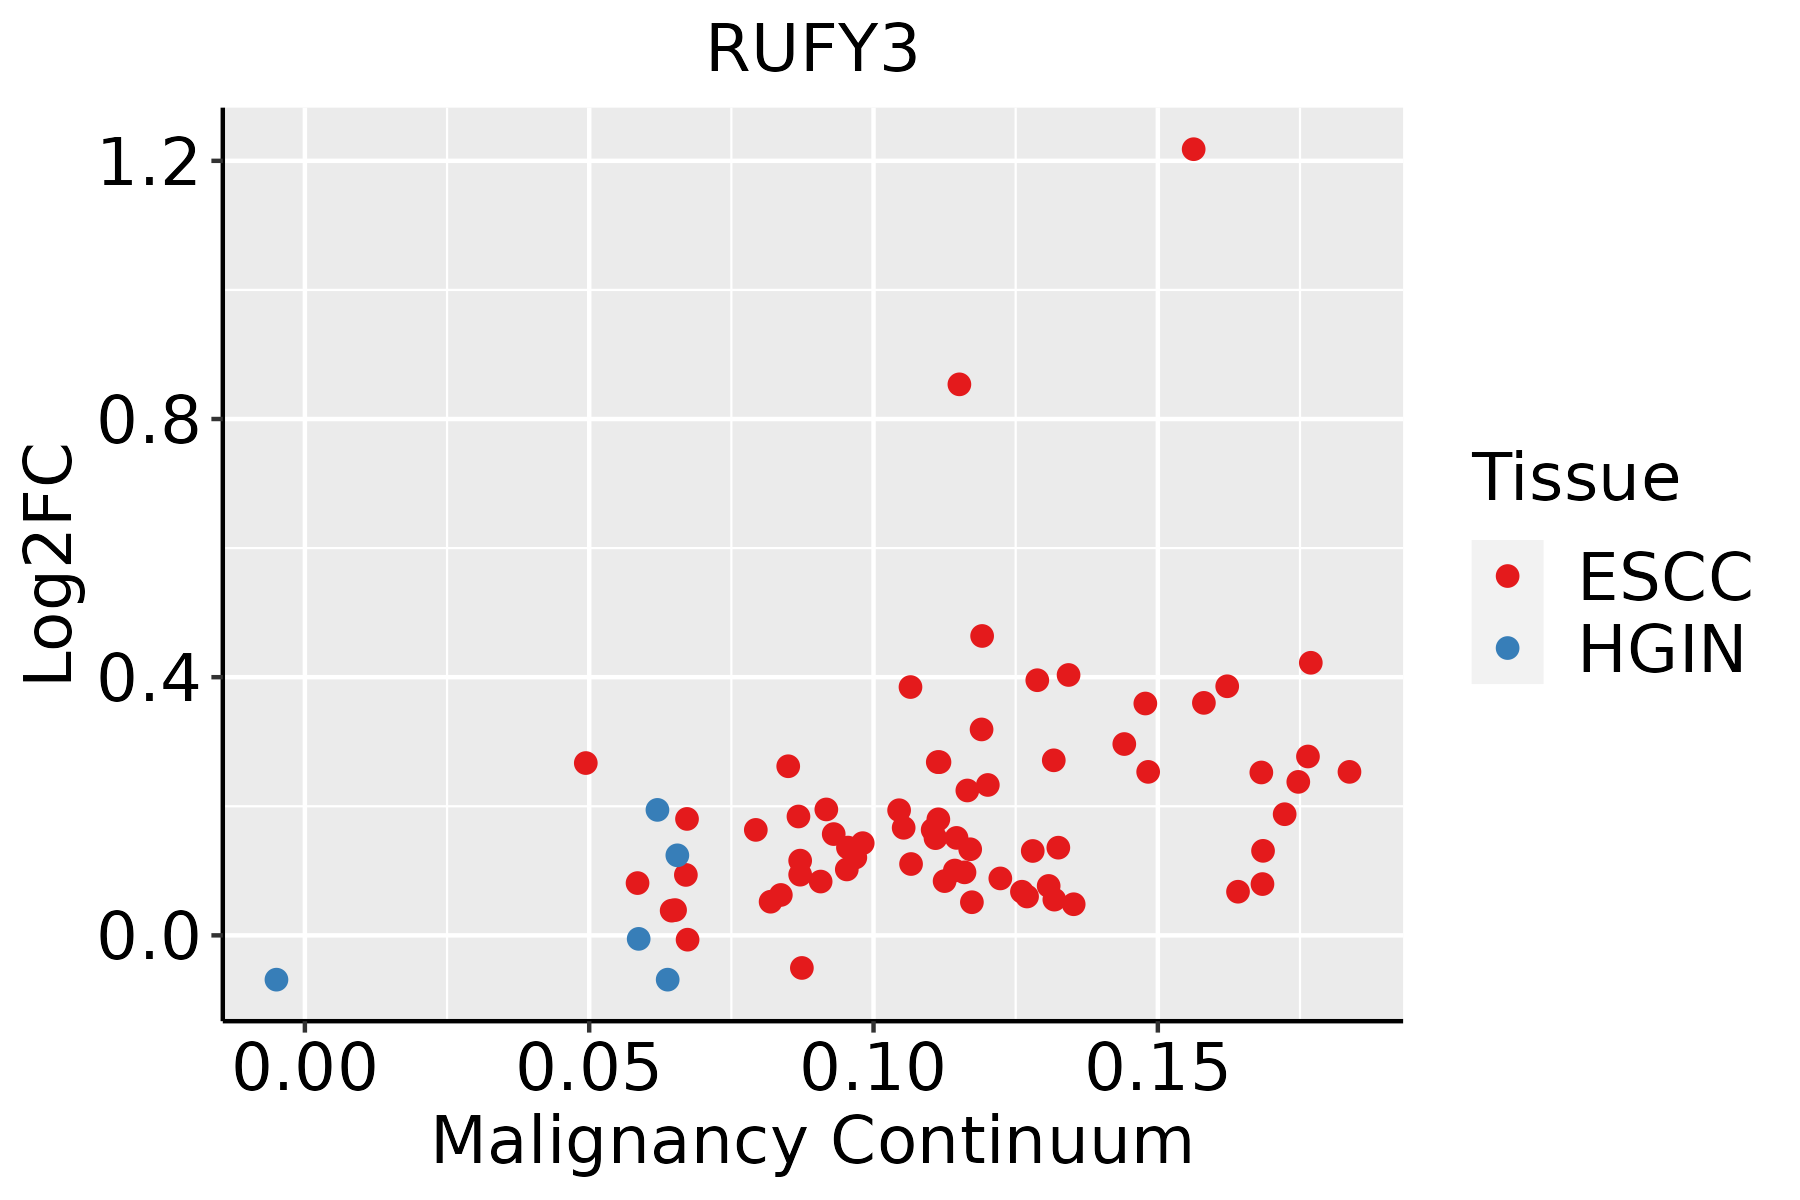 | ESCC: Esophageal squamous cell carcinoma |
| HGIN: High-grade intraepithelial neoplasias |
| LGIN: Low-grade intraepithelial neoplasias |
| Liver |  | HCC: Hepatocellular carcinoma |
| NAFLD: Non-alcoholic fatty liver disease |
| Lung | 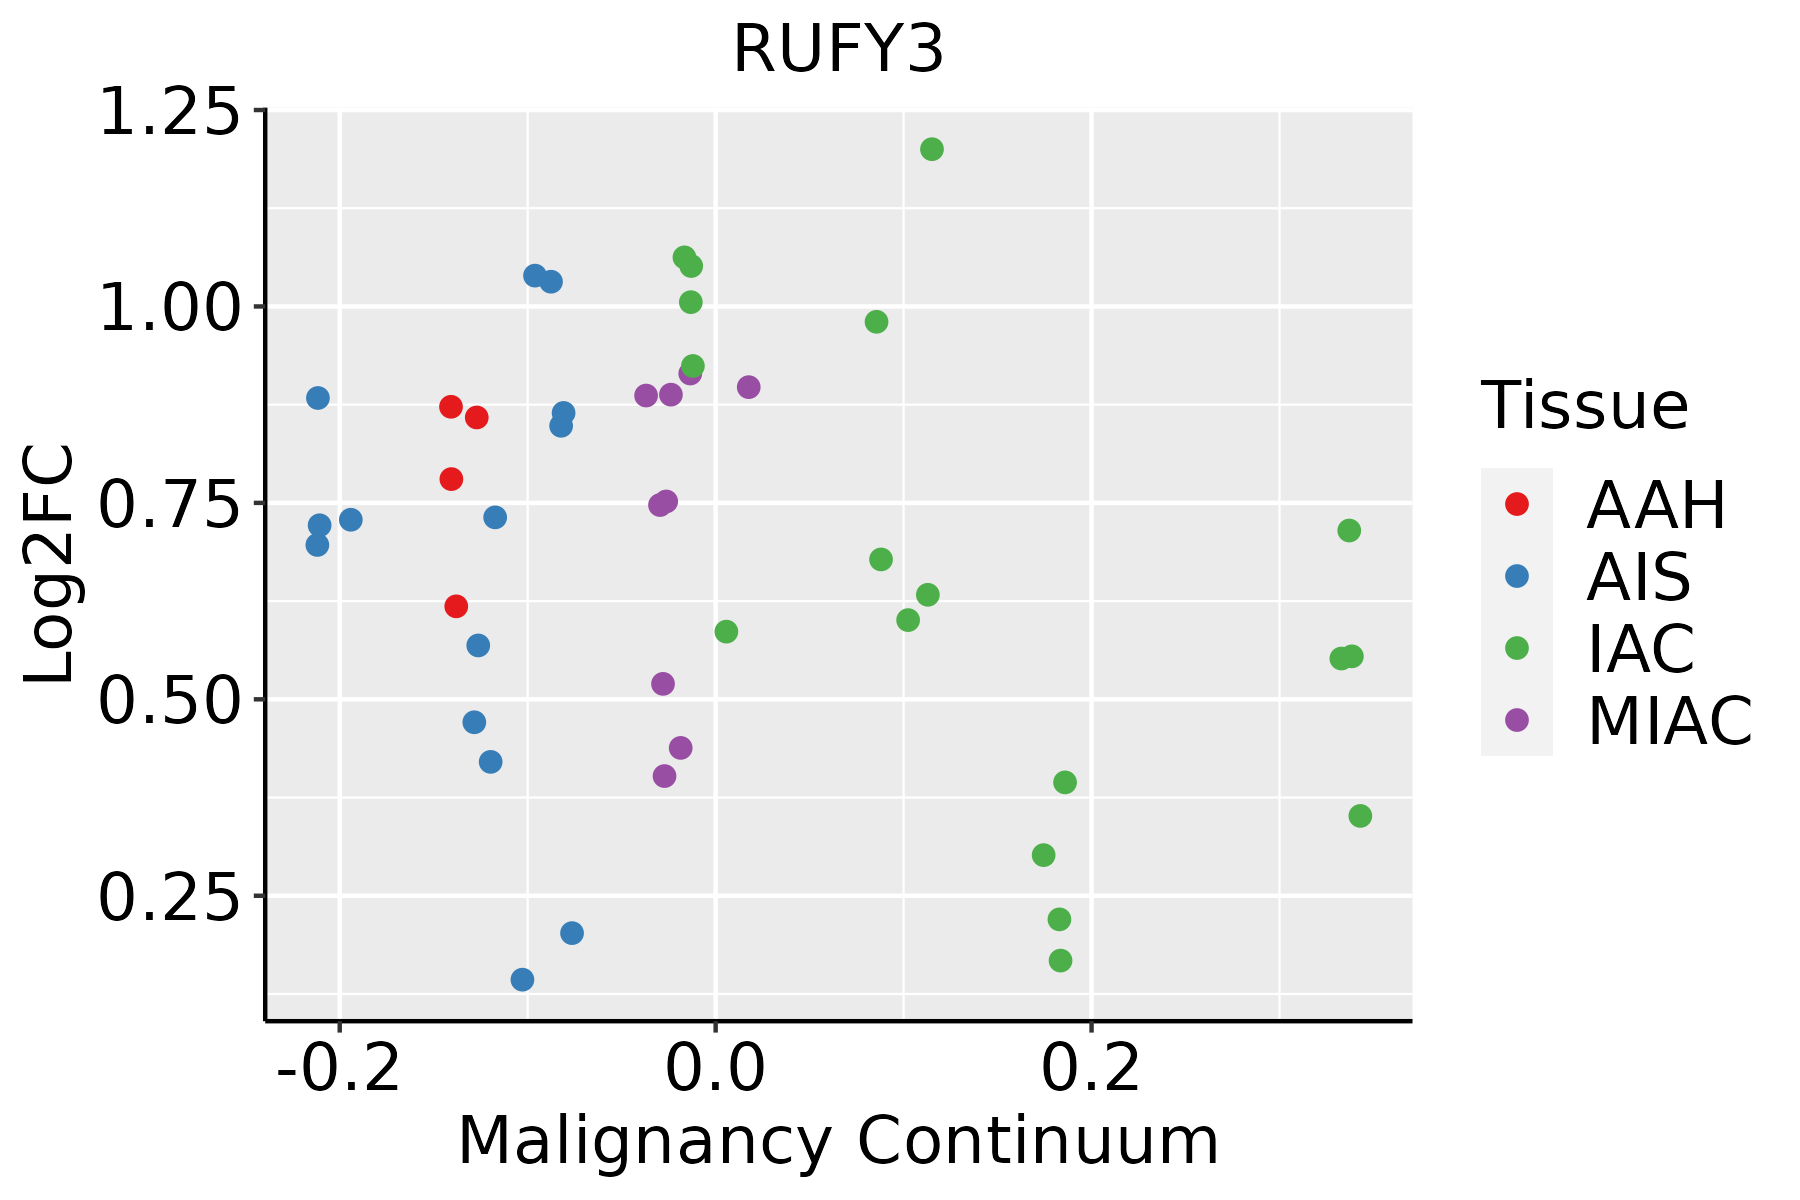 | AAH: Atypical adenomatous hyperplasia |
| AIS: Adenocarcinoma in situ |
| IAC: Invasive lung adenocarcinoma |
| MIA: Minimally invasive adenocarcinoma |
| Prostate |  | BPH: Benign Prostatic Hyperplasia |
| Thyroid | 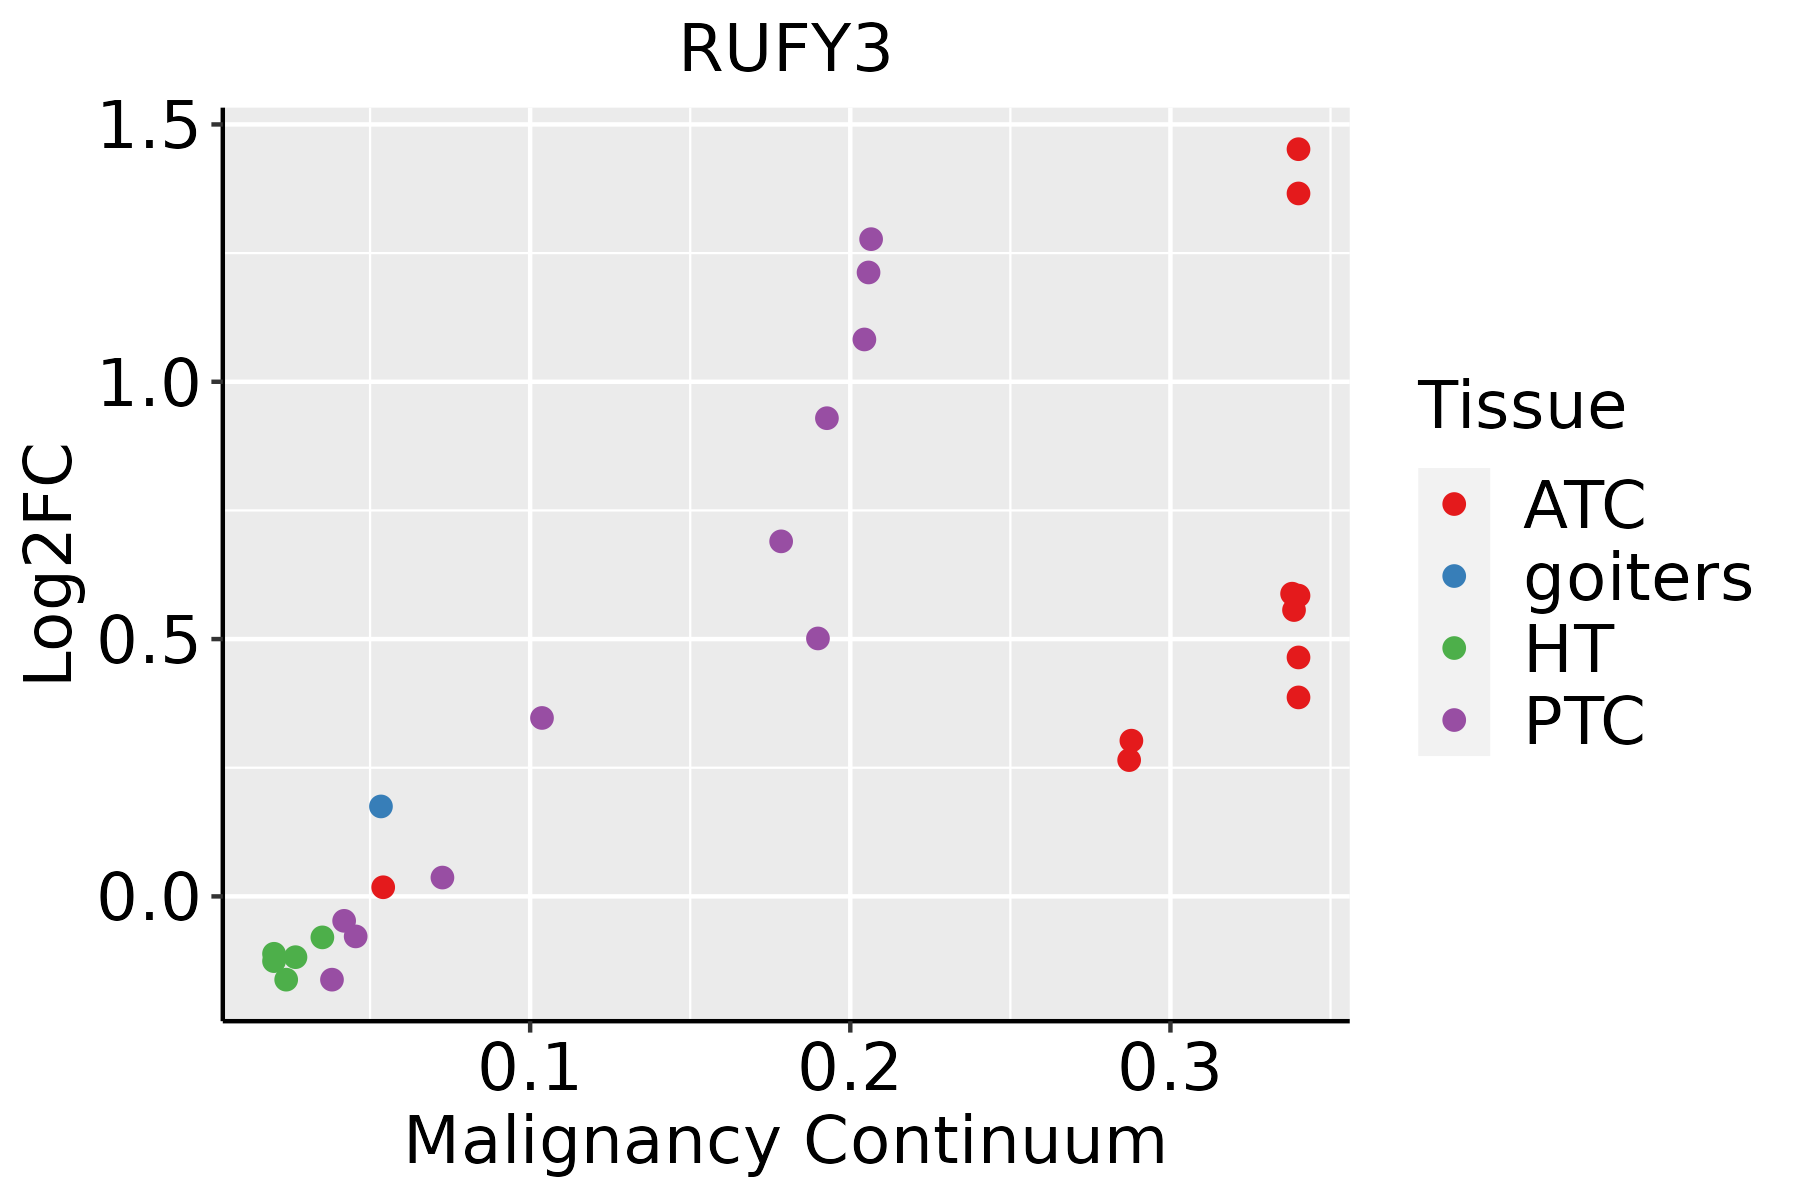 | ATC: Anaplastic thyroid cancer |
| HT: Hashimoto's thyroiditis |
| PTC: Papillary thyroid cancer |
| GO ID | Tissue | Disease Stage | Description | Gene Ratio | Bg Ratio | pvalue | p.adjust | Count |
| GO:00486381 | Colorectum | MSS | regulation of developmental growth | 84/3467 | 330/18723 | 1.01e-03 | 1.01e-02 | 84 |
| GO:00486391 | Colorectum | MSS | positive regulation of developmental growth | 49/3467 | 174/18723 | 1.17e-03 | 1.13e-02 | 49 |
| GO:00459272 | Colorectum | MSS | positive regulation of growth | 68/3467 | 259/18723 | 1.24e-03 | 1.19e-02 | 68 |
| GO:00303072 | Colorectum | MSS | positive regulation of cell growth | 47/3467 | 166/18723 | 1.29e-03 | 1.23e-02 | 47 |
| GO:00083611 | Colorectum | MSS | regulation of cell size | 50/3467 | 181/18723 | 1.65e-03 | 1.49e-02 | 50 |
| GO:00485881 | Colorectum | MSS | developmental cell growth | 61/3467 | 234/18723 | 2.56e-03 | 2.03e-02 | 61 |
| GO:00605601 | Colorectum | MSS | developmental growth involved in morphogenesis | 61/3467 | 234/18723 | 2.56e-03 | 2.03e-02 | 61 |
| GO:00507701 | Colorectum | MSS | regulation of axonogenesis | 43/3467 | 154/18723 | 2.69e-03 | 2.12e-02 | 43 |
| GO:00109771 | Colorectum | MSS | negative regulation of neuron projection development | 39/3467 | 137/18723 | 2.86e-03 | 2.22e-02 | 39 |
| GO:00486751 | Colorectum | MSS | axon extension | 35/3467 | 120/18723 | 2.95e-03 | 2.28e-02 | 35 |
| GO:00305161 | Colorectum | MSS | regulation of axon extension | 29/3467 | 95/18723 | 3.13e-03 | 2.38e-02 | 29 |
| GO:20001142 | Colorectum | MSS | regulation of establishment of cell polarity | 10/3467 | 22/18723 | 3.42e-03 | 2.56e-02 | 10 |
| GO:0050768 | Colorectum | MSS | negative regulation of neurogenesis | 39/3467 | 140/18723 | 4.30e-03 | 3.07e-02 | 39 |
| GO:0051961 | Colorectum | MSS | negative regulation of nervous system development | 40/3467 | 145/18723 | 4.66e-03 | 3.27e-02 | 40 |
| GO:0050769 | Colorectum | MSS | positive regulation of neurogenesis | 57/3467 | 225/18723 | 6.60e-03 | 4.38e-02 | 57 |
| GO:0051960 | Colorectum | MSS | regulation of nervous system development | 103/3467 | 443/18723 | 6.68e-03 | 4.38e-02 | 103 |
| GO:1990138 | Colorectum | MSS | neuron projection extension | 45/3467 | 172/18723 | 8.06e-03 | 4.91e-02 | 45 |
| GO:00070154 | Colorectum | FAP | actin filament organization | 125/2622 | 442/18723 | 1.97e-15 | 3.03e-12 | 125 |
| GO:00325353 | Colorectum | FAP | regulation of cellular component size | 99/2622 | 383/18723 | 4.53e-10 | 1.16e-07 | 99 |
| GO:00071633 | Colorectum | FAP | establishment or maintenance of cell polarity | 64/2622 | 218/18723 | 2.83e-09 | 5.07e-07 | 64 |
| Hugo Symbol | Variant Class | Variant Classification | dbSNP RS | HGVSc | HGVSp | HGVSp Short | SWISSPROT | BIOTYPE | SIFT | PolyPhen | Tumor Sample Barcode | Tissue | Histology | Sex | Age | Stage | Therapy Types | Drugs | Outcome |
| RUFY3 | SNV | Missense_Mutation | | c.10C>G | p.Leu4Val | p.L4V | Q7L099 | protein_coding | deleterious_low_confidence(0.01) | probably_damaging(0.986) | TCGA-A2-A04T-01 | Breast | breast invasive carcinoma | Female | <65 | I/II | Chemotherapy | cyclophosphamide | SD |
| RUFY3 | SNV | Missense_Mutation | novel | c.1408G>T | p.Asp470Tyr | p.D470Y | Q7L099 | protein_coding | deleterious(0) | possibly_damaging(0.863) | TCGA-A2-A25A-01 | Breast | breast invasive carcinoma | Female | <65 | I/II | Unspecific | Cytoxan | SD |
| RUFY3 | SNV | Missense_Mutation | | c.1309G>T | p.Ala437Ser | p.A437S | Q7L099 | protein_coding | tolerated(0.41) | benign(0.023) | TCGA-A8-A09A-01 | Breast | breast invasive carcinoma | Female | <65 | I/II | Hormone Therapy | tamoxiphen | SD |
| RUFY3 | SNV | Missense_Mutation | rs748059452 | c.754N>A | p.Glu252Lys | p.E252K | Q7L099 | protein_coding | tolerated(0.29) | probably_damaging(0.956) | TCGA-B6-A0IK-01 | Breast | breast invasive carcinoma | Female | <65 | III/IV | Unknown | Unknown | PD |
| RUFY3 | SNV | Missense_Mutation | | c.1065N>T | p.Leu355Phe | p.L355F | Q7L099 | protein_coding | tolerated(0.06) | probably_damaging(0.982) | TCGA-D8-A1JK-01 | Breast | breast invasive carcinoma | Female | >=65 | I/II | Unknown | Unknown | SD |
| RUFY3 | SNV | Missense_Mutation | | c.1078G>A | p.Glu360Lys | p.E360K | Q7L099 | protein_coding | deleterious(0) | probably_damaging(1) | TCGA-EW-A1J5-01 | Breast | breast invasive carcinoma | Female | <65 | I/II | Chemotherapy | adriamycin | SD |
| RUFY3 | SNV | Missense_Mutation | novel | c.41C>T | p.Thr14Ile | p.T14I | Q7L099 | protein_coding | deleterious(0) | probably_damaging(0.994) | TCGA-2W-A8YY-01 | Cervix | cervical & endocervical cancer | Female | <65 | I/II | Chemotherapy | cisplatin | CR |
| RUFY3 | SNV | Missense_Mutation | novel | c.1095G>A | p.Met365Ile | p.M365I | Q7L099 | protein_coding | tolerated(0.18) | benign(0) | TCGA-2W-A8YY-01 | Cervix | cervical & endocervical cancer | Female | <65 | I/II | Chemotherapy | cisplatin | CR |
| RUFY3 | SNV | Missense_Mutation | novel | c.209N>C | p.Met70Thr | p.M70T | Q7L099 | protein_coding | tolerated(0.47) | benign(0.115) | TCGA-EA-A410-01 | Cervix | cervical & endocervical cancer | Female | <65 | I/II | Unknown | Unknown | SD |
| RUFY3 | SNV | Missense_Mutation | | c.1372N>C | p.Glu458Gln | p.E458Q | Q7L099 | protein_coding | tolerated(0.06) | benign(0.027) | TCGA-EK-A3GK-01 | Cervix | cervical & endocervical cancer | Female | <65 | I/II | Unknown | Unknown | SD |


