
|
|||||
|
 | |
| |
| |
| |
| |
| |
|
Gene: RSL24D1 |
Gene summary for RSL24D1 |
| Gene information | Species | Human | Gene symbol | RSL24D1 | Gene ID | 51187 |
| Gene name | ribosomal L24 domain containing 1 | |
| Gene Alias | C15orf15 | |
| Cytomap | 15q21.3 | |
| Gene Type | protein-coding | GO ID | GO:0006412 | UniProtAcc | A0A024R5U8 |
Top |
Malignant transformation analysis |
| Identification of the aberrant gene expression in precancerous and cancerous lesions by comparing the gene expression of stem-like cells in diseased tissues with normal stem cells |
| Entrez ID | Symbol | Replicates | Species | Organ | Tissue | Adj P-value | Log2FC | Malignancy |
| 51187 | RSL24D1 | GSM4909285 | Human | Breast | IDC | 9.26e-08 | -2.40e-01 | 0.21 |
| 51187 | RSL24D1 | GSM4909286 | Human | Breast | IDC | 3.83e-14 | -2.65e-01 | 0.1081 |
| 51187 | RSL24D1 | GSM4909287 | Human | Breast | IDC | 5.98e-03 | -3.46e-01 | 0.2057 |
| 51187 | RSL24D1 | GSM4909291 | Human | Breast | IDC | 8.13e-20 | -7.50e-01 | 0.1753 |
| 51187 | RSL24D1 | GSM4909293 | Human | Breast | IDC | 2.72e-12 | -3.79e-01 | 0.1581 |
| 51187 | RSL24D1 | GSM4909294 | Human | Breast | IDC | 5.26e-09 | -3.31e-01 | 0.2022 |
| 51187 | RSL24D1 | GSM4909296 | Human | Breast | IDC | 1.50e-38 | -7.21e-01 | 0.1524 |
| 51187 | RSL24D1 | GSM4909297 | Human | Breast | IDC | 5.69e-27 | -2.71e-01 | 0.1517 |
| 51187 | RSL24D1 | GSM4909301 | Human | Breast | IDC | 1.55e-22 | -6.85e-01 | 0.1577 |
| 51187 | RSL24D1 | GSM4909302 | Human | Breast | IDC | 2.85e-24 | -6.94e-01 | 0.1545 |
| 51187 | RSL24D1 | GSM4909304 | Human | Breast | IDC | 1.59e-10 | -4.65e-01 | 0.1636 |
| 51187 | RSL24D1 | GSM4909307 | Human | Breast | IDC | 9.93e-04 | -3.37e-01 | 0.1569 |
| 51187 | RSL24D1 | GSM4909311 | Human | Breast | IDC | 5.57e-54 | -6.97e-01 | 0.1534 |
| 51187 | RSL24D1 | GSM4909312 | Human | Breast | IDC | 3.55e-13 | -1.68e-01 | 0.1552 |
| 51187 | RSL24D1 | GSM4909316 | Human | Breast | IDC | 2.28e-03 | -4.66e-01 | 0.21 |
| 51187 | RSL24D1 | GSM4909317 | Human | Breast | IDC | 3.52e-04 | -3.78e-01 | 0.1355 |
| 51187 | RSL24D1 | GSM4909318 | Human | Breast | IDC | 1.31e-02 | -5.80e-01 | 0.2031 |
| 51187 | RSL24D1 | GSM4909319 | Human | Breast | IDC | 2.45e-65 | -8.14e-01 | 0.1563 |
| 51187 | RSL24D1 | GSM4909320 | Human | Breast | IDC | 2.53e-17 | -8.46e-01 | 0.1575 |
| 51187 | RSL24D1 | GSM4909321 | Human | Breast | IDC | 6.78e-25 | -5.11e-01 | 0.1559 |
| Page: 1 2 3 4 5 6 7 8 9 10 11 12 13 |
| Tissue | Expression Dynamics | Abbreviation |
| Breast | 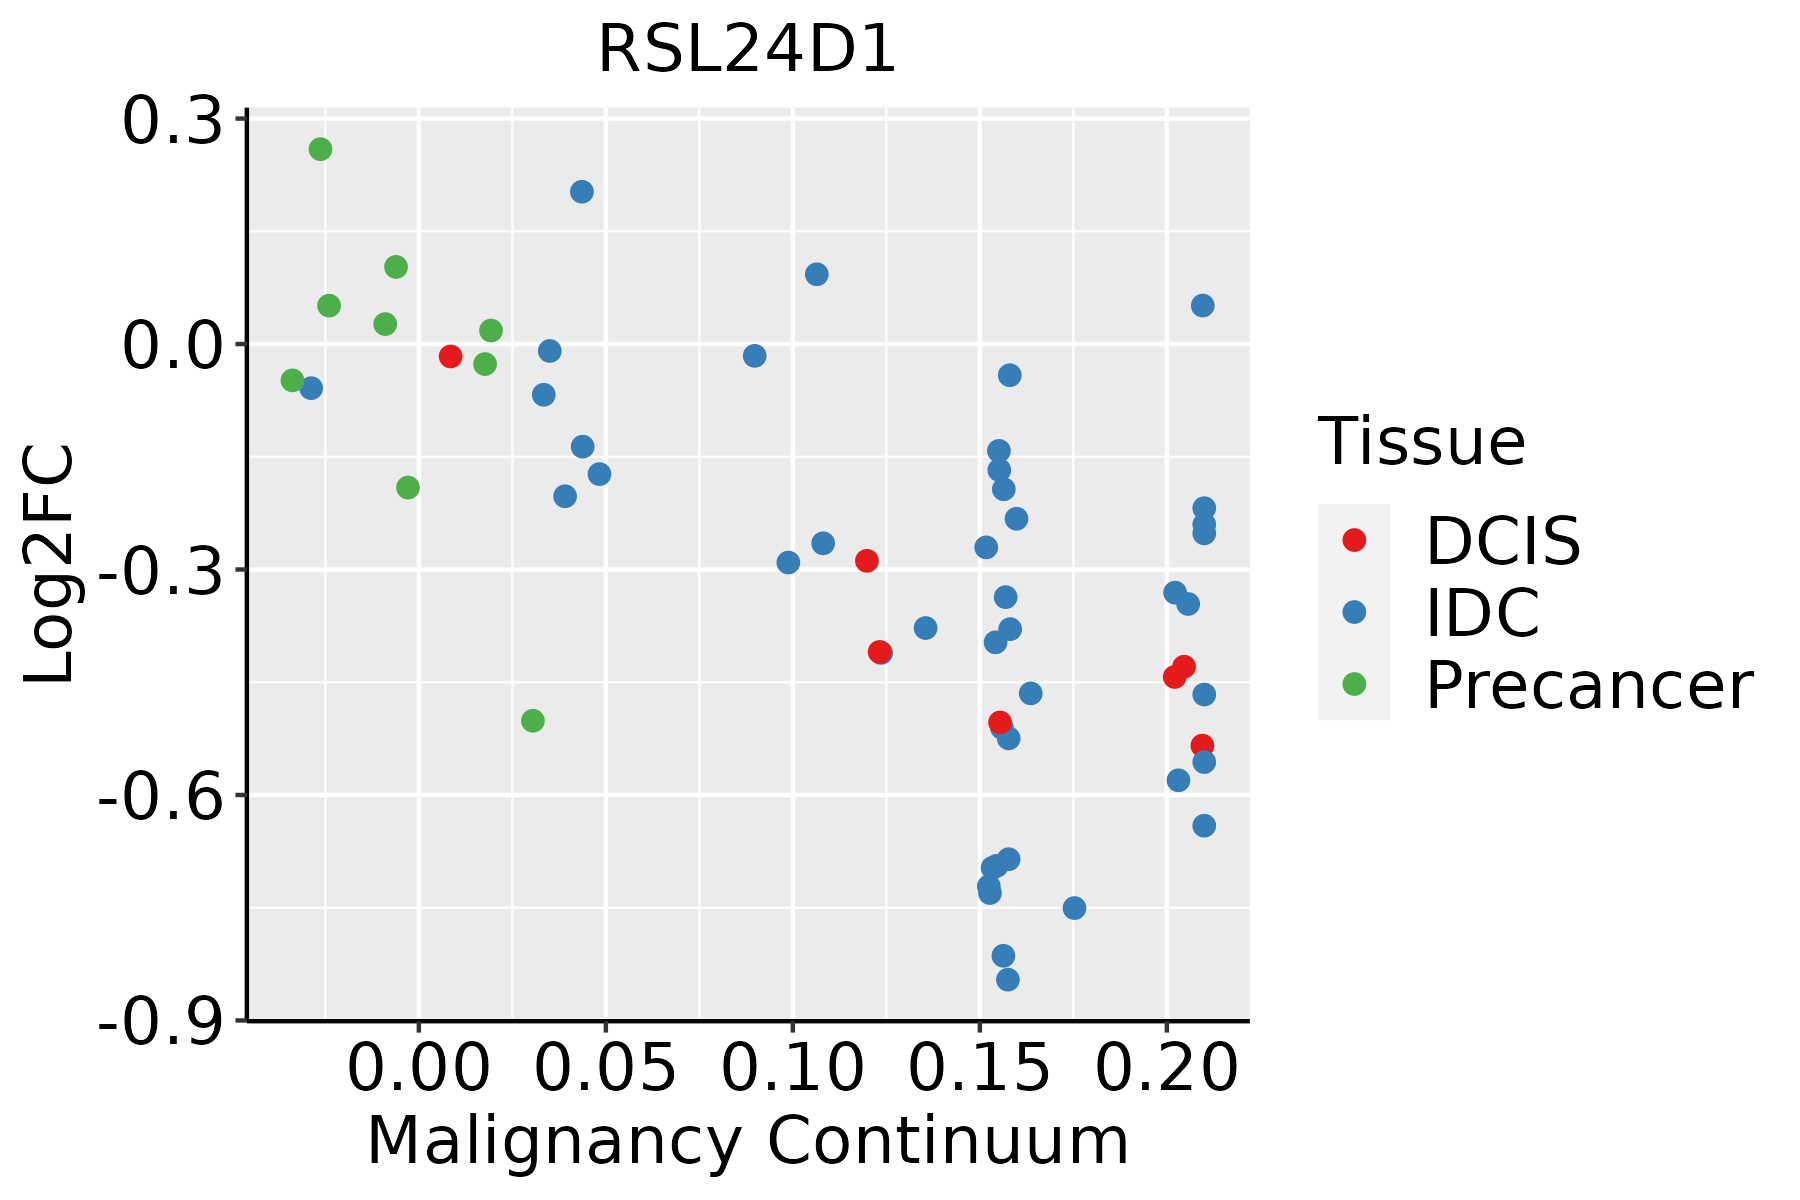 | IDC: Invasive ductal carcinoma |
| DCIS: Ductal carcinoma in situ | ||
| Precancer(BRCA1-mut): Precancerous lesion from BRCA1 mutation carriers | ||
| Cervix | 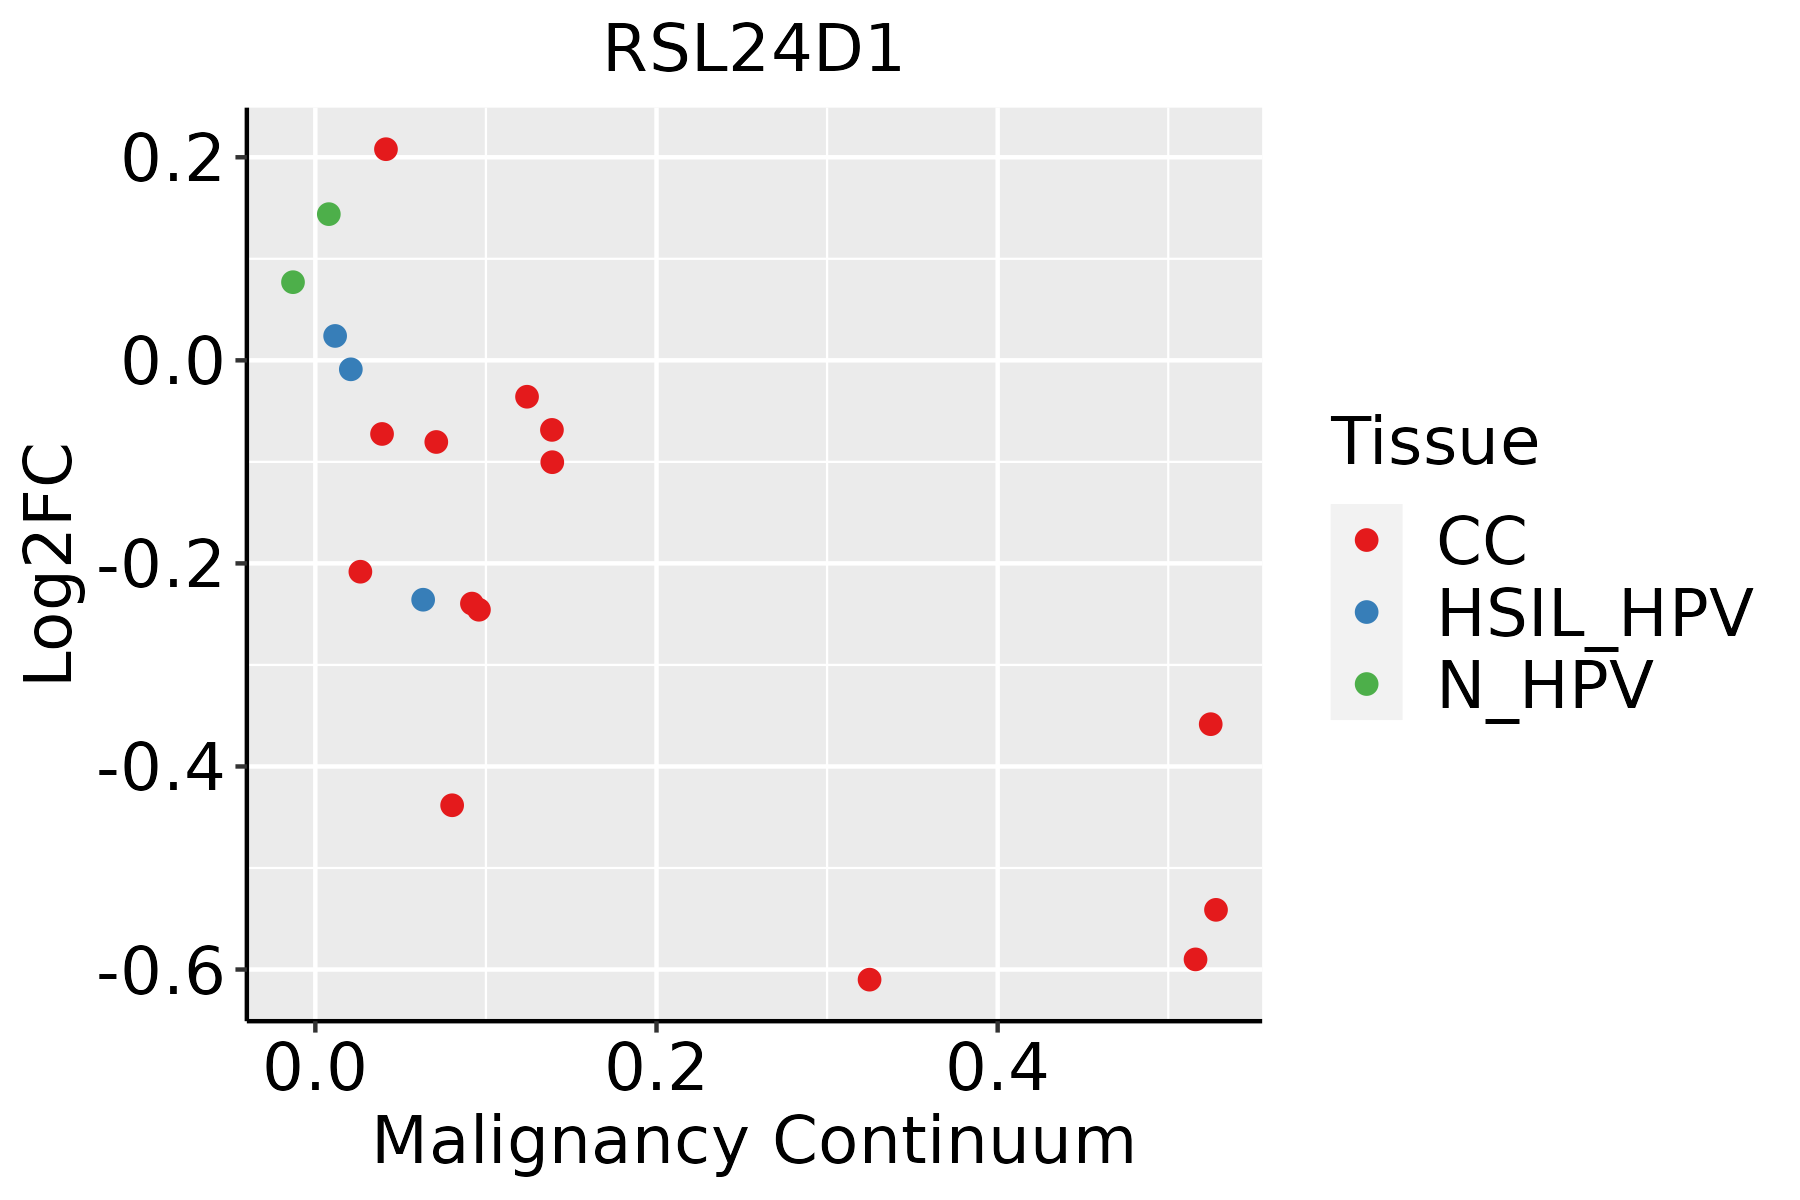 | CC: Cervix cancer |
| HSIL_HPV: HPV-infected high-grade squamous intraepithelial lesions | ||
| N_HPV: HPV-infected normal cervix | ||
| Endometrium | 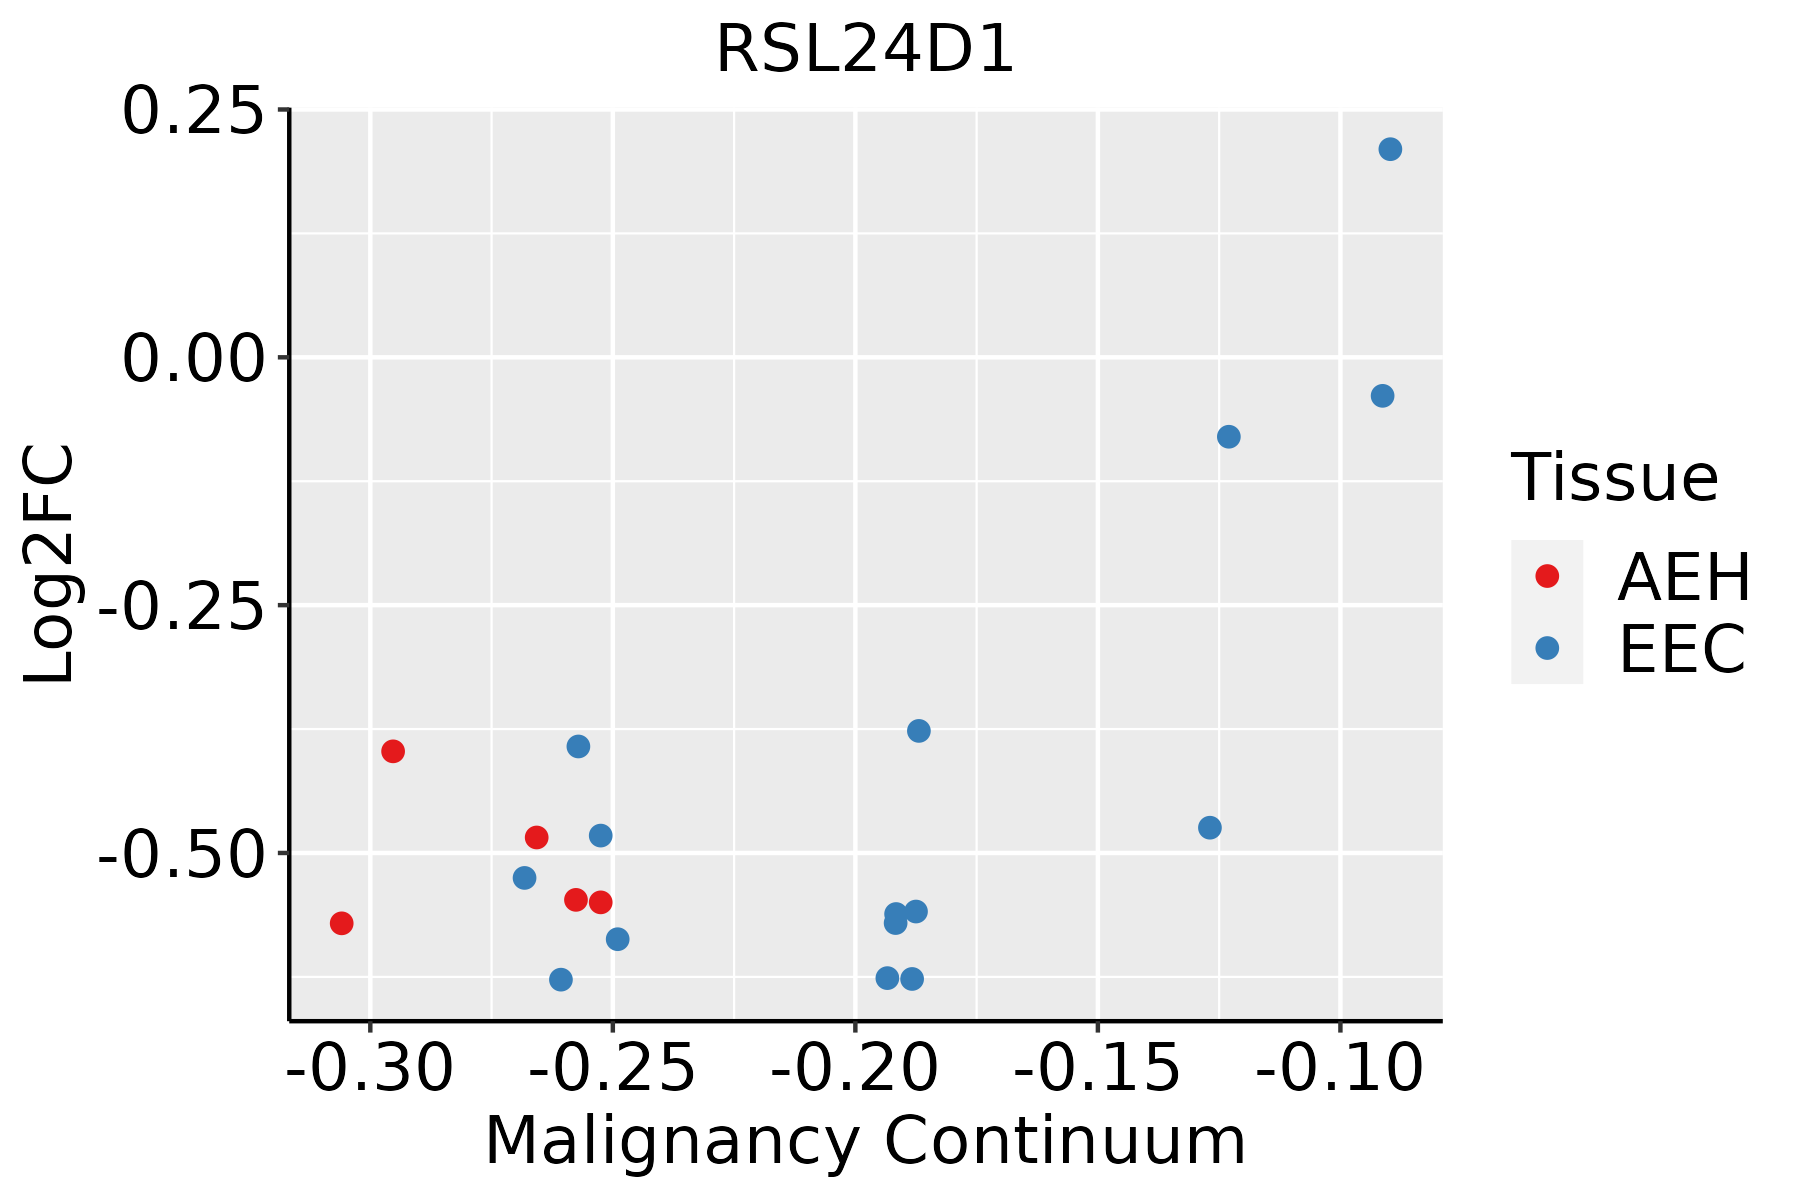 | AEH: Atypical endometrial hyperplasia |
| EEC: Endometrioid Cancer | ||
| Esophagus |  | ESCC: Esophageal squamous cell carcinoma |
| HGIN: High-grade intraepithelial neoplasias | ||
| LGIN: Low-grade intraepithelial neoplasias | ||
| GC |  | CAG: Chronic atrophic gastritis |
| CAG with IM: Chronic atrophic gastritis with intestinal metaplasia | ||
| CSG: Chronic superficial gastritis | ||
| GC: Gastric cancer | ||
| SIM: Severe intestinal metaplasia | ||
| WIM: Wild intestinal metaplasia | ||
| Liver | 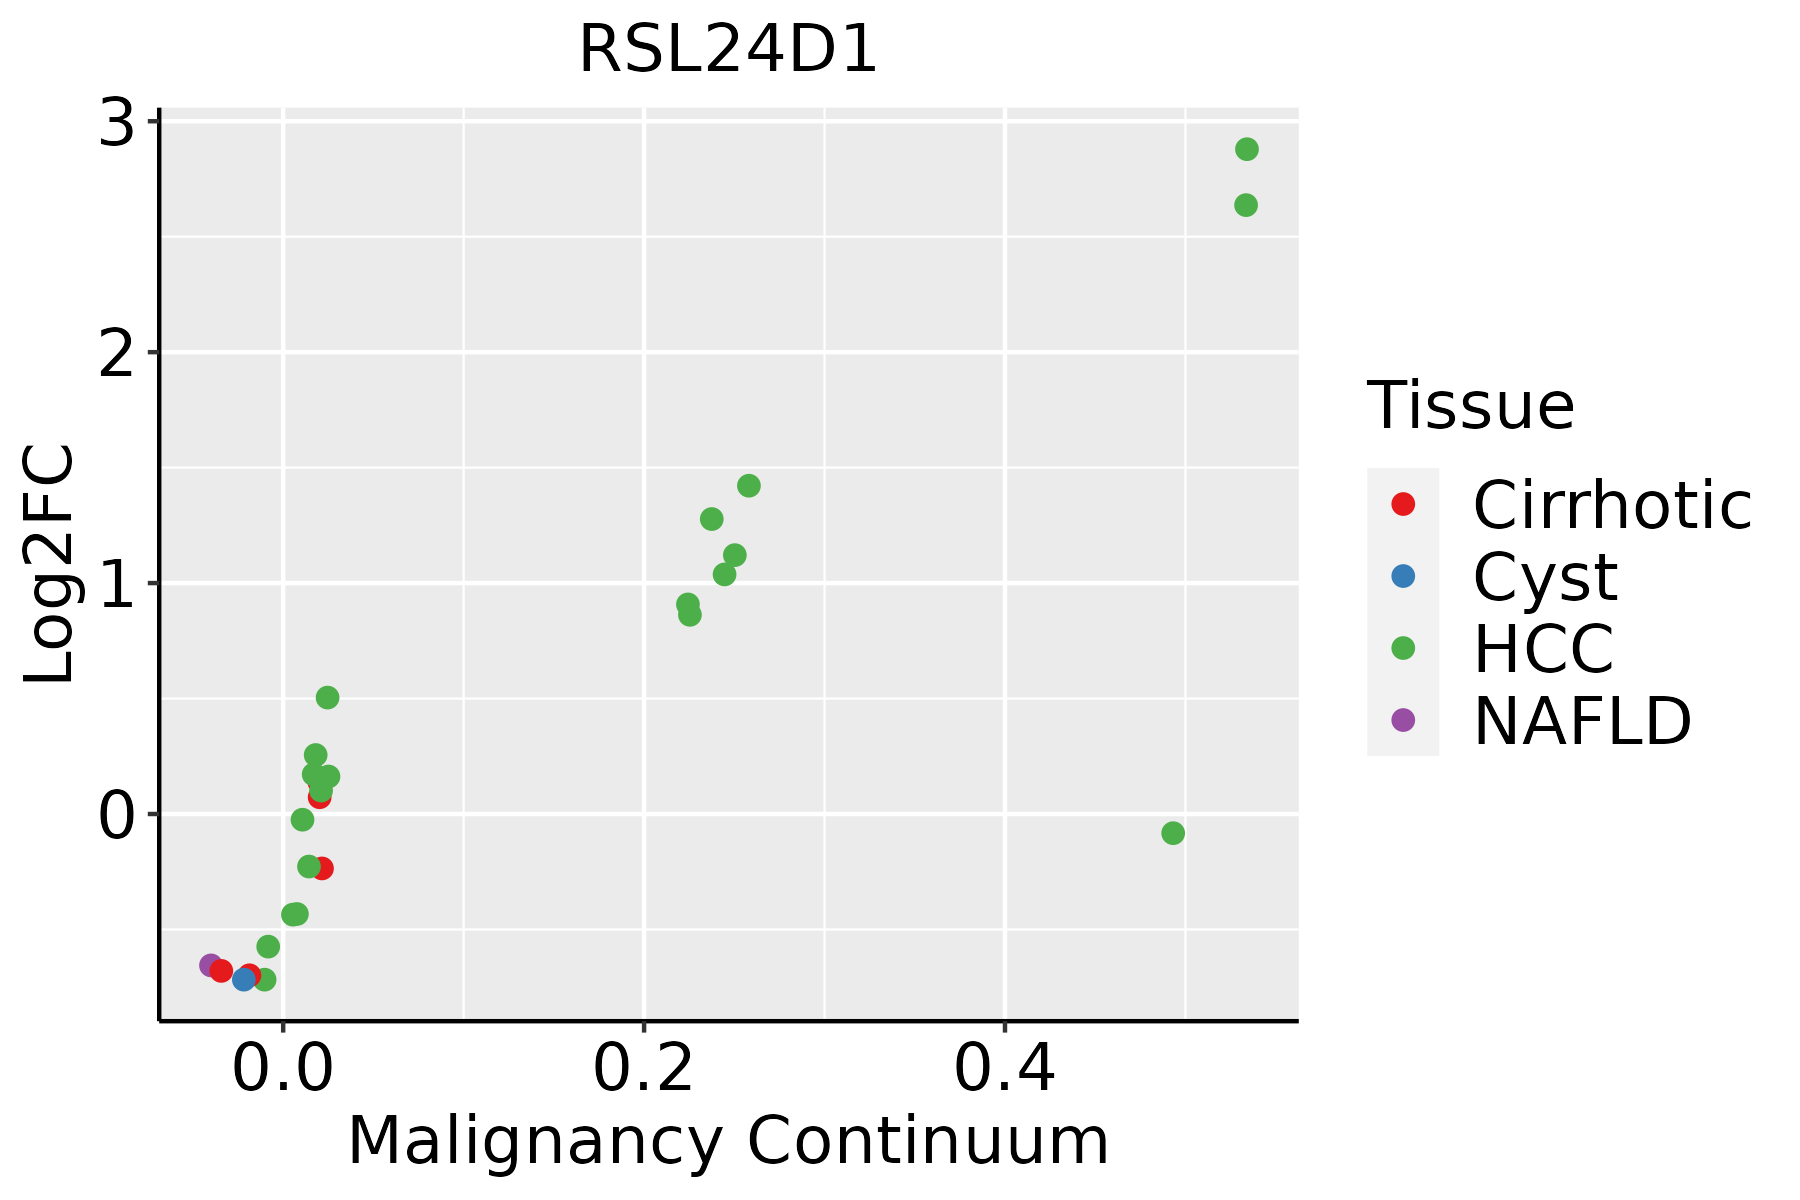 | HCC: Hepatocellular carcinoma |
| NAFLD: Non-alcoholic fatty liver disease | ||
| Oral Cavity | 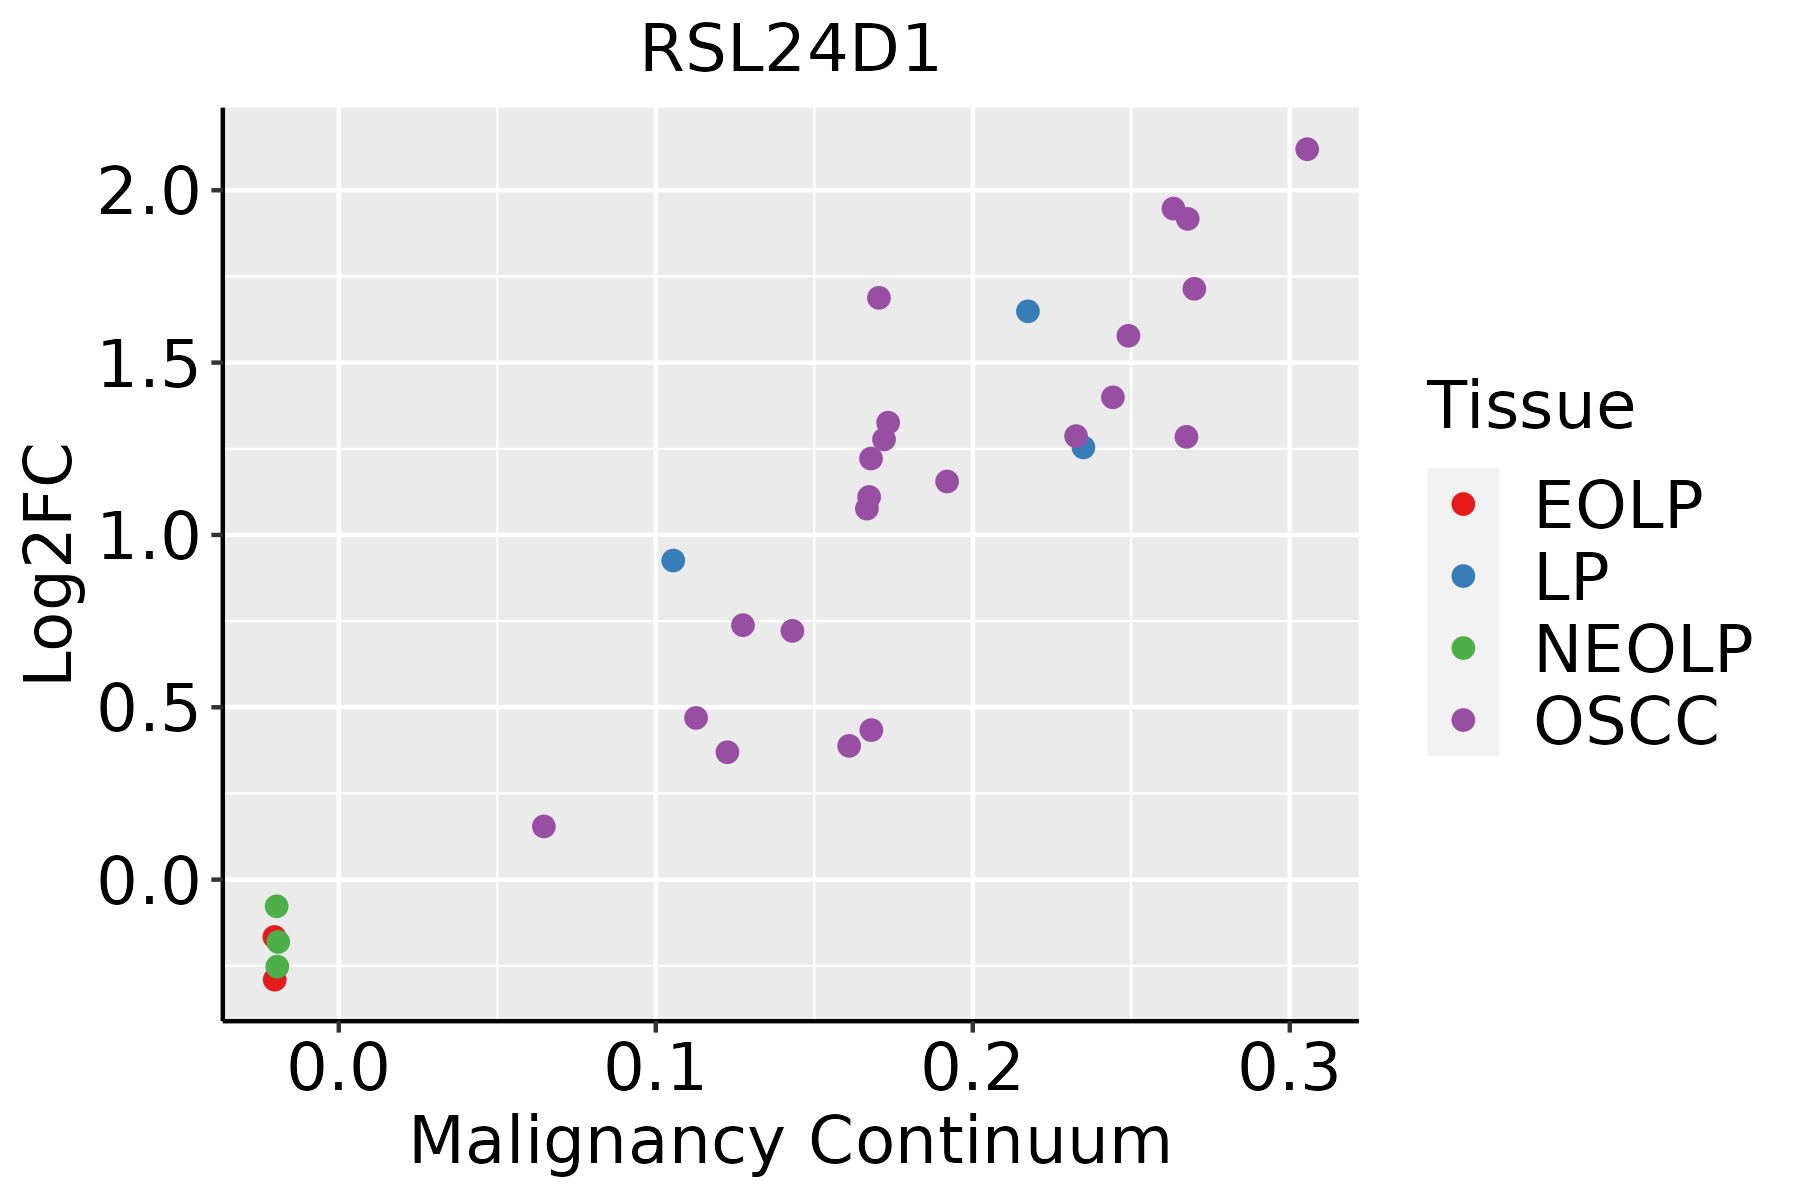 | EOLP: Erosive Oral lichen planus |
| LP: leukoplakia | ||
| NEOLP: Non-erosive oral lichen planus | ||
| OSCC: Oral squamous cell carcinoma | ||
| Prostate |  | BPH: Benign Prostatic Hyperplasia |
| Skin | 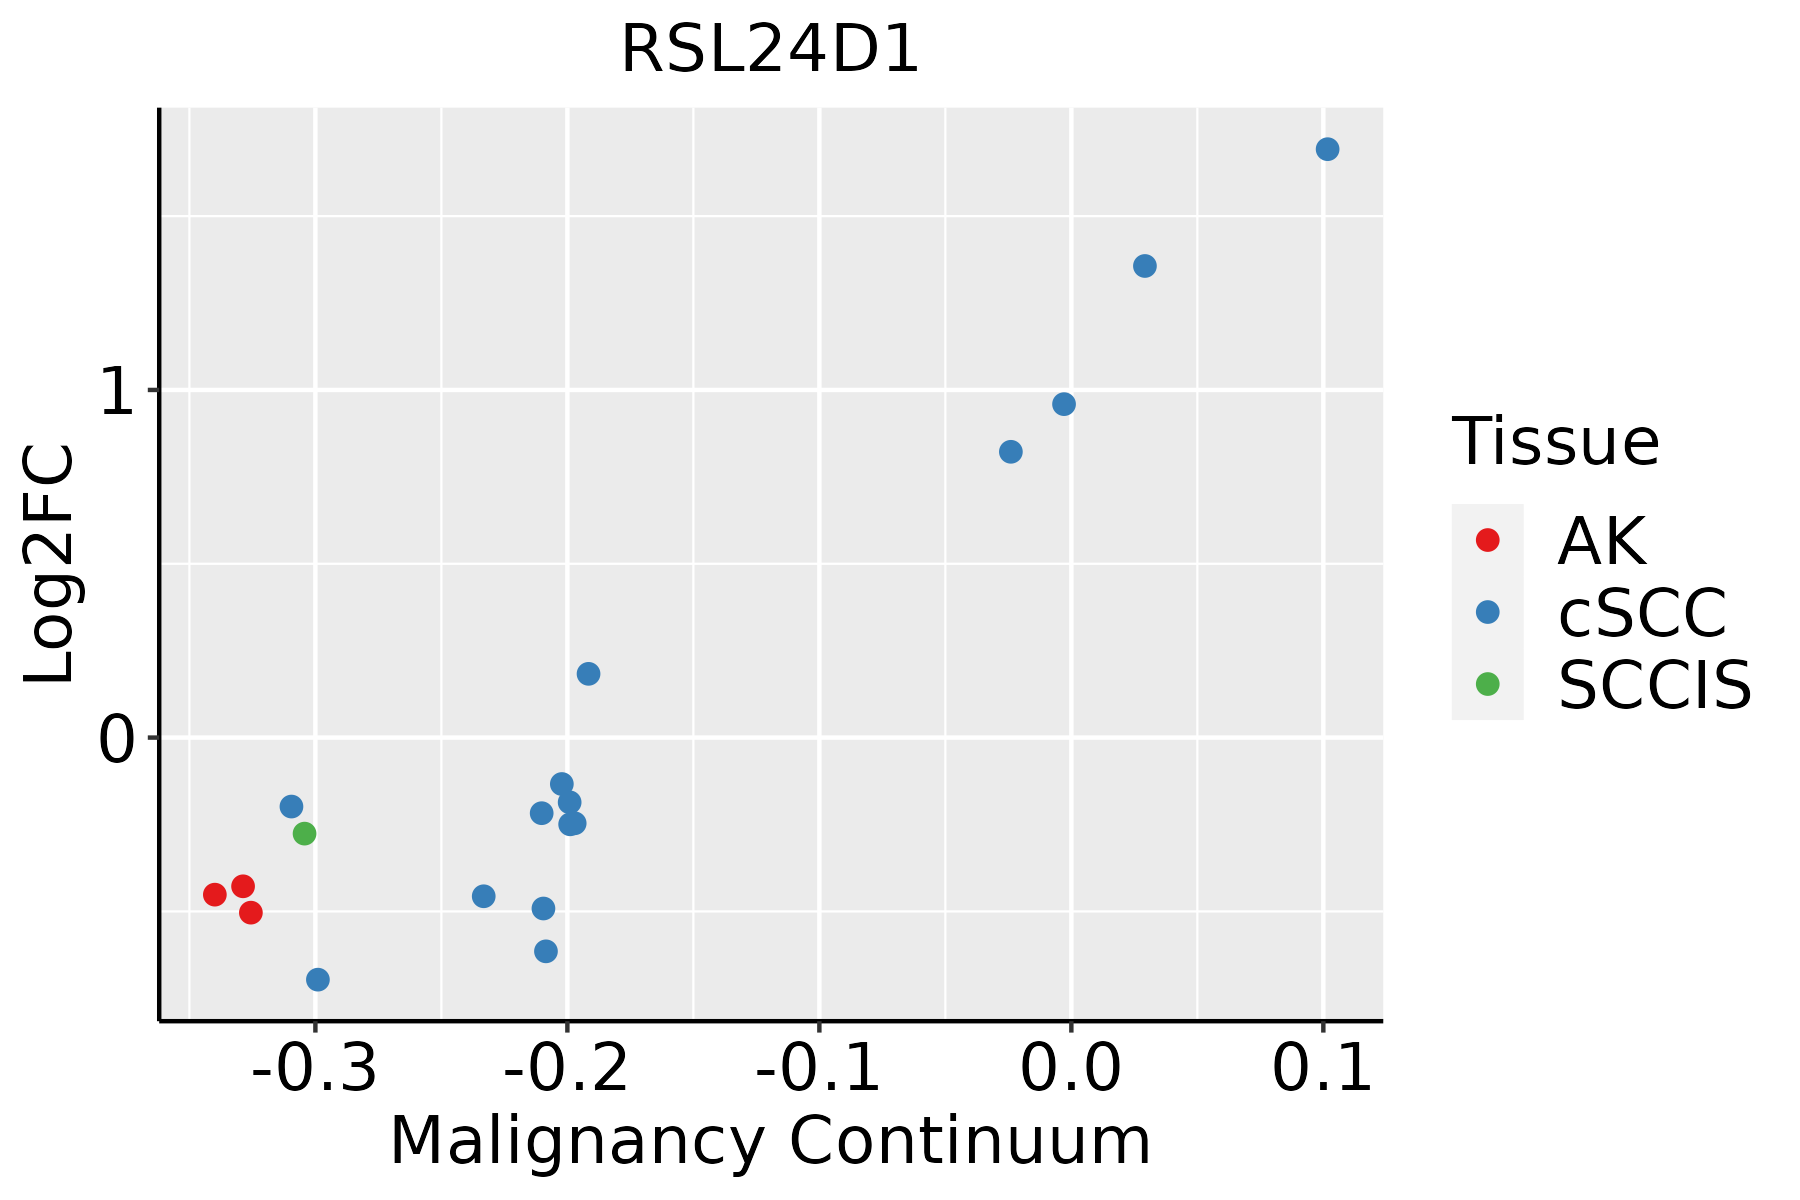 | AK: Actinic keratosis |
| cSCC: Cutaneous squamous cell carcinoma | ||
| SCCIS:squamous cell carcinoma in situ | ||
| Thyroid | 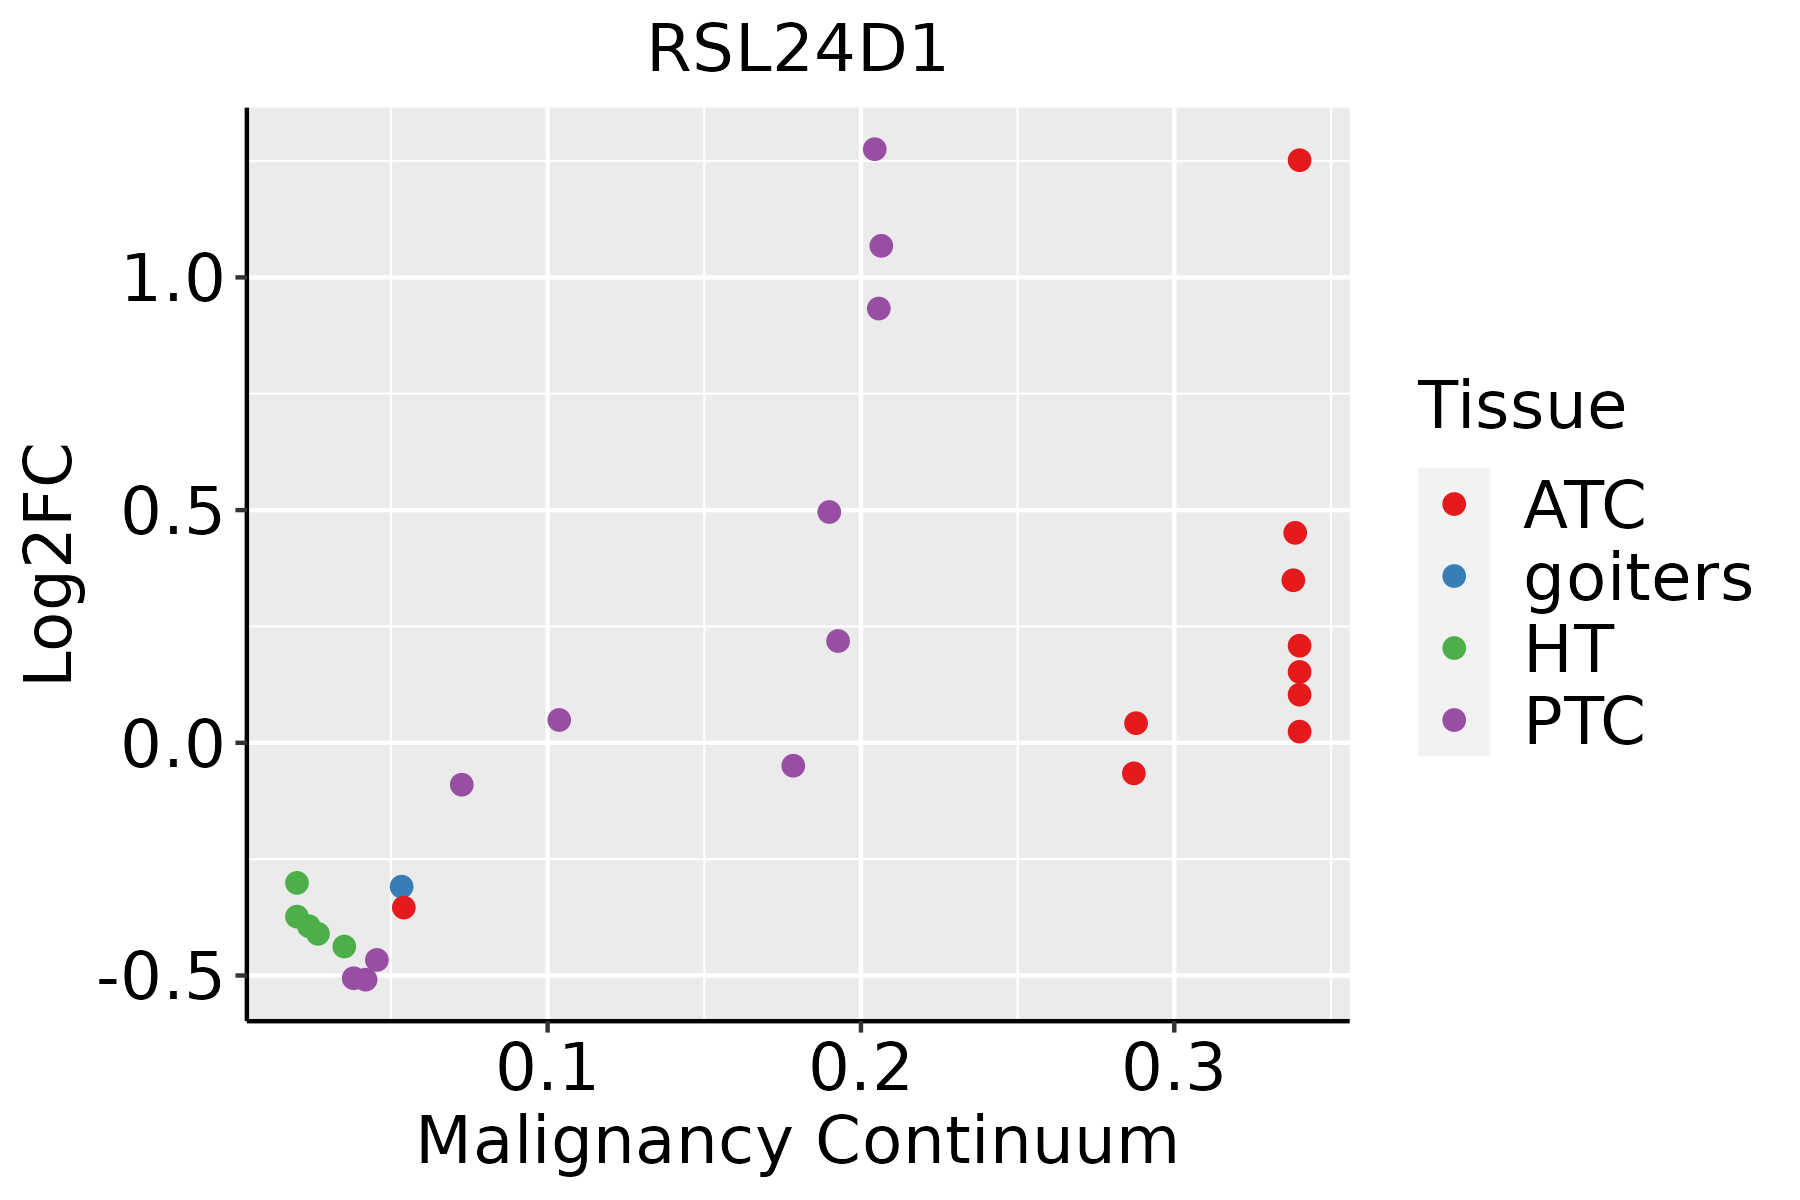 | ATC: Anaplastic thyroid cancer |
| HT: Hashimoto's thyroiditis | ||
| PTC: Papillary thyroid cancer |
| ∗log2FC in expression of this searched gene in stem-like cells from each diseased tissue sample relative to stem-like cells in normal samples in each tissue plotted against the malignancy continuum. Samples are colored based on if they are from different disease stage. |
Top |
Malignant transformation related pathway analysis |
| Find out the enriched GO biological processes and KEGG pathways involved in transition from healthy to precancer to cancer |
| Tissue | Disease Stage | Enriched GO biological Processes |
| Colorectum | AD |  |
| Colorectum | SER |  |
| Colorectum | MSS |  |
| Colorectum | MSI-H |  |
| Colorectum | FAP |  |
| ∗Top 15 enriched GO BP terms are showed in the bar plot of each disease state in each tissue. Each row represents a significant GO biological process which is colored according to the -log10(p.adjust). |
| Page: 1 2 3 4 5 6 7 8 9 |
| GO ID | Tissue | Disease Stage | Description | Gene Ratio | Bg Ratio | pvalue | p.adjust | Count |
| GO:004227326 | Esophagus | HGIN | ribosomal large subunit biogenesis | 34/2587 | 72/18723 | 8.82e-12 | 1.06e-09 | 34 |
| GO:0022613111 | Esophagus | ESCC | ribonucleoprotein complex biogenesis | 365/8552 | 463/18723 | 1.74e-49 | 1.11e-45 | 365 |
| GO:0042254111 | Esophagus | ESCC | ribosome biogenesis | 252/8552 | 299/18723 | 3.27e-44 | 1.04e-40 | 252 |
| GO:0042273111 | Esophagus | ESCC | ribosomal large subunit biogenesis | 65/8552 | 72/18723 | 1.53e-15 | 9.82e-14 | 65 |
| GO:002261312 | Liver | Cirrhotic | ribonucleoprotein complex biogenesis | 231/4634 | 463/18723 | 3.28e-32 | 6.86e-29 | 231 |
| GO:004225412 | Liver | Cirrhotic | ribosome biogenesis | 154/4634 | 299/18723 | 1.18e-23 | 6.72e-21 | 154 |
| GO:004227312 | Liver | Cirrhotic | ribosomal large subunit biogenesis | 47/4634 | 72/18723 | 4.20e-13 | 3.29e-11 | 47 |
| GO:002261322 | Liver | HCC | ribonucleoprotein complex biogenesis | 355/7958 | 463/18723 | 7.76e-52 | 4.92e-48 | 355 |
| GO:004225422 | Liver | HCC | ribosome biogenesis | 246/7958 | 299/18723 | 4.99e-46 | 1.58e-42 | 246 |
| GO:004227322 | Liver | HCC | ribosomal large subunit biogenesis | 64/7958 | 72/18723 | 2.31e-16 | 2.03e-14 | 64 |
| GO:002261332 | Liver | Cyst | ribonucleoprotein complex biogenesis | 45/496 | 463/18723 | 5.09e-14 | 2.17e-11 | 45 |
| GO:004225432 | Liver | Cyst | ribosome biogenesis | 33/496 | 299/18723 | 4.39e-12 | 1.44e-09 | 33 |
| GO:004227332 | Liver | Cyst | ribosomal large subunit biogenesis | 16/496 | 72/18723 | 4.86e-11 | 1.22e-08 | 16 |
| GO:002261320 | Oral cavity | OSCC | ribonucleoprotein complex biogenesis | 333/7305 | 463/18723 | 8.28e-48 | 5.24e-44 | 333 |
| GO:004225420 | Oral cavity | OSCC | ribosome biogenesis | 230/7305 | 299/18723 | 3.22e-41 | 6.80e-38 | 230 |
| GO:004227320 | Oral cavity | OSCC | ribosomal large subunit biogenesis | 61/7305 | 72/18723 | 1.52e-15 | 1.06e-13 | 61 |
| GO:0022613110 | Oral cavity | LP | ribonucleoprotein complex biogenesis | 259/4623 | 463/18723 | 7.20e-48 | 2.25e-44 | 259 |
| GO:0042254110 | Oral cavity | LP | ribosome biogenesis | 173/4623 | 299/18723 | 8.97e-35 | 1.41e-31 | 173 |
| GO:0042273110 | Oral cavity | LP | ribosomal large subunit biogenesis | 53/4623 | 72/18723 | 3.25e-18 | 5.82e-16 | 53 |
| GO:002261326 | Oral cavity | EOLP | ribonucleoprotein complex biogenesis | 96/2218 | 463/18723 | 2.34e-08 | 9.81e-07 | 96 |
| Page: 1 2 3 4 5 |
| Pathway ID | Tissue | Disease Stage | Description | Gene Ratio | Bg Ratio | pvalue | p.adjust | qvalue | Count |
| hsa0517118 | Breast | Precancer | Coronavirus disease - COVID-19 | 81/684 | 232/8465 | 3.74e-32 | 2.36e-30 | 1.81e-30 | 81 |
| hsa0517119 | Breast | Precancer | Coronavirus disease - COVID-19 | 81/684 | 232/8465 | 3.74e-32 | 2.36e-30 | 1.81e-30 | 81 |
| hsa0301024 | Breast | IDC | Ribosome | 83/867 | 167/8465 | 6.07e-39 | 9.87e-37 | 7.38e-37 | 83 |
| hsa0517124 | Breast | IDC | Coronavirus disease - COVID-19 | 86/867 | 232/8465 | 1.50e-28 | 9.72e-27 | 7.27e-27 | 86 |
| hsa0301034 | Breast | IDC | Ribosome | 83/867 | 167/8465 | 6.07e-39 | 9.87e-37 | 7.38e-37 | 83 |
| hsa0517134 | Breast | IDC | Coronavirus disease - COVID-19 | 86/867 | 232/8465 | 1.50e-28 | 9.72e-27 | 7.27e-27 | 86 |
| hsa0301044 | Breast | DCIS | Ribosome | 82/846 | 167/8465 | 8.69e-39 | 1.40e-36 | 1.03e-36 | 82 |
| hsa0517144 | Breast | DCIS | Coronavirus disease - COVID-19 | 86/846 | 232/8465 | 2.42e-29 | 1.56e-27 | 1.15e-27 | 86 |
| hsa0301054 | Breast | DCIS | Ribosome | 82/846 | 167/8465 | 8.69e-39 | 1.40e-36 | 1.03e-36 | 82 |
| hsa0517154 | Breast | DCIS | Coronavirus disease - COVID-19 | 86/846 | 232/8465 | 2.42e-29 | 1.56e-27 | 1.15e-27 | 86 |
| hsa0517120 | Cervix | CC | Coronavirus disease - COVID-19 | 111/1267 | 232/8465 | 1.82e-33 | 5.90e-31 | 3.49e-31 | 111 |
| hsa0301020 | Cervix | CC | Ribosome | 85/1267 | 167/8465 | 3.17e-28 | 5.14e-26 | 3.04e-26 | 85 |
| hsa05171110 | Cervix | CC | Coronavirus disease - COVID-19 | 111/1267 | 232/8465 | 1.82e-33 | 5.90e-31 | 3.49e-31 | 111 |
| hsa03010110 | Cervix | CC | Ribosome | 85/1267 | 167/8465 | 3.17e-28 | 5.14e-26 | 3.04e-26 | 85 |
| hsa0301026 | Endometrium | AEH | Ribosome | 89/1197 | 167/8465 | 1.88e-33 | 6.09e-31 | 4.46e-31 | 89 |
| hsa0517126 | Endometrium | AEH | Coronavirus disease - COVID-19 | 99/1197 | 232/8465 | 5.19e-27 | 3.37e-25 | 2.47e-25 | 99 |
| hsa03010112 | Endometrium | AEH | Ribosome | 89/1197 | 167/8465 | 1.88e-33 | 6.09e-31 | 4.46e-31 | 89 |
| hsa05171112 | Endometrium | AEH | Coronavirus disease - COVID-19 | 99/1197 | 232/8465 | 5.19e-27 | 3.37e-25 | 2.47e-25 | 99 |
| hsa0301027 | Endometrium | EEC | Ribosome | 89/1237 | 167/8465 | 2.55e-32 | 8.39e-30 | 6.26e-30 | 89 |
| hsa0517127 | Endometrium | EEC | Coronavirus disease - COVID-19 | 99/1237 | 232/8465 | 7.43e-26 | 4.89e-24 | 3.65e-24 | 99 |
| Page: 1 2 3 4 |
Top |
Cell-cell communication analysis |
| Identification of potential cell-cell interactions between two cell types and their ligand-receptor pairs for different disease states |
| Ligand | Receptor | LRpair | Pathway | Tissue | Disease Stage |
| Page: 1 |
Top |
Single-cell gene regulatory network inference analysis |
| Find out the significant the regulons (TFs) and the target genes of each regulon across cell types for different disease states |
| TF | Cell Type | Tissue | Disease Stage | Target Gene | RSS | Regulon Activity |
| ∗The dot plots of a searched regulon are shown for all cell subpopulations in each disease state of each tissue based on the regulon specific score inferred using pySCENIC and by calculating the average expression. |
| Page: 1 |
Top |
Somatic mutation of malignant transformation related genes |
| Annotation of somatic variants for genes involved in malignant transformation |
| Hugo Symbol | Variant Class | Variant Classification | dbSNP RS | HGVSc | HGVSp | HGVSp Short | SWISSPROT | BIOTYPE | SIFT | PolyPhen | Tumor Sample Barcode | Tissue | Histology | Sex | Age | Stage | Therapy Types | Drugs | Outcome |
| RSL24D1 | insertion | Frame_Shift_Ins | novel | c.370_371insGAAT | p.Ile124ArgfsTer54 | p.I124Rfs*54 | Q9UHA3 | protein_coding | TCGA-A7-A26I-01 | Breast | breast invasive carcinoma | Female | >=65 | I/II | Chemotherapy | cytoxan | SD | ||
| RSL24D1 | SNV | Missense_Mutation | c.26G>C | p.Cys9Ser | p.C9S | Q9UHA3 | protein_coding | deleterious(0) | benign(0.185) | TCGA-EK-A3GK-01 | Cervix | cervical & endocervical cancer | Female | <65 | I/II | Unknown | Unknown | SD | |
| RSL24D1 | SNV | Missense_Mutation | rs572620938 | c.131N>A | p.Arg44His | p.R44H | Q9UHA3 | protein_coding | tolerated(0.05) | benign(0.036) | TCGA-AA-3947-01 | Colorectum | colon adenocarcinoma | Female | <65 | I/II | Unknown | Unknown | SD |
| RSL24D1 | SNV | Missense_Mutation | rs781511293 | c.441N>T | p.Glu147Asp | p.E147D | Q9UHA3 | protein_coding | tolerated(0.33) | benign(0.001) | TCGA-CA-6718-01 | Colorectum | colon adenocarcinoma | Male | <65 | I/II | Unknown | Unknown | PD |
| RSL24D1 | SNV | Missense_Mutation | rs199758477 | c.308N>A | p.Arg103His | p.R103H | Q9UHA3 | protein_coding | deleterious(0) | possibly_damaging(0.731) | TCGA-AX-A06F-01 | Endometrium | uterine corpus endometrioid carcinoma | Female | <65 | III/IV | Chemotherapy | carboplatin | SD |
| RSL24D1 | SNV | Missense_Mutation | c.320T>G | p.Phe107Cys | p.F107C | Q9UHA3 | protein_coding | deleterious(0.03) | benign(0.062) | TCGA-BS-A0UF-01 | Endometrium | uterine corpus endometrioid carcinoma | Female | >=65 | I/II | Unknown | Unknown | SD | |
| RSL24D1 | SNV | Missense_Mutation | novel | c.166N>T | p.Arg56Trp | p.R56W | Q9UHA3 | protein_coding | deleterious(0.02) | benign(0.074) | TCGA-EO-A22U-01 | Endometrium | uterine corpus endometrioid carcinoma | Female | >=65 | I/II | Unknown | Unknown | SD |
| RSL24D1 | SNV | Missense_Mutation | rs754119174 | c.130N>T | p.Arg44Cys | p.R44C | Q9UHA3 | protein_coding | deleterious(0.02) | benign(0.015) | TCGA-FI-A2D5-01 | Endometrium | uterine corpus endometrioid carcinoma | Female | <65 | III/IV | Chemotherapy | carboplatinum | PD |
| RSL24D1 | insertion | Frame_Shift_Ins | novel | c.219_220insA | p.Arg74ThrfsTer2 | p.R74Tfs*2 | Q9UHA3 | protein_coding | TCGA-B5-A3FC-01 | Endometrium | uterine corpus endometrioid carcinoma | Female | <65 | I/II | Unknown | Unknown | SD | ||
| RSL24D1 | SNV | Missense_Mutation | c.350N>G | p.Glu117Gly | p.E117G | Q9UHA3 | protein_coding | deleterious(0.03) | benign(0.001) | TCGA-ED-A7XO-01 | Liver | liver hepatocellular carcinoma | Male | <65 | III/IV | Unknown | Unknown | PD |
| Page: 1 2 |
Top |
Related drugs of malignant transformation related genes |
| Identification of chemicals and drugs interact with genes involved in malignant transfromation |
| (DGIdb 4.0) |
| Entrez ID | Symbol | Category | Interaction Types | Drug Claim Name | Drug Name | PMIDs |
| Page: 1 |

Copyright 2023-Present -The University of Texas Health Science Center at Houston |