
|
|||||
|
 | |
| |
| |
| |
| |
| |
|
Gene: RRM2B |
Gene summary for RRM2B |
| Gene information | Species | Human | Gene symbol | RRM2B | Gene ID | 50484 |
| Gene name | ribonucleotide reductase regulatory TP53 inducible subunit M2B | |
| Gene Alias | MTDPS8A | |
| Cytomap | 8q22.3 | |
| Gene Type | protein-coding | GO ID | GO:0001655 | UniProtAcc | Q7LG56 |
Top |
Malignant transformation analysis |
| Identification of the aberrant gene expression in precancerous and cancerous lesions by comparing the gene expression of stem-like cells in diseased tissues with normal stem cells |
| Entrez ID | Symbol | Replicates | Species | Organ | Tissue | Adj P-value | Log2FC | Malignancy |
| 50484 | RRM2B | LZE2T | Human | Esophagus | ESCC | 5.36e-03 | 4.76e-01 | 0.082 |
| 50484 | RRM2B | LZE4T | Human | Esophagus | ESCC | 7.74e-08 | 3.15e-01 | 0.0811 |
| 50484 | RRM2B | LZE24T | Human | Esophagus | ESCC | 3.05e-10 | 2.01e-01 | 0.0596 |
| 50484 | RRM2B | P1T-E | Human | Esophagus | ESCC | 1.59e-02 | 1.46e-01 | 0.0875 |
| 50484 | RRM2B | P2T-E | Human | Esophagus | ESCC | 1.09e-14 | 2.94e-01 | 0.1177 |
| 50484 | RRM2B | P4T-E | Human | Esophagus | ESCC | 8.92e-14 | 3.01e-01 | 0.1323 |
| 50484 | RRM2B | P5T-E | Human | Esophagus | ESCC | 2.47e-08 | 1.89e-01 | 0.1327 |
| 50484 | RRM2B | P8T-E | Human | Esophagus | ESCC | 1.13e-06 | 1.56e-01 | 0.0889 |
| 50484 | RRM2B | P9T-E | Human | Esophagus | ESCC | 8.17e-13 | 2.33e-01 | 0.1131 |
| 50484 | RRM2B | P10T-E | Human | Esophagus | ESCC | 2.10e-04 | 1.32e-01 | 0.116 |
| 50484 | RRM2B | P11T-E | Human | Esophagus | ESCC | 1.27e-13 | 4.27e-01 | 0.1426 |
| 50484 | RRM2B | P12T-E | Human | Esophagus | ESCC | 6.28e-21 | 3.69e-01 | 0.1122 |
| 50484 | RRM2B | P15T-E | Human | Esophagus | ESCC | 9.26e-08 | 1.81e-01 | 0.1149 |
| 50484 | RRM2B | P16T-E | Human | Esophagus | ESCC | 1.10e-19 | 3.54e-01 | 0.1153 |
| 50484 | RRM2B | P19T-E | Human | Esophagus | ESCC | 2.87e-02 | 5.07e-01 | 0.1662 |
| 50484 | RRM2B | P20T-E | Human | Esophagus | ESCC | 2.40e-09 | 1.76e-01 | 0.1124 |
| 50484 | RRM2B | P21T-E | Human | Esophagus | ESCC | 3.47e-19 | 3.95e-01 | 0.1617 |
| 50484 | RRM2B | P22T-E | Human | Esophagus | ESCC | 5.89e-16 | 3.22e-01 | 0.1236 |
| 50484 | RRM2B | P23T-E | Human | Esophagus | ESCC | 2.03e-14 | 2.78e-01 | 0.108 |
| 50484 | RRM2B | P24T-E | Human | Esophagus | ESCC | 2.58e-05 | 1.14e-01 | 0.1287 |
| Page: 1 2 3 4 |
| Tissue | Expression Dynamics | Abbreviation |
| Esophagus | 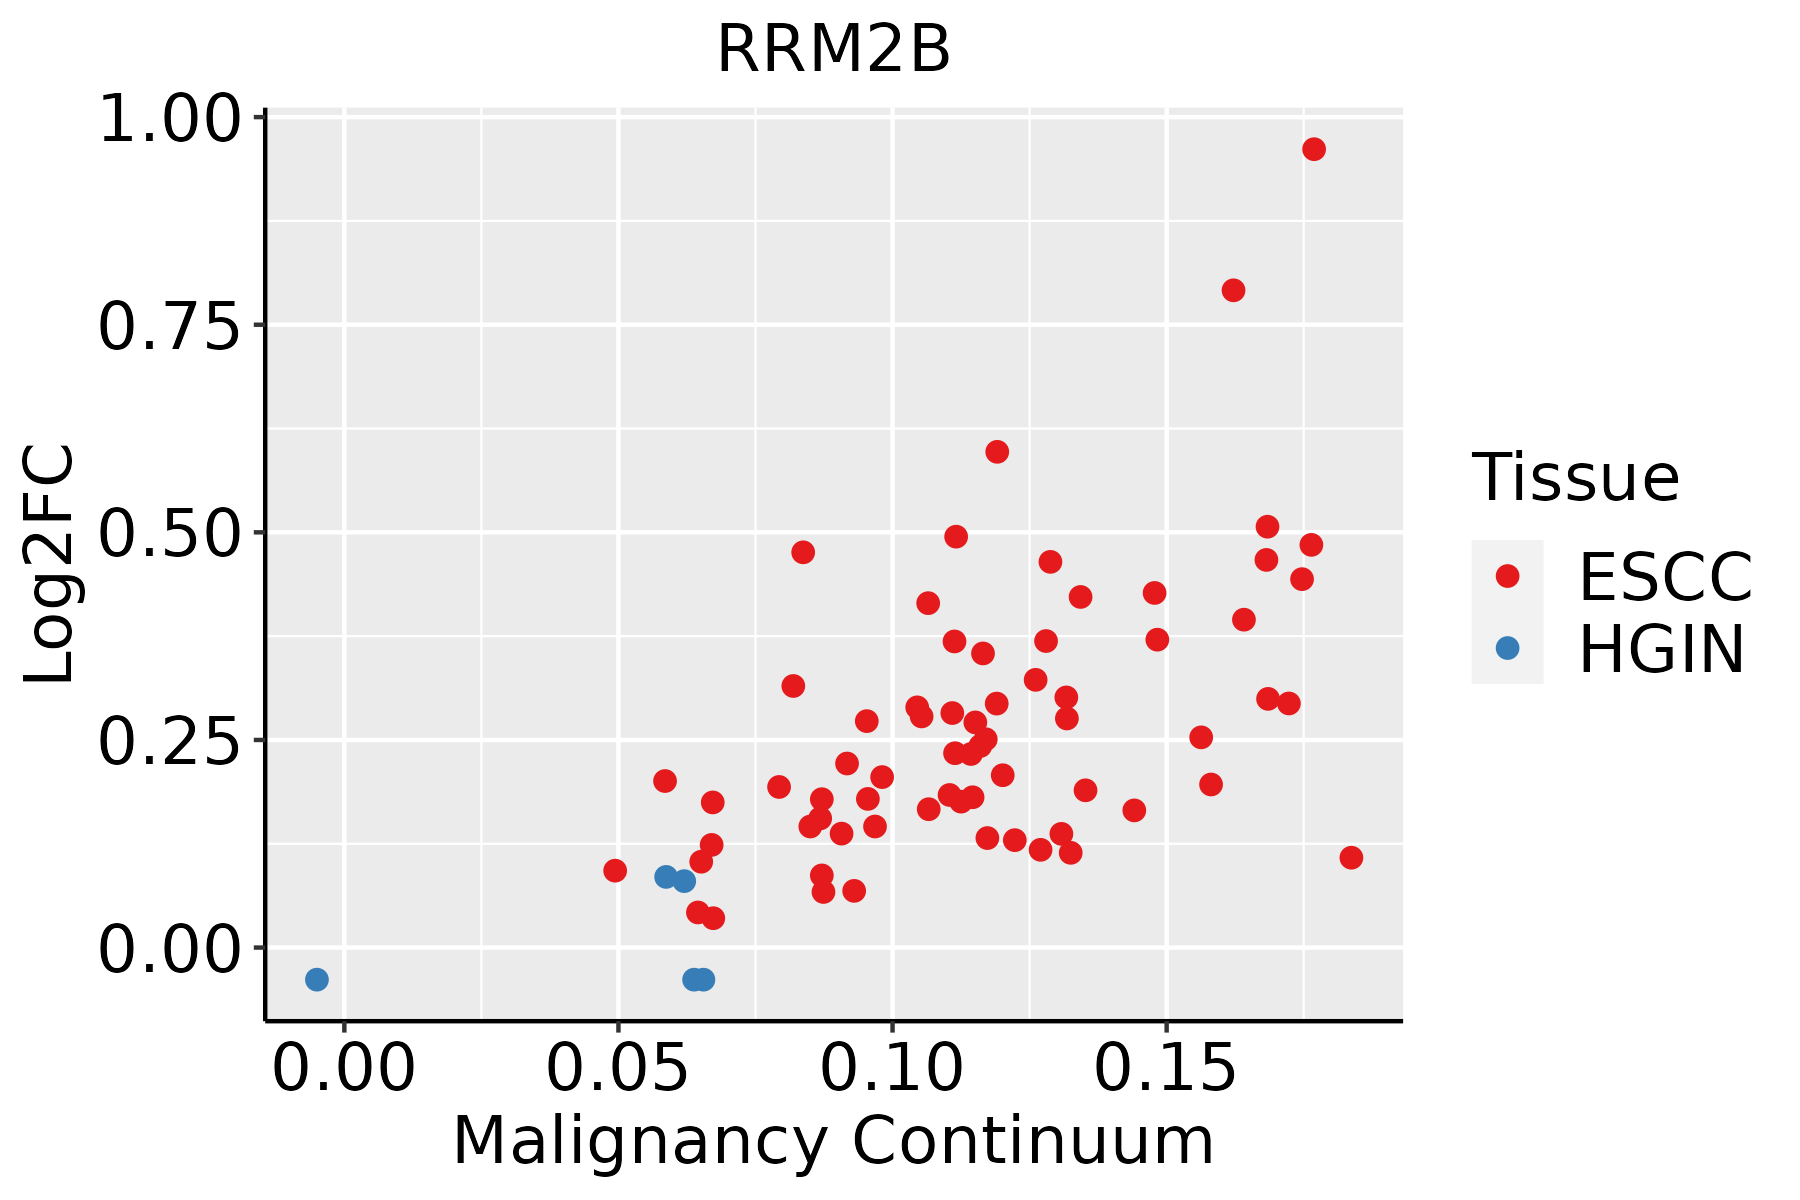 | ESCC: Esophageal squamous cell carcinoma |
| HGIN: High-grade intraepithelial neoplasias | ||
| LGIN: Low-grade intraepithelial neoplasias | ||
| Liver | 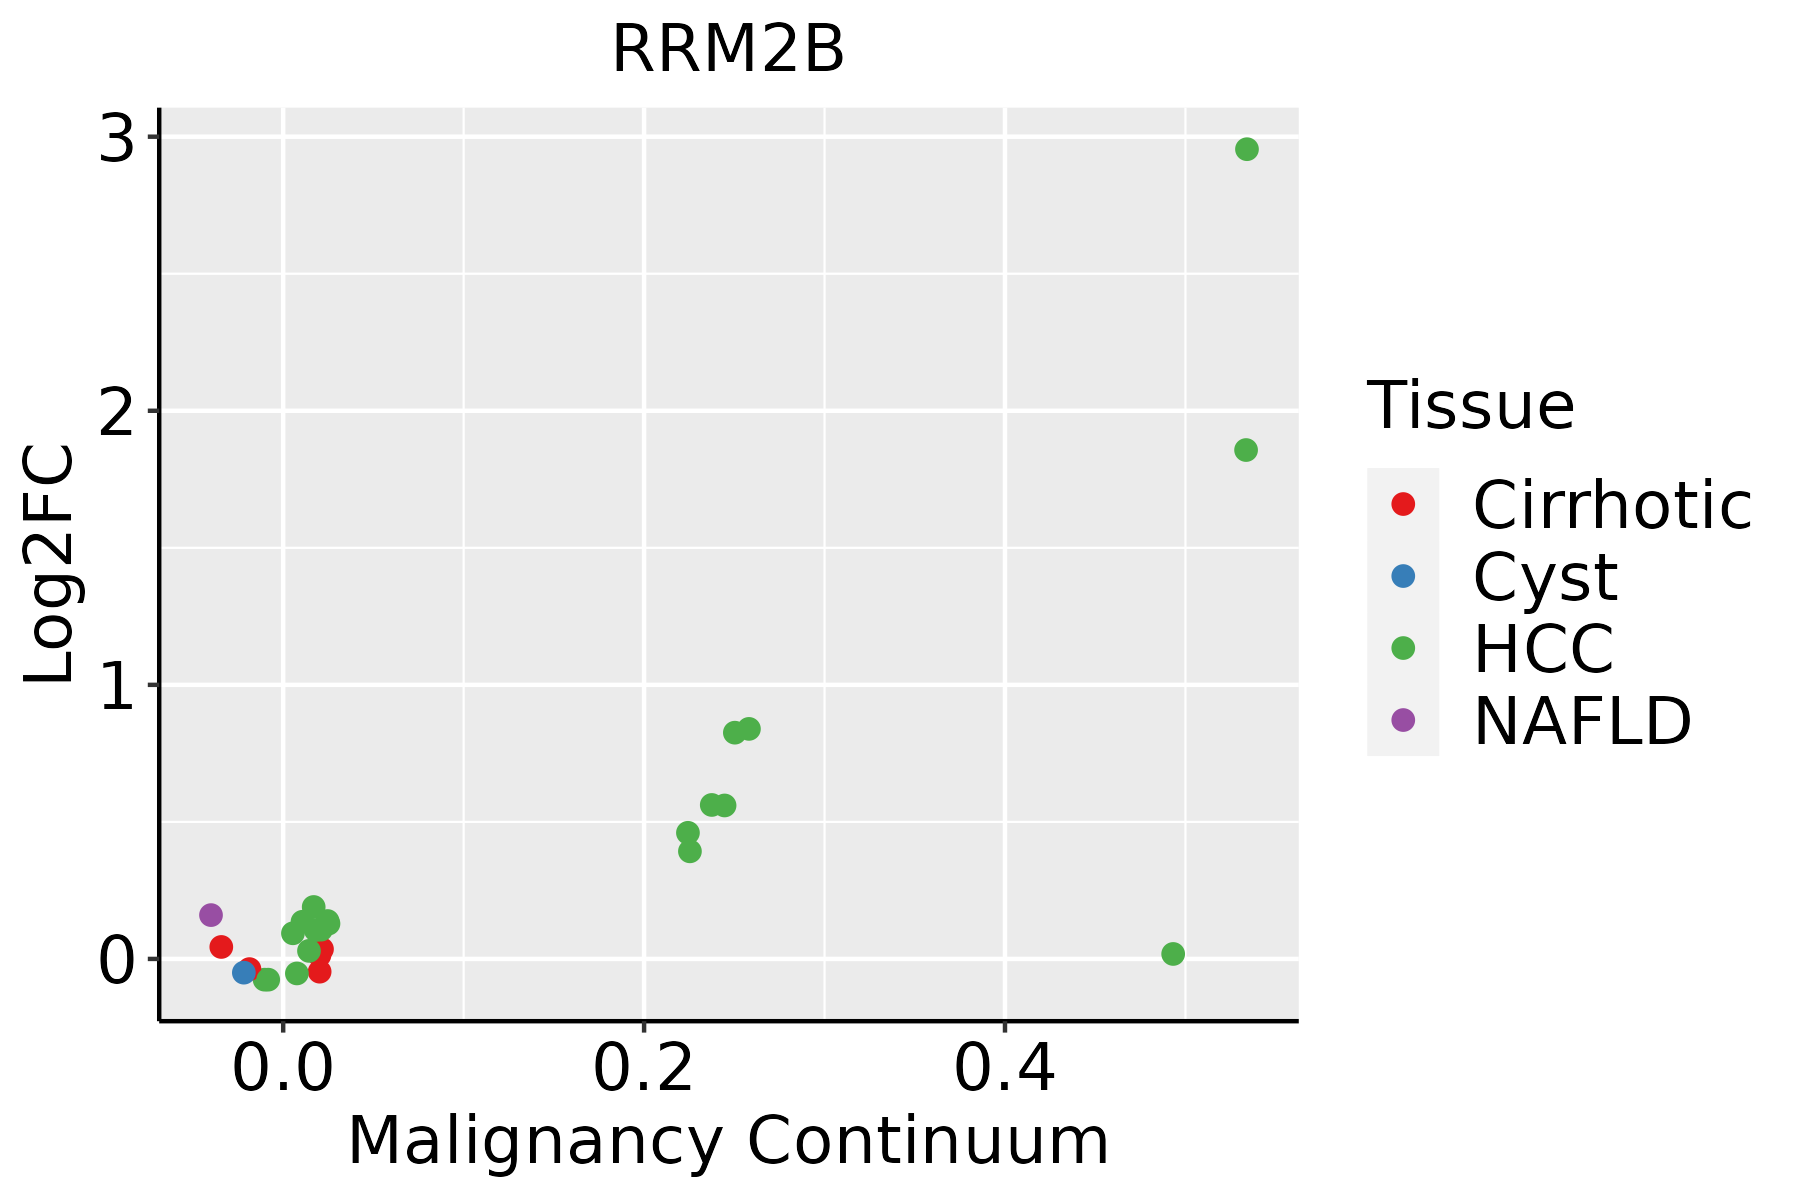 | HCC: Hepatocellular carcinoma |
| NAFLD: Non-alcoholic fatty liver disease | ||
| Thyroid | 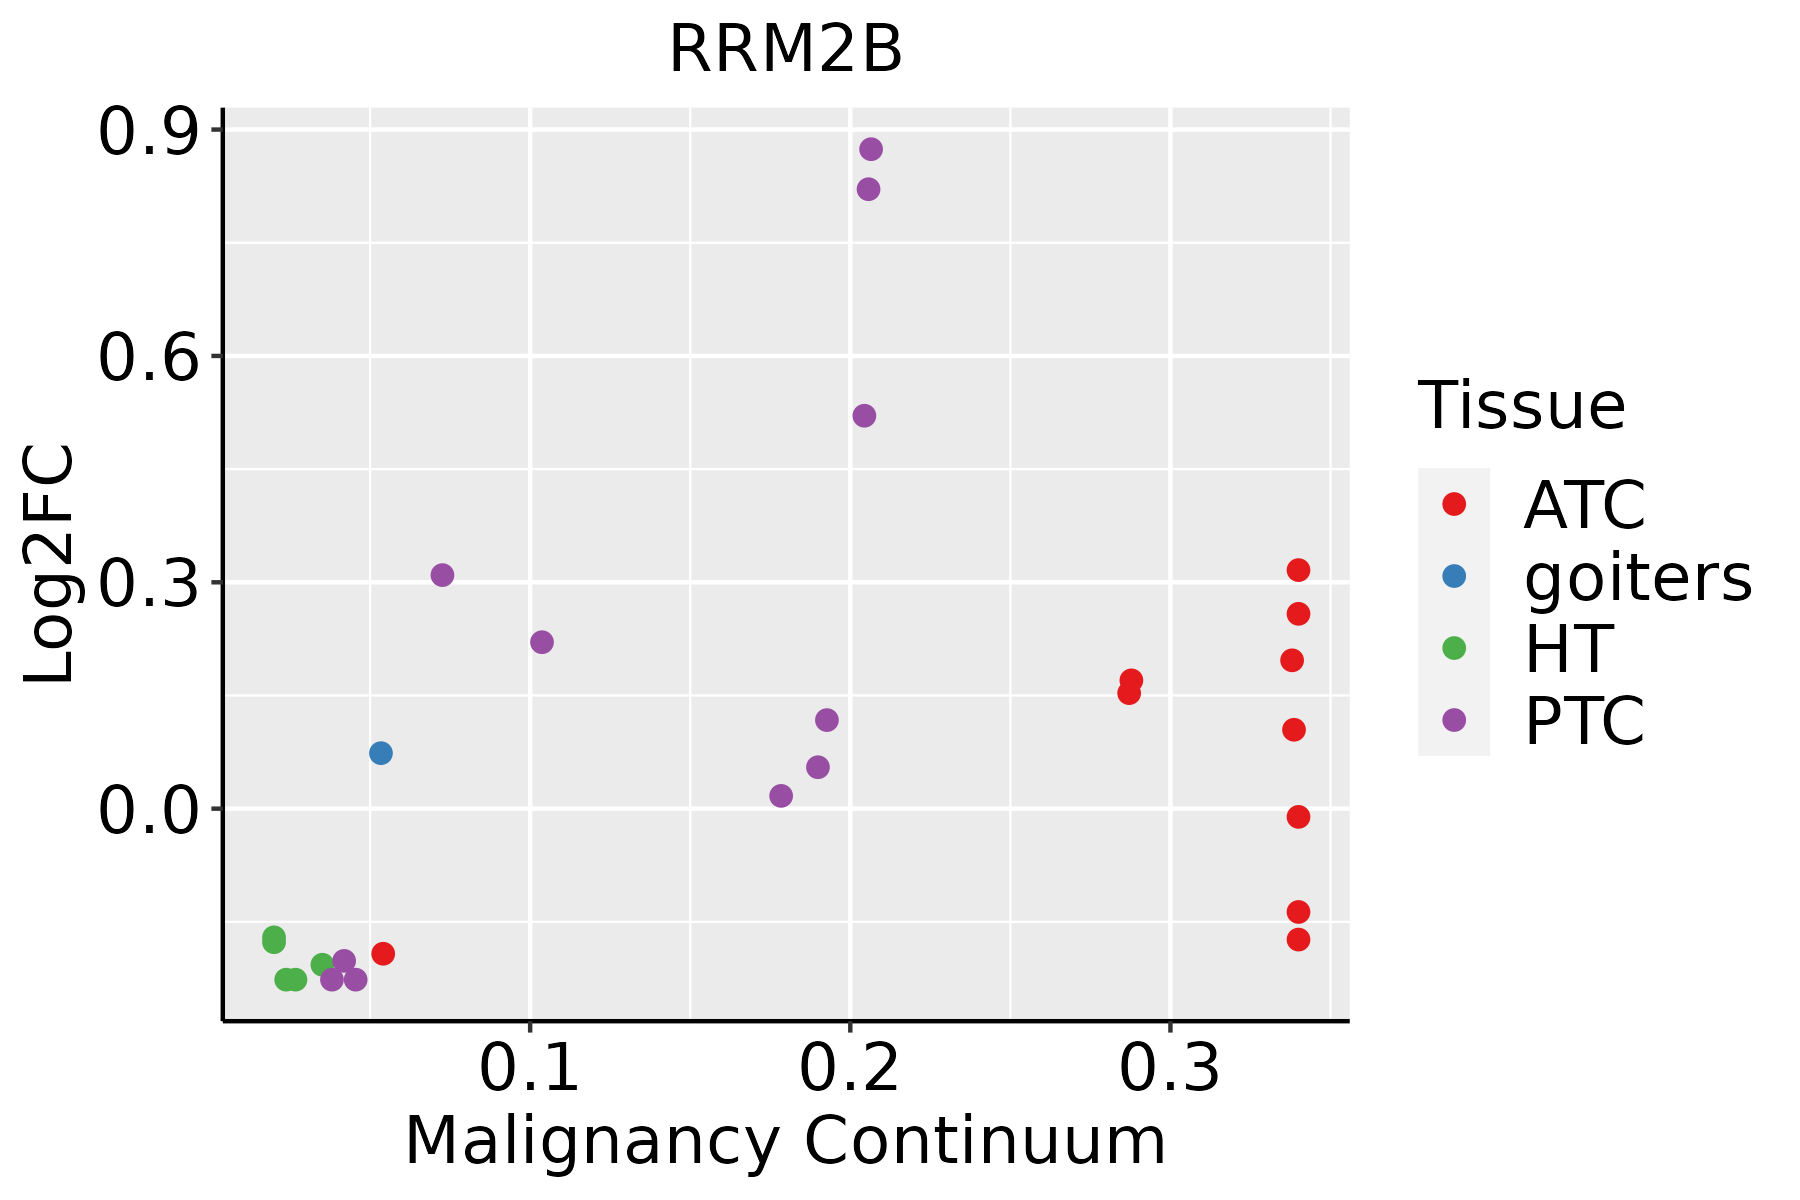 | ATC: Anaplastic thyroid cancer |
| HT: Hashimoto's thyroiditis | ||
| PTC: Papillary thyroid cancer |
| ∗log2FC in expression of this searched gene in stem-like cells from each diseased tissue sample relative to stem-like cells in normal samples in each tissue plotted against the malignancy continuum. Samples are colored based on if they are from different disease stage. |
Top |
Malignant transformation related pathway analysis |
| Find out the enriched GO biological processes and KEGG pathways involved in transition from healthy to precancer to cancer |
| Tissue | Disease Stage | Enriched GO biological Processes |
| Colorectum | AD |  |
| Colorectum | SER |  |
| Colorectum | MSS |  |
| Colorectum | MSI-H |  |
| Colorectum | FAP |  |
| ∗Top 15 enriched GO BP terms are showed in the bar plot of each disease state in each tissue. Each row represents a significant GO biological process which is colored according to the -log10(p.adjust). |
| Page: 1 2 3 4 5 6 7 8 9 |
| GO ID | Tissue | Disease Stage | Description | Gene Ratio | Bg Ratio | pvalue | p.adjust | Count |
| GO:19017975 | Esophagus | ESCC | negative regulation of signal transduction by p53 class mediator | 22/8552 | 31/18723 | 3.90e-03 | 1.58e-02 | 22 |
| GO:19022544 | Esophagus | ESCC | negative regulation of intrinsic apoptotic signaling pathway by p53 class mediator | 16/8552 | 21/18723 | 4.47e-03 | 1.76e-02 | 16 |
| GO:00016559 | Esophagus | ESCC | urogenital system development | 177/8552 | 338/18723 | 7.51e-03 | 2.69e-02 | 177 |
| GO:000697922 | Liver | HCC | response to oxidative stress | 281/7958 | 446/18723 | 9.75e-19 | 1.24e-16 | 281 |
| GO:000911722 | Liver | HCC | nucleotide metabolic process | 300/7958 | 489/18723 | 1.61e-17 | 1.71e-15 | 300 |
| GO:000675322 | Liver | HCC | nucleoside phosphate metabolic process | 304/7958 | 497/18723 | 1.78e-17 | 1.85e-15 | 304 |
| GO:200123322 | Liver | HCC | regulation of apoptotic signaling pathway | 226/7958 | 356/18723 | 7.26e-16 | 5.68e-14 | 226 |
| GO:009719322 | Liver | HCC | intrinsic apoptotic signaling pathway | 184/7958 | 288/18723 | 1.50e-13 | 8.32e-12 | 184 |
| GO:200123412 | Liver | HCC | negative regulation of apoptotic signaling pathway | 145/7958 | 224/18723 | 1.33e-11 | 5.36e-10 | 145 |
| GO:200124212 | Liver | HCC | regulation of intrinsic apoptotic signaling pathway | 109/7958 | 164/18723 | 4.52e-10 | 1.45e-08 | 109 |
| GO:007233122 | Liver | HCC | signal transduction by p53 class mediator | 108/7958 | 163/18723 | 7.14e-10 | 2.23e-08 | 108 |
| GO:000916512 | Liver | HCC | nucleotide biosynthetic process | 150/7958 | 254/18723 | 6.79e-08 | 1.40e-06 | 150 |
| GO:190129312 | Liver | HCC | nucleoside phosphate biosynthetic process | 151/7958 | 256/18723 | 6.84e-08 | 1.41e-06 | 151 |
| GO:000914112 | Liver | HCC | nucleoside triphosphate metabolic process | 75/7958 | 112/18723 | 1.43e-07 | 2.67e-06 | 75 |
| GO:200124312 | Liver | HCC | negative regulation of intrinsic apoptotic signaling pathway | 67/7958 | 98/18723 | 1.97e-07 | 3.55e-06 | 67 |
| GO:190179622 | Liver | HCC | regulation of signal transduction by p53 class mediator | 64/7958 | 93/18723 | 2.53e-07 | 4.45e-06 | 64 |
| GO:00062601 | Liver | HCC | DNA replication | 146/7958 | 260/18723 | 5.68e-06 | 7.02e-05 | 146 |
| GO:007233212 | Liver | HCC | intrinsic apoptotic signaling pathway by p53 class mediator | 51/7958 | 76/18723 | 1.27e-05 | 1.42e-04 | 51 |
| GO:00092621 | Liver | HCC | deoxyribonucleotide metabolic process | 31/7958 | 44/18723 | 1.63e-04 | 1.30e-03 | 31 |
| GO:00092003 | Liver | HCC | deoxyribonucleoside triphosphate metabolic process | 14/7958 | 17/18723 | 9.39e-04 | 5.47e-03 | 14 |
| Page: 1 2 3 4 5 |
| Pathway ID | Tissue | Disease Stage | Description | Gene Ratio | Bg Ratio | pvalue | p.adjust | qvalue | Count |
| hsa0411524 | Esophagus | ESCC | p53 signaling pathway | 65/4205 | 74/8465 | 3.88e-12 | 6.50e-11 | 3.33e-11 | 65 |
| hsa0048018 | Esophagus | ESCC | Glutathione metabolism | 44/4205 | 57/8465 | 1.81e-05 | 9.03e-05 | 4.63e-05 | 44 |
| hsa012325 | Esophagus | ESCC | Nucleotide metabolism | 59/4205 | 85/8465 | 1.67e-04 | 6.58e-04 | 3.37e-04 | 59 |
| hsa002405 | Esophagus | ESCC | Pyrimidine metabolism | 41/4205 | 58/8465 | 9.14e-04 | 2.92e-03 | 1.49e-03 | 41 |
| hsa0411534 | Esophagus | ESCC | p53 signaling pathway | 65/4205 | 74/8465 | 3.88e-12 | 6.50e-11 | 3.33e-11 | 65 |
| hsa0048019 | Esophagus | ESCC | Glutathione metabolism | 44/4205 | 57/8465 | 1.81e-05 | 9.03e-05 | 4.63e-05 | 44 |
| hsa0123212 | Esophagus | ESCC | Nucleotide metabolism | 59/4205 | 85/8465 | 1.67e-04 | 6.58e-04 | 3.37e-04 | 59 |
| hsa0024012 | Esophagus | ESCC | Pyrimidine metabolism | 41/4205 | 58/8465 | 9.14e-04 | 2.92e-03 | 1.49e-03 | 41 |
| hsa002402 | Liver | HCC | Pyrimidine metabolism | 44/4020 | 58/8465 | 9.34e-06 | 7.11e-05 | 3.95e-05 | 44 |
| hsa012322 | Liver | HCC | Nucleotide metabolism | 59/4020 | 85/8465 | 3.30e-05 | 1.88e-04 | 1.04e-04 | 59 |
| hsa0048022 | Liver | HCC | Glutathione metabolism | 42/4020 | 57/8465 | 5.00e-05 | 2.62e-04 | 1.46e-04 | 42 |
| hsa009832 | Liver | HCC | Drug metabolism - other enzymes | 54/4020 | 80/8465 | 2.25e-04 | 1.09e-03 | 6.08e-04 | 54 |
| hsa041156 | Liver | HCC | p53 signaling pathway | 46/4020 | 74/8465 | 7.64e-03 | 2.08e-02 | 1.16e-02 | 46 |
| hsa002403 | Liver | HCC | Pyrimidine metabolism | 44/4020 | 58/8465 | 9.34e-06 | 7.11e-05 | 3.95e-05 | 44 |
| hsa012323 | Liver | HCC | Nucleotide metabolism | 59/4020 | 85/8465 | 3.30e-05 | 1.88e-04 | 1.04e-04 | 59 |
| hsa0048032 | Liver | HCC | Glutathione metabolism | 42/4020 | 57/8465 | 5.00e-05 | 2.62e-04 | 1.46e-04 | 42 |
| hsa009833 | Liver | HCC | Drug metabolism - other enzymes | 54/4020 | 80/8465 | 2.25e-04 | 1.09e-03 | 6.08e-04 | 54 |
| hsa0411511 | Liver | HCC | p53 signaling pathway | 46/4020 | 74/8465 | 7.64e-03 | 2.08e-02 | 1.16e-02 | 46 |
| Page: 1 |
Top |
Cell-cell communication analysis |
| Identification of potential cell-cell interactions between two cell types and their ligand-receptor pairs for different disease states |
| Ligand | Receptor | LRpair | Pathway | Tissue | Disease Stage |
| Page: 1 |
Top |
Single-cell gene regulatory network inference analysis |
| Find out the significant the regulons (TFs) and the target genes of each regulon across cell types for different disease states |
| TF | Cell Type | Tissue | Disease Stage | Target Gene | RSS | Regulon Activity |
| ∗The dot plots of a searched regulon are shown for all cell subpopulations in each disease state of each tissue based on the regulon specific score inferred using pySCENIC and by calculating the average expression. |
| Page: 1 |
Top |
Somatic mutation of malignant transformation related genes |
| Annotation of somatic variants for genes involved in malignant transformation |
| Hugo Symbol | Variant Class | Variant Classification | dbSNP RS | HGVSc | HGVSp | HGVSp Short | SWISSPROT | BIOTYPE | SIFT | PolyPhen | Tumor Sample Barcode | Tissue | Histology | Sex | Age | Stage | Therapy Types | Drugs | Outcome |
| RRM2B | SNV | Missense_Mutation | c.969N>A | p.Phe323Leu | p.F323L | Q7LG56 | protein_coding | deleterious_low_confidence(0) | probably_damaging(0.968) | TCGA-AN-A046-01 | Breast | breast invasive carcinoma | Female | >=65 | I/II | Unknown | Unknown | SD | |
| RRM2B | SNV | Missense_Mutation | c.742N>A | p.Glu248Lys | p.E248K | Q7LG56 | protein_coding | tolerated_low_confidence(0.42) | benign(0.003) | TCGA-EA-A3HT-01 | Cervix | cervical & endocervical cancer | Female | >=65 | I/II | Unknown | Unknown | SD | |
| RRM2B | SNV | Missense_Mutation | rs370367329 | c.70N>A | p.Glu24Lys | p.E24K | Q7LG56 | protein_coding | tolerated_low_confidence(0.36) | benign(0) | TCGA-ZJ-AAXT-01 | Cervix | cervical & endocervical cancer | Female | <65 | III/IV | Unknown | Unknown | SD |
| RRM2B | SNV | Missense_Mutation | c.226C>A | p.Pro76Thr | p.P76T | Q7LG56 | protein_coding | tolerated_low_confidence(0.63) | benign(0.006) | TCGA-AZ-4615-01 | Colorectum | colon adenocarcinoma | Male | >=65 | III/IV | Chemotherapy | xeloda | PD | |
| RRM2B | SNV | Missense_Mutation | c.463N>G | p.Leu155Val | p.L155V | Q7LG56 | protein_coding | deleterious_low_confidence(0.01) | benign(0.262) | TCGA-CA-6718-01 | Colorectum | colon adenocarcinoma | Male | <65 | I/II | Unknown | Unknown | PD | |
| RRM2B | SNV | Missense_Mutation | rs515726186 | c.328C>T | p.Arg110Cys | p.R110C | Q7LG56 | protein_coding | deleterious_low_confidence(0.02) | possibly_damaging(0.597) | TCGA-EI-6917-01 | Colorectum | rectum adenocarcinoma | Male | <65 | III/IV | Chemotherapy | 5fluorouracil+oxaciplatina+l-folinian | SD |
| RRM2B | insertion | Frame_Shift_Ins | novel | c.288_289insT | p.Ala97CysfsTer4 | p.A97Cfs*4 | Q7LG56 | protein_coding | TCGA-AA-3710-01 | Colorectum | colon adenocarcinoma | Female | >=65 | I/II | Unknown | Unknown | SD | ||
| RRM2B | SNV | Missense_Mutation | novel | c.481A>G | p.Thr161Ala | p.T161A | Q7LG56 | protein_coding | deleterious_low_confidence(0) | benign(0.036) | TCGA-A5-A0G2-01 | Endometrium | uterine corpus endometrioid carcinoma | Female | <65 | III/IV | Unknown | Unknown | SD |
| RRM2B | SNV | Missense_Mutation | novel | c.264C>A | p.Phe88Leu | p.F88L | Q7LG56 | protein_coding | deleterious_low_confidence(0) | probably_damaging(0.979) | TCGA-AJ-A5DW-01 | Endometrium | uterine corpus endometrioid carcinoma | Female | <65 | I/II | Unknown | Unknown | SD |
| RRM2B | SNV | Missense_Mutation | rs764136513 | c.521G>A | p.Arg174Gln | p.R174Q | Q7LG56 | protein_coding | tolerated_low_confidence(0.09) | benign(0.015) | TCGA-AP-A1DV-01 | Endometrium | uterine corpus endometrioid carcinoma | Female | <65 | I/II | Unknown | Unknown | SD |
| Page: 1 2 3 4 |
Top |
Related drugs of malignant transformation related genes |
| Identification of chemicals and drugs interact with genes involved in malignant transfromation |
| (DGIdb 4.0) |
| Entrez ID | Symbol | Category | Interaction Types | Drug Claim Name | Drug Name | PMIDs |
| 50484 | RRM2B | ENZYME, DRUGGABLE GENOME, DNA REPAIR | inhibitor | CHEMBL1200983 | GALLIUM NITRATE | |
| 50484 | RRM2B | ENZYME, DRUGGABLE GENOME, DNA REPAIR | inhibitor | CHEMBL1096882 | FLUDARABINE PHOSPHATE | |
| 50484 | RRM2B | ENZYME, DRUGGABLE GENOME, DNA REPAIR | MOTEXAFIN GADOLINIUM | |||
| 50484 | RRM2B | ENZYME, DRUGGABLE GENOME, DNA REPAIR | GEMCITABINE | GEMCITABINE | ||
| 50484 | RRM2B | ENZYME, DRUGGABLE GENOME, DNA REPAIR | inhibitor | CHEMBL1750 | CLOFARABINE | |
| 50484 | RRM2B | ENZYME, DRUGGABLE GENOME, DNA REPAIR | inhibitor | CHEMBL467 | HYDROXYUREA | |
| 50484 | RRM2B | ENZYME, DRUGGABLE GENOME, DNA REPAIR | cladribine | CLADRIBINE | 24024897 | |
| 50484 | RRM2B | ENZYME, DRUGGABLE GENOME, DNA REPAIR | inhibitor | CHEMBL1637 | GEMCITABINE HYDROCHLORIDE | |
| 50484 | RRM2B | ENZYME, DRUGGABLE GENOME, DNA REPAIR | LOR-2040 | |||
| 50484 | RRM2B | ENZYME, DRUGGABLE GENOME, DNA REPAIR | inhibitor | CHEMBL2105467 | TEZACITABINE |
| Page: 1 2 |

Copyright 2023-Present -The University of Texas Health Science Center at Houston |