
|
|||||
|
 | |
| |
| |
| |
| |
| |
|
Gene: RPS6KB1 |
Gene summary for RPS6KB1 |
| Gene information | Species | Human | Gene symbol | RPS6KB1 | Gene ID | 6198 |
| Gene name | ribosomal protein S6 kinase B1 | |
| Gene Alias | PS6K | |
| Cytomap | 17q23.1 | |
| Gene Type | protein-coding | GO ID | GO:0000082 | UniProtAcc | P23443 |
Top |
Malignant transformation analysis |
| Identification of the aberrant gene expression in precancerous and cancerous lesions by comparing the gene expression of stem-like cells in diseased tissues with normal stem cells |
| Entrez ID | Symbol | Replicates | Species | Organ | Tissue | Adj P-value | Log2FC | Malignancy |
| 6198 | RPS6KB1 | AEH-subject5 | Human | Endometrium | AEH | 9.48e-06 | 3.34e-01 | -0.2953 |
| 6198 | RPS6KB1 | EEC-subject4 | Human | Endometrium | EEC | 6.76e-03 | 4.58e-02 | -0.2571 |
| 6198 | RPS6KB1 | GSM6177620_NYU_UCEC1_lib1_lib1 | Human | Endometrium | EEC | 5.20e-04 | -2.04e-02 | -0.1869 |
| 6198 | RPS6KB1 | GSM6177620_NYU_UCEC1_lib3_lib3 | Human | Endometrium | EEC | 1.91e-02 | -8.43e-02 | -0.1883 |
| 6198 | RPS6KB1 | GSM6177621_NYU_UCEC2_lib1_lib1 | Human | Endometrium | EEC | 1.25e-04 | -4.91e-02 | -0.1934 |
| 6198 | RPS6KB1 | GSM6177622_NYU_UCEC3_lib1_lib1 | Human | Endometrium | EEC | 1.48e-06 | -4.91e-02 | -0.1917 |
| 6198 | RPS6KB1 | GSM6177622_NYU_UCEC3_lib2_lib2 | Human | Endometrium | EEC | 1.83e-05 | -9.56e-02 | -0.1916 |
| 6198 | RPS6KB1 | LZE4T | Human | Esophagus | ESCC | 3.07e-09 | 1.61e-01 | 0.0811 |
| 6198 | RPS6KB1 | LZE5T | Human | Esophagus | ESCC | 1.16e-03 | 1.98e-01 | 0.0514 |
| 6198 | RPS6KB1 | LZE7T | Human | Esophagus | ESCC | 4.13e-04 | 1.21e-01 | 0.0667 |
| 6198 | RPS6KB1 | LZE20T | Human | Esophagus | ESCC | 1.26e-02 | 3.21e-02 | 0.0662 |
| 6198 | RPS6KB1 | LZE22T | Human | Esophagus | ESCC | 9.28e-03 | 1.70e-01 | 0.068 |
| 6198 | RPS6KB1 | LZE24T | Human | Esophagus | ESCC | 1.09e-12 | 5.29e-01 | 0.0596 |
| 6198 | RPS6KB1 | P1T-E | Human | Esophagus | ESCC | 2.17e-10 | 3.05e-01 | 0.0875 |
| 6198 | RPS6KB1 | P2T-E | Human | Esophagus | ESCC | 1.21e-22 | 2.73e-01 | 0.1177 |
| 6198 | RPS6KB1 | P4T-E | Human | Esophagus | ESCC | 3.38e-11 | 1.44e-01 | 0.1323 |
| 6198 | RPS6KB1 | P5T-E | Human | Esophagus | ESCC | 4.75e-09 | 3.31e-02 | 0.1327 |
| 6198 | RPS6KB1 | P8T-E | Human | Esophagus | ESCC | 4.42e-35 | 5.20e-01 | 0.0889 |
| 6198 | RPS6KB1 | P9T-E | Human | Esophagus | ESCC | 3.78e-19 | 1.86e-01 | 0.1131 |
| 6198 | RPS6KB1 | P10T-E | Human | Esophagus | ESCC | 2.60e-18 | 2.36e-01 | 0.116 |
| Page: 1 2 3 4 5 6 |
| Tissue | Expression Dynamics | Abbreviation |
| Endometrium | 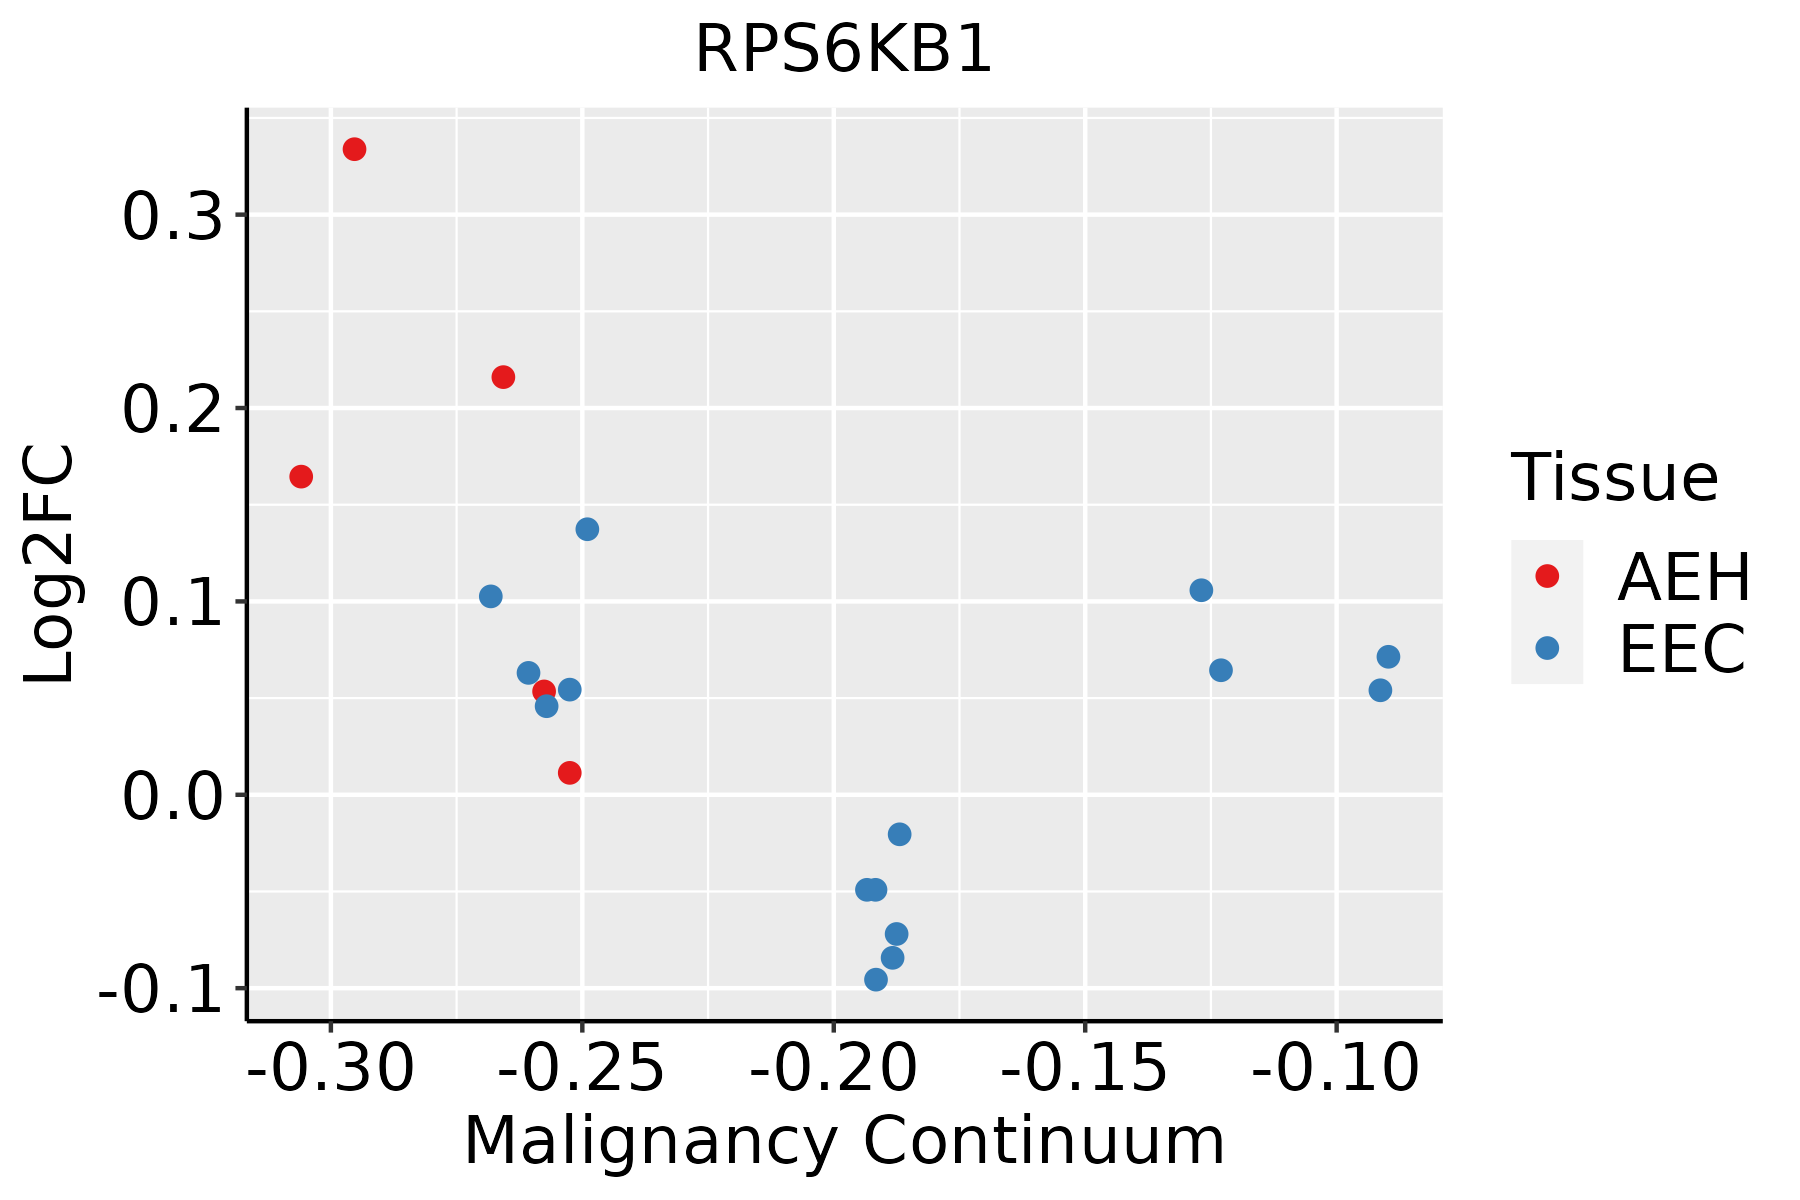 | AEH: Atypical endometrial hyperplasia |
| EEC: Endometrioid Cancer | ||
| Esophagus | 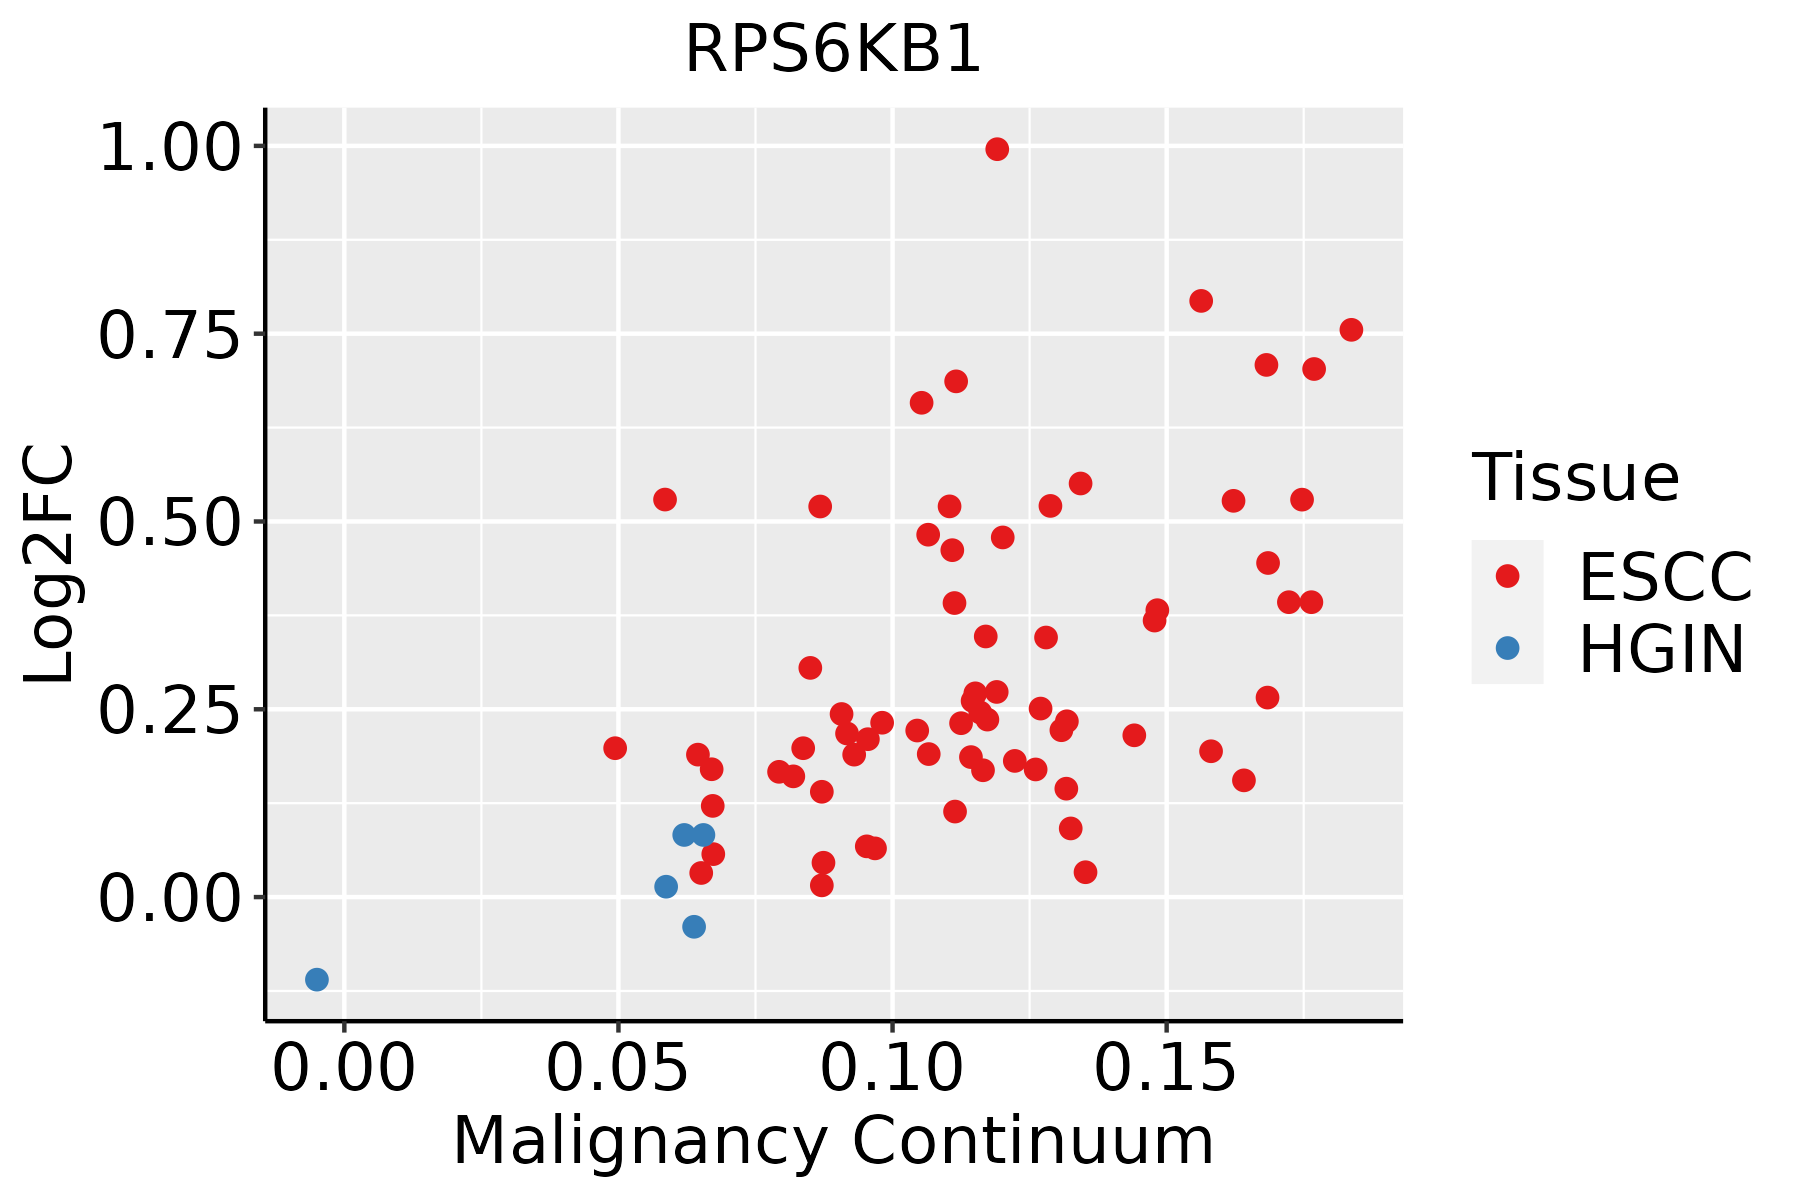 | ESCC: Esophageal squamous cell carcinoma |
| HGIN: High-grade intraepithelial neoplasias | ||
| LGIN: Low-grade intraepithelial neoplasias | ||
| Liver |  | HCC: Hepatocellular carcinoma |
| NAFLD: Non-alcoholic fatty liver disease | ||
| Oral Cavity | 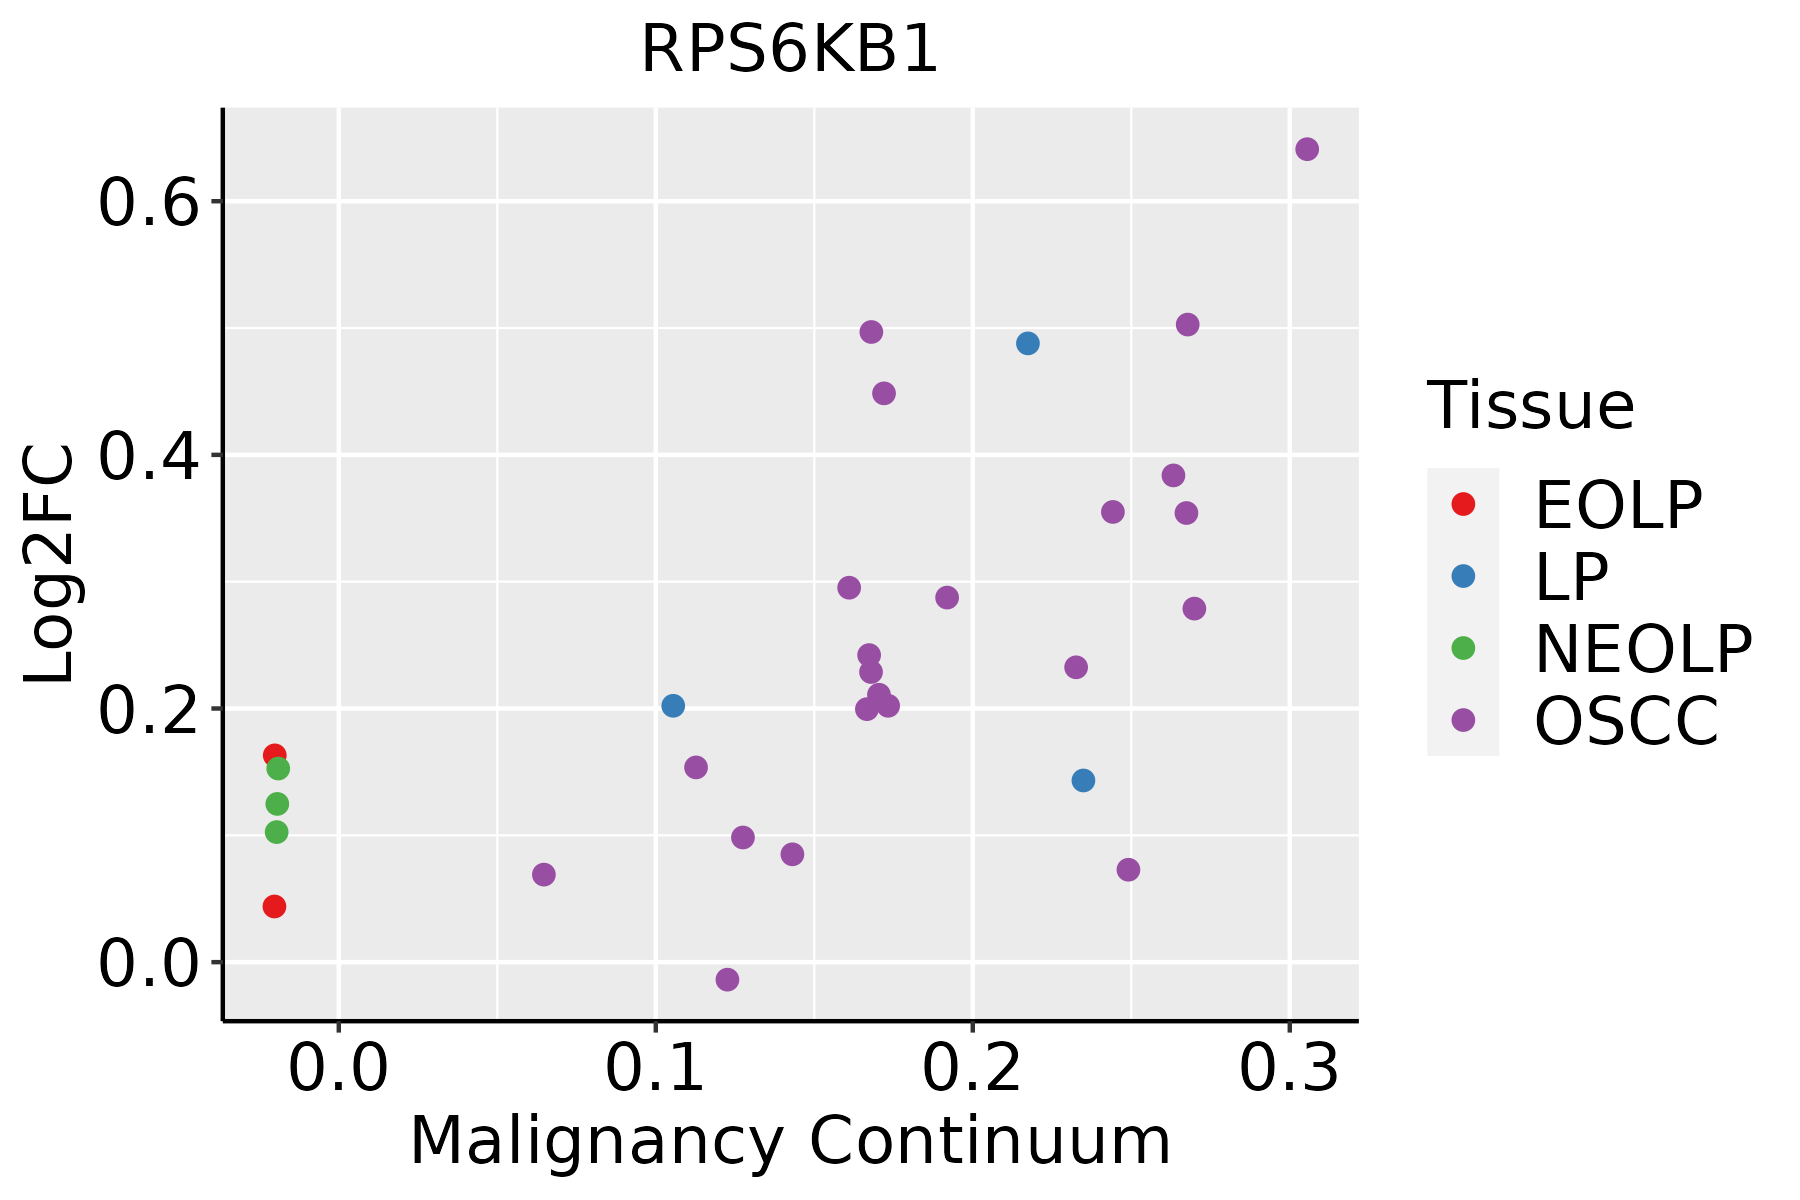 | EOLP: Erosive Oral lichen planus |
| LP: leukoplakia | ||
| NEOLP: Non-erosive oral lichen planus | ||
| OSCC: Oral squamous cell carcinoma | ||
| Thyroid |  | ATC: Anaplastic thyroid cancer |
| HT: Hashimoto's thyroiditis | ||
| PTC: Papillary thyroid cancer |
| ∗log2FC in expression of this searched gene in stem-like cells from each diseased tissue sample relative to stem-like cells in normal samples in each tissue plotted against the malignancy continuum. Samples are colored based on if they are from different disease stage. |
Top |
Malignant transformation related pathway analysis |
| Find out the enriched GO biological processes and KEGG pathways involved in transition from healthy to precancer to cancer |
| Tissue | Disease Stage | Enriched GO biological Processes |
| Colorectum | AD |  |
| Colorectum | SER |  |
| Colorectum | MSS |  |
| Colorectum | MSI-H |  |
| Colorectum | FAP |  |
| ∗Top 15 enriched GO BP terms are showed in the bar plot of each disease state in each tissue. Each row represents a significant GO biological process which is colored according to the -log10(p.adjust). |
| Page: 1 2 3 4 5 6 7 8 9 |
| GO ID | Tissue | Disease Stage | Description | Gene Ratio | Bg Ratio | pvalue | p.adjust | Count |
| GO:000644614 | Endometrium | EEC | regulation of translational initiation | 25/2168 | 79/18723 | 1.62e-06 | 5.03e-05 | 25 |
| GO:190165314 | Endometrium | EEC | cellular response to peptide | 68/2168 | 359/18723 | 2.75e-05 | 4.83e-04 | 68 |
| GO:004343416 | Endometrium | EEC | response to peptide hormone | 74/2168 | 414/18723 | 9.11e-05 | 1.28e-03 | 74 |
| GO:004578713 | Endometrium | EEC | positive regulation of cell cycle | 59/2168 | 313/18723 | 1.04e-04 | 1.44e-03 | 59 |
| GO:003166717 | Endometrium | EEC | response to nutrient levels | 82/2168 | 474/18723 | 1.23e-04 | 1.64e-03 | 82 |
| GO:004477213 | Endometrium | EEC | mitotic cell cycle phase transition | 71/2168 | 424/18723 | 8.68e-04 | 7.97e-03 | 71 |
| GO:007137513 | Endometrium | EEC | cellular response to peptide hormone stimulus | 52/2168 | 290/18723 | 8.77e-04 | 8.01e-03 | 52 |
| GO:003286914 | Endometrium | EEC | cellular response to insulin stimulus | 39/2168 | 203/18723 | 9.93e-04 | 8.79e-03 | 39 |
| GO:000828613 | Endometrium | EEC | insulin receptor signaling pathway | 25/2168 | 116/18723 | 1.50e-03 | 1.21e-02 | 25 |
| GO:004593113 | Endometrium | EEC | positive regulation of mitotic cell cycle | 25/2168 | 121/18723 | 2.76e-03 | 1.97e-02 | 25 |
| GO:003286814 | Endometrium | EEC | response to insulin | 46/2168 | 264/18723 | 3.01e-03 | 2.10e-02 | 46 |
| GO:00073467 | Endometrium | EEC | regulation of mitotic cell cycle | 70/2168 | 457/18723 | 8.76e-03 | 4.74e-02 | 70 |
| GO:0006413110 | Esophagus | ESCC | translational initiation | 100/8552 | 118/18723 | 1.16e-18 | 1.25e-16 | 100 |
| GO:004477216 | Esophagus | ESCC | mitotic cell cycle phase transition | 281/8552 | 424/18723 | 4.63e-18 | 4.45e-16 | 281 |
| GO:0006417111 | Esophagus | ESCC | regulation of translation | 304/8552 | 468/18723 | 1.53e-17 | 1.33e-15 | 304 |
| GO:000734615 | Esophagus | ESCC | regulation of mitotic cell cycle | 293/8552 | 457/18723 | 8.00e-16 | 5.64e-14 | 293 |
| GO:0045727111 | Esophagus | ESCC | positive regulation of translation | 107/8552 | 136/18723 | 2.79e-15 | 1.68e-13 | 107 |
| GO:0034250111 | Esophagus | ESCC | positive regulation of cellular amide metabolic process | 123/8552 | 162/18723 | 3.32e-15 | 1.93e-13 | 123 |
| GO:0031667111 | Esophagus | ESCC | response to nutrient levels | 289/8552 | 474/18723 | 9.25e-12 | 3.47e-10 | 289 |
| GO:000644617 | Esophagus | ESCC | regulation of translational initiation | 65/8552 | 79/18723 | 2.04e-11 | 7.07e-10 | 65 |
| Page: 1 2 3 4 5 6 7 8 9 |
| Pathway ID | Tissue | Disease Stage | Description | Gene Ratio | Bg Ratio | pvalue | p.adjust | qvalue | Count |
| hsa0471427 | Endometrium | EEC | Thermogenesis | 85/1237 | 232/8465 | 2.79e-17 | 7.05e-16 | 5.26e-16 | 85 |
| hsa0466621 | Endometrium | EEC | Fc gamma R-mediated phagocytosis | 27/1237 | 97/8465 | 5.15e-04 | 3.83e-03 | 2.85e-03 | 27 |
| hsa0406624 | Endometrium | EEC | HIF-1 signaling pathway | 29/1237 | 109/8465 | 7.33e-04 | 5.13e-03 | 3.82e-03 | 29 |
| hsa043502 | Endometrium | EEC | TGF-beta signaling pathway | 26/1237 | 108/8465 | 5.95e-03 | 3.12e-02 | 2.33e-02 | 26 |
| hsa0471436 | Endometrium | EEC | Thermogenesis | 85/1237 | 232/8465 | 2.79e-17 | 7.05e-16 | 5.26e-16 | 85 |
| hsa0466631 | Endometrium | EEC | Fc gamma R-mediated phagocytosis | 27/1237 | 97/8465 | 5.15e-04 | 3.83e-03 | 2.85e-03 | 27 |
| hsa0406634 | Endometrium | EEC | HIF-1 signaling pathway | 29/1237 | 109/8465 | 7.33e-04 | 5.13e-03 | 3.82e-03 | 29 |
| hsa043503 | Endometrium | EEC | TGF-beta signaling pathway | 26/1237 | 108/8465 | 5.95e-03 | 3.12e-02 | 2.33e-02 | 26 |
| hsa05131211 | Esophagus | ESCC | Shigellosis | 176/4205 | 247/8465 | 2.27e-12 | 4.01e-11 | 2.05e-11 | 176 |
| hsa04714211 | Esophagus | ESCC | Thermogenesis | 163/4205 | 232/8465 | 9.22e-11 | 1.14e-09 | 5.86e-10 | 163 |
| hsa05170210 | Esophagus | ESCC | Human immunodeficiency virus 1 infection | 147/4205 | 212/8465 | 3.37e-09 | 3.53e-08 | 1.81e-08 | 147 |
| hsa0521020 | Esophagus | ESCC | Colorectal cancer | 69/4205 | 86/8465 | 4.06e-09 | 4.13e-08 | 2.11e-08 | 69 |
| hsa0521216 | Esophagus | ESCC | Pancreatic cancer | 62/4205 | 76/8465 | 7.37e-09 | 6.85e-08 | 3.51e-08 | 62 |
| hsa0516510 | Esophagus | ESCC | Human papillomavirus infection | 215/4205 | 331/8465 | 7.86e-09 | 7.12e-08 | 3.65e-08 | 215 |
| hsa0414010 | Esophagus | ESCC | Autophagy - animal | 101/4205 | 141/8465 | 7.60e-08 | 6.21e-07 | 3.18e-07 | 101 |
| hsa0520529 | Esophagus | ESCC | Proteoglycans in cancer | 138/4205 | 205/8465 | 1.79e-07 | 1.40e-06 | 7.15e-07 | 138 |
| hsa05163210 | Esophagus | ESCC | Human cytomegalovirus infection | 148/4205 | 225/8465 | 5.73e-07 | 4.00e-06 | 2.05e-06 | 148 |
| hsa0406629 | Esophagus | ESCC | HIF-1 signaling pathway | 75/4205 | 109/8465 | 3.66e-05 | 1.68e-04 | 8.60e-05 | 75 |
| hsa0522518 | Esophagus | ESCC | Hepatocellular carcinoma | 109/4205 | 168/8465 | 4.27e-05 | 1.88e-04 | 9.64e-05 | 109 |
| hsa052215 | Esophagus | ESCC | Acute myeloid leukemia | 49/4205 | 67/8465 | 7.43e-05 | 3.07e-04 | 1.57e-04 | 49 |
| Page: 1 2 3 4 5 6 7 8 9 10 |
Top |
Cell-cell communication analysis |
| Identification of potential cell-cell interactions between two cell types and their ligand-receptor pairs for different disease states |
| Ligand | Receptor | LRpair | Pathway | Tissue | Disease Stage |
| Page: 1 |
Top |
Single-cell gene regulatory network inference analysis |
| Find out the significant the regulons (TFs) and the target genes of each regulon across cell types for different disease states |
| TF | Cell Type | Tissue | Disease Stage | Target Gene | RSS | Regulon Activity |
| ∗The dot plots of a searched regulon are shown for all cell subpopulations in each disease state of each tissue based on the regulon specific score inferred using pySCENIC and by calculating the average expression. |
| Page: 1 |
Top |
Somatic mutation of malignant transformation related genes |
| Annotation of somatic variants for genes involved in malignant transformation |
| Hugo Symbol | Variant Class | Variant Classification | dbSNP RS | HGVSc | HGVSp | HGVSp Short | SWISSPROT | BIOTYPE | SIFT | PolyPhen | Tumor Sample Barcode | Tissue | Histology | Sex | Age | Stage | Therapy Types | Drugs | Outcome |
| RPS6KB1 | SNV | Missense_Mutation | novel | c.283N>T | p.Arg95Trp | p.R95W | P23443 | protein_coding | deleterious(0) | probably_damaging(0.968) | TCGA-AN-A046-01 | Breast | breast invasive carcinoma | Female | >=65 | I/II | Unknown | Unknown | SD |
| RPS6KB1 | SNV | Missense_Mutation | c.655C>G | p.Leu219Val | p.L219V | P23443 | protein_coding | deleterious(0) | probably_damaging(0.999) | TCGA-BH-A0B4-01 | Breast | breast invasive carcinoma | Male | >=65 | III/IV | Hormone Therapy | tamoxiphen | SD | |
| RPS6KB1 | SNV | Missense_Mutation | c.1114N>A | p.Leu372Met | p.L372M | P23443 | protein_coding | tolerated(0.1) | benign(0.243) | TCGA-D8-A1JJ-01 | Breast | breast invasive carcinoma | Female | <65 | I/II | Chemotherapy | doxorubicine | SD | |
| RPS6KB1 | SNV | Missense_Mutation | c.142N>A | p.Gly48Ser | p.G48S | P23443 | protein_coding | tolerated(0.75) | benign(0.007) | TCGA-E2-A1LK-01 | Breast | breast invasive carcinoma | Female | >=65 | III/IV | Unknown | Unknown | PD | |
| RPS6KB1 | SNV | Missense_Mutation | c.866G>A | p.Gly289Glu | p.G289E | P23443 | protein_coding | deleterious(0) | probably_damaging(1) | TCGA-JW-A5VL-01 | Cervix | cervical & endocervical cancer | Female | <65 | I/II | Unknown | Unknown | SD | |
| RPS6KB1 | SNV | Missense_Mutation | novel | c.1480G>A | p.Ala494Thr | p.A494T | P23443 | protein_coding | deleterious_low_confidence(0.01) | benign(0.388) | TCGA-AA-3949-01 | Colorectum | colon adenocarcinoma | Female | >=65 | III/IV | Unknown | Unknown | SD |
| RPS6KB1 | SNV | Missense_Mutation | c.1402N>A | p.Pro468Thr | p.P468T | P23443 | protein_coding | tolerated_low_confidence(0.38) | benign(0) | TCGA-AA-3977-01 | Colorectum | colon adenocarcinoma | Male | >=65 | I/II | Unknown | Unknown | SD | |
| RPS6KB1 | SNV | Missense_Mutation | novel | c.283N>T | p.Arg95Trp | p.R95W | P23443 | protein_coding | deleterious(0) | probably_damaging(0.968) | TCGA-AZ-4315-01 | Colorectum | colon adenocarcinoma | Male | <65 | I/II | Unknown | Unknown | SD |
| RPS6KB1 | SNV | Missense_Mutation | novel | c.1053N>A | p.Phe351Leu | p.F351L | P23443 | protein_coding | deleterious(0) | probably_damaging(0.984) | TCGA-AZ-4315-01 | Colorectum | colon adenocarcinoma | Male | <65 | I/II | Unknown | Unknown | SD |
| RPS6KB1 | insertion | Frame_Shift_Ins | novel | c.1524dupA | p.Gln509ThrfsTer24 | p.Q509Tfs*24 | P23443 | protein_coding | TCGA-AA-3877-01 | Colorectum | colon adenocarcinoma | Female | >=65 | I/II | Unknown | Unknown | SD |
| Page: 1 2 3 4 |
Top |
Related drugs of malignant transformation related genes |
| Identification of chemicals and drugs interact with genes involved in malignant transfromation |
| (DGIdb 4.0) |
| Entrez ID | Symbol | Category | Interaction Types | Drug Claim Name | Drug Name | PMIDs |
| 6198 | RPS6KB1 | CELL SURFACE, SERINE THREONINE KINASE, DRUGGABLE GENOME, KINASE, ENZYME, CLINICALLY ACTIONABLE | inhibitor | CHEMBL3545134 | LY-2780301 | |
| 6198 | RPS6KB1 | CELL SURFACE, SERINE THREONINE KINASE, DRUGGABLE GENOME, KINASE, ENZYME, CLINICALLY ACTIONABLE | AR-A014418 | CHEMBL259850 | ||
| 6198 | RPS6KB1 | CELL SURFACE, SERINE THREONINE KINASE, DRUGGABLE GENOME, KINASE, ENZYME, CLINICALLY ACTIONABLE | LY-2584702 | LY-2584702 | ||
| 6198 | RPS6KB1 | CELL SURFACE, SERINE THREONINE KINASE, DRUGGABLE GENOME, KINASE, ENZYME, CLINICALLY ACTIONABLE | JNK INHIBITOR VIII | CHEMBL210618 | ||
| 6198 | RPS6KB1 | CELL SURFACE, SERINE THREONINE KINASE, DRUGGABLE GENOME, KINASE, ENZYME, CLINICALLY ACTIONABLE | SP-600125 | SP-600125 | ||
| 6198 | RPS6KB1 | CELL SURFACE, SERINE THREONINE KINASE, DRUGGABLE GENOME, KINASE, ENZYME, CLINICALLY ACTIONABLE | inhibitor | 249565928 | LY-2584702 | |
| 6198 | RPS6KB1 | CELL SURFACE, SERINE THREONINE KINASE, DRUGGABLE GENOME, KINASE, ENZYME, CLINICALLY ACTIONABLE | DOVITINIB | DOVITINIB | ||
| 6198 | RPS6KB1 | CELL SURFACE, SERINE THREONINE KINASE, DRUGGABLE GENOME, KINASE, ENZYME, CLINICALLY ACTIONABLE | SOTRASTAURIN | SOTRASTAURIN | ||
| 6198 | RPS6KB1 | CELL SURFACE, SERINE THREONINE KINASE, DRUGGABLE GENOME, KINASE, ENZYME, CLINICALLY ACTIONABLE | inhibitor | 249565861 | ||
| 6198 | RPS6KB1 | CELL SURFACE, SERINE THREONINE KINASE, DRUGGABLE GENOME, KINASE, ENZYME, CLINICALLY ACTIONABLE | GNF-PF-2301 | CHEMBL578061 |
| Page: 1 2 3 4 5 |

Copyright 2023-Present -The University of Texas Health Science Center at Houston |