
|
|||||
|
 | |
| |
| |
| |
| |
| |
|
Gene: RPS6KA4 |
Gene summary for RPS6KA4 |
| Gene information | Species | Human | Gene symbol | RPS6KA4 | Gene ID | 8986 |
| Gene name | ribosomal protein S6 kinase A4 | |
| Gene Alias | MSK2 | |
| Cytomap | 11q13.1 | |
| Gene Type | protein-coding | GO ID | GO:0001816 | UniProtAcc | O75676 |
Top |
Malignant transformation analysis |
| Identification of the aberrant gene expression in precancerous and cancerous lesions by comparing the gene expression of stem-like cells in diseased tissues with normal stem cells |
| Entrez ID | Symbol | Replicates | Species | Organ | Tissue | Adj P-value | Log2FC | Malignancy |
| 8986 | RPS6KA4 | LZE7T | Human | Esophagus | ESCC | 5.25e-03 | 1.71e-01 | 0.0667 |
| 8986 | RPS6KA4 | LZE22T | Human | Esophagus | ESCC | 2.09e-03 | 2.93e-01 | 0.068 |
| 8986 | RPS6KA4 | LZE24T | Human | Esophagus | ESCC | 3.23e-16 | 5.24e-01 | 0.0596 |
| 8986 | RPS6KA4 | P1T-E | Human | Esophagus | ESCC | 1.65e-04 | 2.35e-01 | 0.0875 |
| 8986 | RPS6KA4 | P2T-E | Human | Esophagus | ESCC | 1.20e-09 | 1.91e-01 | 0.1177 |
| 8986 | RPS6KA4 | P4T-E | Human | Esophagus | ESCC | 4.47e-18 | 3.61e-01 | 0.1323 |
| 8986 | RPS6KA4 | P5T-E | Human | Esophagus | ESCC | 1.53e-17 | 3.85e-01 | 0.1327 |
| 8986 | RPS6KA4 | P8T-E | Human | Esophagus | ESCC | 1.45e-13 | 2.53e-01 | 0.0889 |
| 8986 | RPS6KA4 | P9T-E | Human | Esophagus | ESCC | 6.14e-10 | 1.85e-01 | 0.1131 |
| 8986 | RPS6KA4 | P10T-E | Human | Esophagus | ESCC | 9.86e-15 | 1.79e-01 | 0.116 |
| 8986 | RPS6KA4 | P11T-E | Human | Esophagus | ESCC | 1.03e-13 | 5.65e-01 | 0.1426 |
| 8986 | RPS6KA4 | P12T-E | Human | Esophagus | ESCC | 2.61e-17 | 3.88e-01 | 0.1122 |
| 8986 | RPS6KA4 | P15T-E | Human | Esophagus | ESCC | 3.88e-06 | 1.38e-01 | 0.1149 |
| 8986 | RPS6KA4 | P16T-E | Human | Esophagus | ESCC | 4.59e-11 | 9.64e-02 | 0.1153 |
| 8986 | RPS6KA4 | P17T-E | Human | Esophagus | ESCC | 2.46e-14 | 4.79e-01 | 0.1278 |
| 8986 | RPS6KA4 | P19T-E | Human | Esophagus | ESCC | 2.98e-07 | 5.55e-01 | 0.1662 |
| 8986 | RPS6KA4 | P20T-E | Human | Esophagus | ESCC | 9.31e-12 | 2.37e-01 | 0.1124 |
| 8986 | RPS6KA4 | P21T-E | Human | Esophagus | ESCC | 2.30e-43 | 9.35e-01 | 0.1617 |
| 8986 | RPS6KA4 | P22T-E | Human | Esophagus | ESCC | 4.83e-07 | 1.39e-01 | 0.1236 |
| 8986 | RPS6KA4 | P23T-E | Human | Esophagus | ESCC | 1.80e-12 | 3.01e-01 | 0.108 |
| Page: 1 2 3 4 5 |
| Tissue | Expression Dynamics | Abbreviation |
| Esophagus |  | ESCC: Esophageal squamous cell carcinoma |
| HGIN: High-grade intraepithelial neoplasias | ||
| LGIN: Low-grade intraepithelial neoplasias | ||
| Oral Cavity | 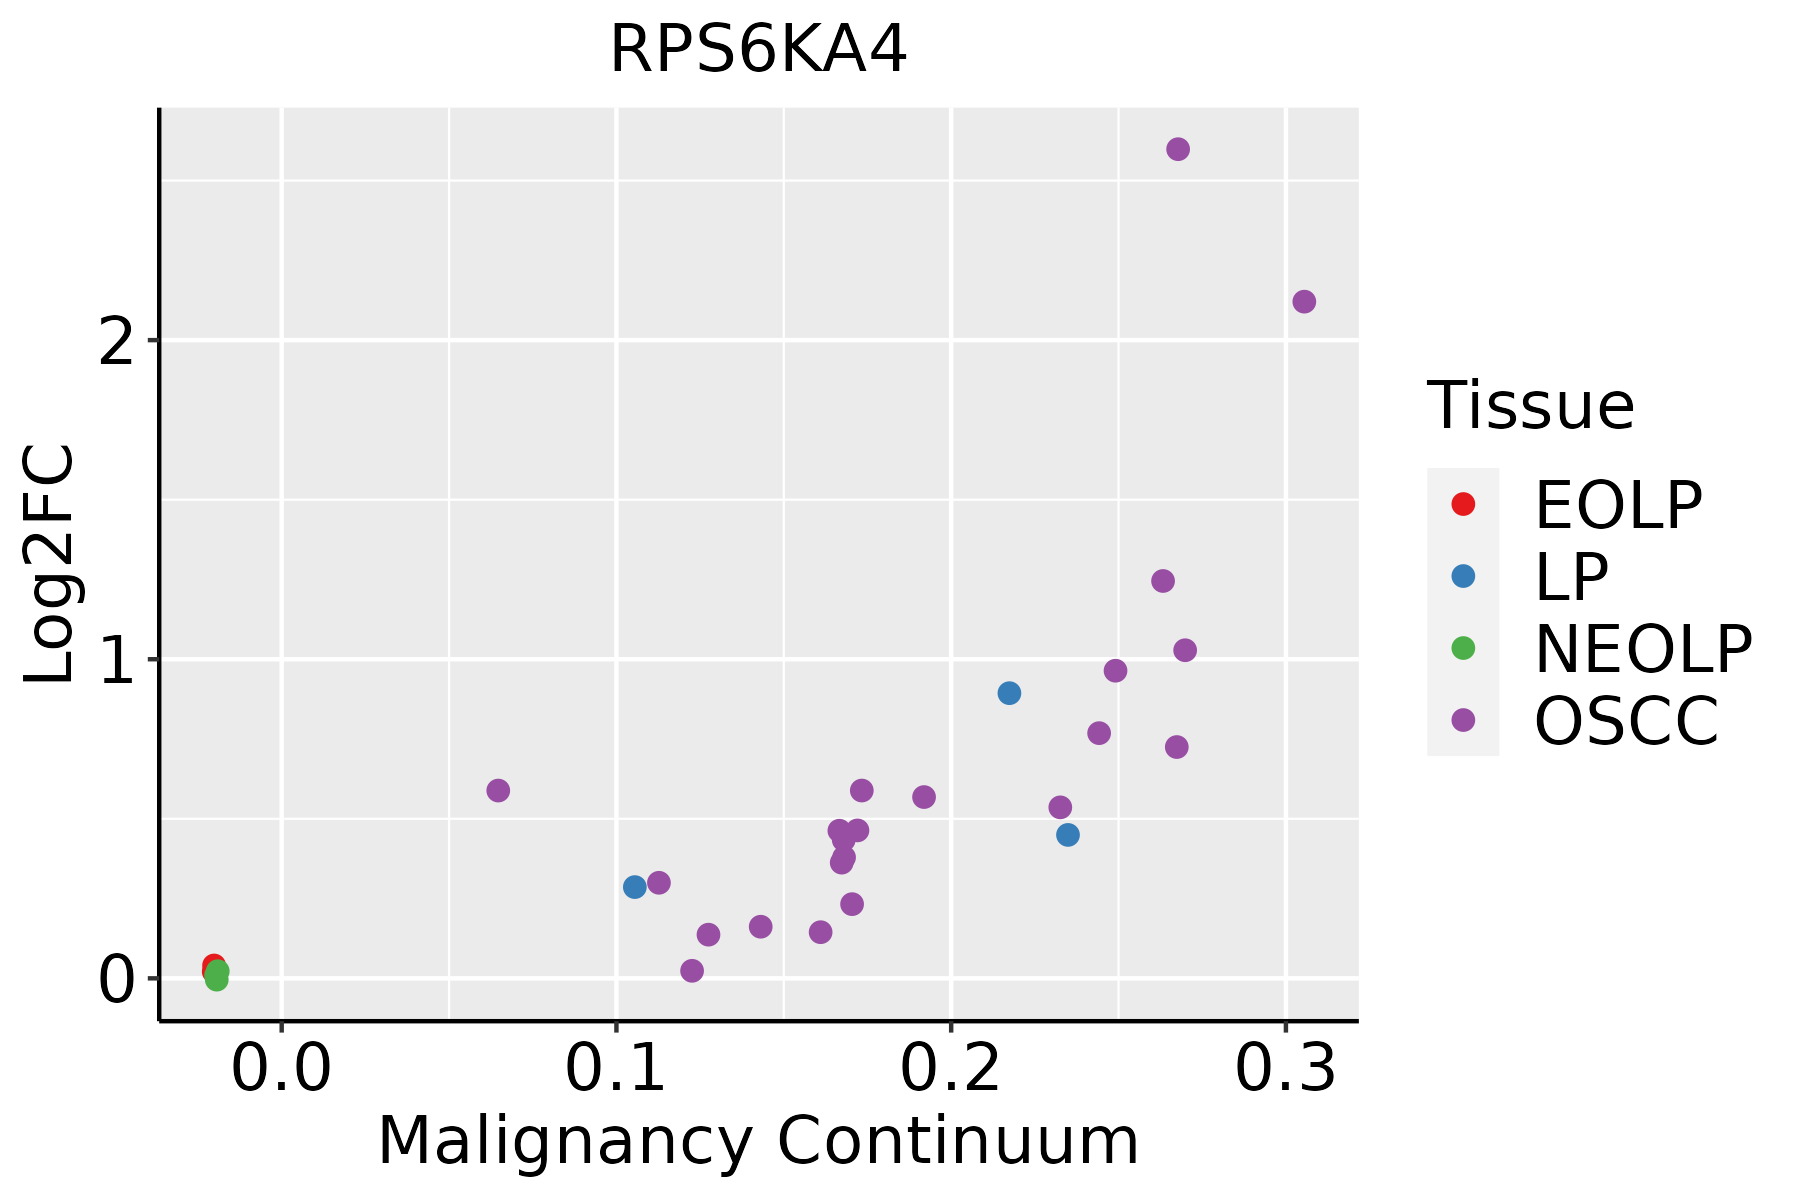 | EOLP: Erosive Oral lichen planus |
| LP: leukoplakia | ||
| NEOLP: Non-erosive oral lichen planus | ||
| OSCC: Oral squamous cell carcinoma | ||
| Skin |  | AK: Actinic keratosis |
| cSCC: Cutaneous squamous cell carcinoma | ||
| SCCIS:squamous cell carcinoma in situ |
| ∗log2FC in expression of this searched gene in stem-like cells from each diseased tissue sample relative to stem-like cells in normal samples in each tissue plotted against the malignancy continuum. Samples are colored based on if they are from different disease stage. |
Top |
Malignant transformation related pathway analysis |
| Find out the enriched GO biological processes and KEGG pathways involved in transition from healthy to precancer to cancer |
| Tissue | Disease Stage | Enriched GO biological Processes |
| Colorectum | AD |  |
| Colorectum | SER |  |
| Colorectum | MSS |  |
| Colorectum | MSI-H |  |
| Colorectum | FAP |  |
| ∗Top 15 enriched GO BP terms are showed in the bar plot of each disease state in each tissue. Each row represents a significant GO biological process which is colored according to the -log10(p.adjust). |
| Page: 1 2 3 4 5 6 7 8 9 |
| GO ID | Tissue | Disease Stage | Description | Gene Ratio | Bg Ratio | pvalue | p.adjust | Count |
| GO:00165707 | Oral cavity | OSCC | histone modification | 270/7305 | 463/18723 | 1.59e-17 | 1.50e-15 | 270 |
| GO:00182056 | Oral cavity | OSCC | peptidyl-lysine modification | 216/7305 | 376/18723 | 2.32e-13 | 1.16e-11 | 216 |
| GO:00435434 | Oral cavity | OSCC | protein acylation | 149/7305 | 243/18723 | 1.33e-12 | 5.80e-11 | 149 |
| GO:00183944 | Oral cavity | OSCC | peptidyl-lysine acetylation | 108/7305 | 169/18723 | 4.55e-11 | 1.45e-09 | 108 |
| GO:00064734 | Oral cavity | OSCC | protein acetylation | 124/7305 | 201/18723 | 5.59e-11 | 1.74e-09 | 124 |
| GO:00165734 | Oral cavity | OSCC | histone acetylation | 96/7305 | 152/18723 | 1.35e-09 | 3.29e-08 | 96 |
| GO:00183934 | Oral cavity | OSCC | internal peptidyl-lysine acetylation | 99/7305 | 158/18723 | 1.41e-09 | 3.39e-08 | 99 |
| GO:00064754 | Oral cavity | OSCC | internal protein amino acid acetylation | 100/7305 | 160/18723 | 1.43e-09 | 3.41e-08 | 100 |
| GO:00310567 | Oral cavity | OSCC | regulation of histone modification | 94/7305 | 152/18723 | 9.57e-09 | 1.99e-07 | 94 |
| GO:00310582 | Oral cavity | OSCC | positive regulation of histone modification | 60/7305 | 92/18723 | 3.17e-07 | 4.79e-06 | 60 |
| GO:00510907 | Oral cavity | OSCC | regulation of DNA-binding transcription factor activity | 221/7305 | 440/18723 | 9.06e-07 | 1.23e-05 | 221 |
| GO:00182098 | Oral cavity | OSCC | peptidyl-serine modification | 175/7305 | 338/18723 | 1.09e-06 | 1.46e-05 | 175 |
| GO:001810510 | Oral cavity | OSCC | peptidyl-serine phosphorylation | 164/7305 | 315/18723 | 1.51e-06 | 1.99e-05 | 164 |
| GO:20007563 | Oral cavity | OSCC | regulation of peptidyl-lysine acetylation | 43/7305 | 63/18723 | 2.43e-06 | 3.06e-05 | 43 |
| GO:19019834 | Oral cavity | OSCC | regulation of protein acetylation | 49/7305 | 77/18723 | 1.05e-05 | 1.10e-04 | 49 |
| GO:00510917 | Oral cavity | OSCC | positive regulation of DNA-binding transcription factor activity | 134/7305 | 260/18723 | 2.52e-05 | 2.35e-04 | 134 |
| GO:00350652 | Oral cavity | OSCC | regulation of histone acetylation | 36/7305 | 54/18723 | 3.55e-05 | 3.17e-04 | 36 |
| GO:00510925 | Oral cavity | OSCC | positive regulation of NF-kappaB transcription factor activity | 82/7305 | 152/18723 | 1.28e-04 | 9.13e-04 | 82 |
| GO:00192214 | Oral cavity | OSCC | cytokine-mediated signaling pathway | 222/7305 | 472/18723 | 2.02e-04 | 1.35e-03 | 222 |
| GO:00705556 | Oral cavity | OSCC | response to interleukin-1 | 73/7305 | 143/18723 | 2.23e-03 | 1.00e-02 | 73 |
| Page: 1 2 3 4 |
| Pathway ID | Tissue | Disease Stage | Description | Gene Ratio | Bg Ratio | pvalue | p.adjust | qvalue | Count |
| hsa0466810 | Esophagus | ESCC | TNF signaling pathway | 89/4205 | 114/8465 | 3.36e-10 | 4.01e-09 | 2.06e-09 | 89 |
| hsa0466817 | Esophagus | ESCC | TNF signaling pathway | 89/4205 | 114/8465 | 3.36e-10 | 4.01e-09 | 2.06e-09 | 89 |
| hsa046689 | Oral cavity | OSCC | TNF signaling pathway | 82/3704 | 114/8465 | 8.30e-10 | 9.59e-09 | 4.88e-09 | 82 |
| hsa0401014 | Oral cavity | OSCC | MAPK signaling pathway | 165/3704 | 302/8465 | 7.11e-05 | 2.74e-04 | 1.40e-04 | 165 |
| hsa0466816 | Oral cavity | OSCC | TNF signaling pathway | 82/3704 | 114/8465 | 8.30e-10 | 9.59e-09 | 4.88e-09 | 82 |
| hsa0401015 | Oral cavity | OSCC | MAPK signaling pathway | 165/3704 | 302/8465 | 7.11e-05 | 2.74e-04 | 1.40e-04 | 165 |
| hsa0466822 | Oral cavity | LP | TNF signaling pathway | 49/2418 | 114/8465 | 6.51e-04 | 3.29e-03 | 2.12e-03 | 49 |
| hsa0466832 | Oral cavity | LP | TNF signaling pathway | 49/2418 | 114/8465 | 6.51e-04 | 3.29e-03 | 2.12e-03 | 49 |
| Page: 1 |
Top |
Cell-cell communication analysis |
| Identification of potential cell-cell interactions between two cell types and their ligand-receptor pairs for different disease states |
| Ligand | Receptor | LRpair | Pathway | Tissue | Disease Stage |
| Page: 1 |
Top |
Single-cell gene regulatory network inference analysis |
| Find out the significant the regulons (TFs) and the target genes of each regulon across cell types for different disease states |
| TF | Cell Type | Tissue | Disease Stage | Target Gene | RSS | Regulon Activity |
| ∗The dot plots of a searched regulon are shown for all cell subpopulations in each disease state of each tissue based on the regulon specific score inferred using pySCENIC and by calculating the average expression. |
| Page: 1 |
Top |
Somatic mutation of malignant transformation related genes |
| Annotation of somatic variants for genes involved in malignant transformation |
| Hugo Symbol | Variant Class | Variant Classification | dbSNP RS | HGVSc | HGVSp | HGVSp Short | SWISSPROT | BIOTYPE | SIFT | PolyPhen | Tumor Sample Barcode | Tissue | Histology | Sex | Age | Stage | Therapy Types | Drugs | Outcome |
| RPS6KA4 | SNV | Missense_Mutation | novel | c.2132N>T | p.Arg711Leu | p.R711L | O75676 | protein_coding | tolerated(0.19) | benign(0.009) | TCGA-A7-A0DB-01 | Breast | breast invasive carcinoma | Female | <65 | I/II | Hormone Therapy | arimidex | SD |
| RPS6KA4 | SNV | Missense_Mutation | novel | c.2134N>T | p.Gly712Cys | p.G712C | O75676 | protein_coding | tolerated(0.21) | benign(0.014) | TCGA-A7-A0DB-01 | Breast | breast invasive carcinoma | Female | <65 | I/II | Hormone Therapy | arimidex | SD |
| RPS6KA4 | SNV | Missense_Mutation | novel | c.939N>T | p.Lys313Asn | p.K313N | O75676 | protein_coding | deleterious(0.03) | benign(0.029) | TCGA-AN-A046-01 | Breast | breast invasive carcinoma | Female | >=65 | I/II | Unknown | Unknown | SD |
| RPS6KA4 | SNV | Missense_Mutation | c.1540G>A | p.Val514Met | p.V514M | O75676 | protein_coding | deleterious(0) | probably_damaging(0.997) | TCGA-AR-A1AH-01 | Breast | breast invasive carcinoma | Female | <65 | I/II | Unspecific | PD | ||
| RPS6KA4 | SNV | Missense_Mutation | c.1285N>T | p.Arg429Cys | p.R429C | O75676 | protein_coding | tolerated(0.08) | possibly_damaging(0.849) | TCGA-D8-A1Y2-01 | Breast | breast invasive carcinoma | Female | >=65 | I/II | Hormone Therapy | tamoxiphen | SD | |
| RPS6KA4 | SNV | Missense_Mutation | novel | c.1225N>A | p.Glu409Lys | p.E409K | O75676 | protein_coding | tolerated(0.11) | benign(0.14) | TCGA-2W-A8YY-01 | Cervix | cervical & endocervical cancer | Female | <65 | I/II | Chemotherapy | cisplatin | CR |
| RPS6KA4 | SNV | Missense_Mutation | novel | c.2273C>T | p.Ser758Phe | p.S758F | O75676 | protein_coding | deleterious_low_confidence(0.02) | benign(0.063) | TCGA-DS-A1OB-01 | Cervix | cervical & endocervical cancer | Female | <65 | I/II | Chemotherapy | carboplatin | PD |
| RPS6KA4 | SNV | Missense_Mutation | novel | c.1325N>C | p.Leu442Pro | p.L442P | O75676 | protein_coding | deleterious(0) | probably_damaging(0.934) | TCGA-5M-AAT6-01 | Colorectum | colon adenocarcinoma | Female | <65 | III/IV | Unknown | Unknown | PD |
| RPS6KA4 | SNV | Missense_Mutation | c.1789G>A | p.Val597Ile | p.V597I | O75676 | protein_coding | tolerated(0.12) | probably_damaging(0.988) | TCGA-A6-2686-01 | Colorectum | colon adenocarcinoma | Female | >=65 | I/II | Unknown | Unknown | SD | |
| RPS6KA4 | SNV | Missense_Mutation | novel | c.481N>T | p.Asp161Tyr | p.D161Y | O75676 | protein_coding | deleterious(0) | probably_damaging(0.999) | TCGA-AA-A010-01 | Colorectum | colon adenocarcinoma | Female | <65 | I/II | Chemotherapy | folinic | CR |
| Page: 1 2 3 4 5 6 |
Top |
Related drugs of malignant transformation related genes |
| Identification of chemicals and drugs interact with genes involved in malignant transfromation |
| (DGIdb 4.0) |
| Entrez ID | Symbol | Category | Interaction Types | Drug Claim Name | Drug Name | PMIDs |
| 8986 | RPS6KA4 | SERINE THREONINE KINASE, KINASE, DRUGGABLE GENOME, TRANSCRIPTION FACTOR, CLINICALLY ACTIONABLE, ENZYME | inhibitor | HESPERADIN | HESPERADIN | 19035792 |
| 8986 | RPS6KA4 | SERINE THREONINE KINASE, KINASE, DRUGGABLE GENOME, TRANSCRIPTION FACTOR, CLINICALLY ACTIONABLE, ENZYME | inhibitor | 252827421 | ||
| 8986 | RPS6KA4 | SERINE THREONINE KINASE, KINASE, DRUGGABLE GENOME, TRANSCRIPTION FACTOR, CLINICALLY ACTIONABLE, ENZYME | LINIFANIB | LINIFANIB |
| Page: 1 |

Copyright 2023-Present -The University of Texas Health Science Center at Houston |