
|
|||||
|
 | |
| |
| |
| |
| |
| |
|
Gene: RPL30 |
Gene summary for RPL30 |
| Gene information | Species | Human | Gene symbol | RPL30 | Gene ID | 6156 |
| Gene name | ribosomal protein L30 | |
| Gene Alias | L30 | |
| Cytomap | 8q22.2 | |
| Gene Type | protein-coding | GO ID | GO:0001906 | UniProtAcc | A0A024R9D3 |
Top |
Malignant transformation analysis |
| Identification of the aberrant gene expression in precancerous and cancerous lesions by comparing the gene expression of stem-like cells in diseased tissues with normal stem cells |
| Entrez ID | Symbol | Replicates | Species | Organ | Tissue | Adj P-value | Log2FC | Malignancy |
| 6156 | RPL30 | CA_HPV_1 | Human | Cervix | CC | 1.93e-05 | -1.89e-01 | 0.0264 |
| 6156 | RPL30 | CA_HPV_2 | Human | Cervix | CC | 1.90e-27 | -3.10e-01 | 0.0391 |
| 6156 | RPL30 | CCI_1 | Human | Cervix | CC | 5.07e-70 | -2.06e+00 | 0.528 |
| 6156 | RPL30 | CCI_2 | Human | Cervix | CC | 5.91e-62 | -1.78e+00 | 0.5249 |
| 6156 | RPL30 | CCI_3 | Human | Cervix | CC | 2.68e-84 | -1.96e+00 | 0.516 |
| 6156 | RPL30 | CCII_1 | Human | Cervix | CC | 2.21e-96 | -2.16e+00 | 0.3249 |
| 6156 | RPL30 | Tumor | Human | Cervix | CC | 2.32e-69 | -4.15e-01 | 0.1241 |
| 6156 | RPL30 | sample1 | Human | Cervix | CC | 4.09e-18 | -3.07e-01 | 0.0959 |
| 6156 | RPL30 | sample3 | Human | Cervix | CC | 8.00e-95 | -4.94e-01 | 0.1387 |
| 6156 | RPL30 | H2 | Human | Cervix | HSIL_HPV | 3.03e-68 | -5.31e-01 | 0.0632 |
| 6156 | RPL30 | L1 | Human | Cervix | CC | 1.34e-07 | -2.66e-01 | 0.0802 |
| 6156 | RPL30 | T1 | Human | Cervix | CC | 4.08e-57 | -5.51e-01 | 0.0918 |
| 6156 | RPL30 | T2 | Human | Cervix | CC | 2.57e-02 | -1.75e-01 | 0.0709 |
| 6156 | RPL30 | T3 | Human | Cervix | CC | 3.30e-104 | -5.15e-01 | 0.1389 |
| 6156 | RPL30 | HTA11_2487_2000001011 | Human | Colorectum | SER | 1.50e-06 | 4.97e-01 | -0.1808 |
| 6156 | RPL30 | HTA11_347_2000001011 | Human | Colorectum | AD | 8.61e-06 | 4.35e-01 | -0.1954 |
| 6156 | RPL30 | HTA11_696_2000001011 | Human | Colorectum | AD | 4.87e-05 | 3.22e-01 | -0.1464 |
| 6156 | RPL30 | HTA11_866_2000001011 | Human | Colorectum | AD | 1.26e-03 | 2.91e-01 | -0.1001 |
| 6156 | RPL30 | HTA11_1391_2000001011 | Human | Colorectum | AD | 3.86e-08 | 5.70e-01 | -0.059 |
| 6156 | RPL30 | HTA11_546_2000001011 | Human | Colorectum | AD | 7.89e-04 | 6.07e-01 | -0.0842 |
| Page: 1 2 3 4 5 6 7 8 9 10 11 12 13 14 15 16 17 18 |
| Tissue | Expression Dynamics | Abbreviation |
| Cervix | 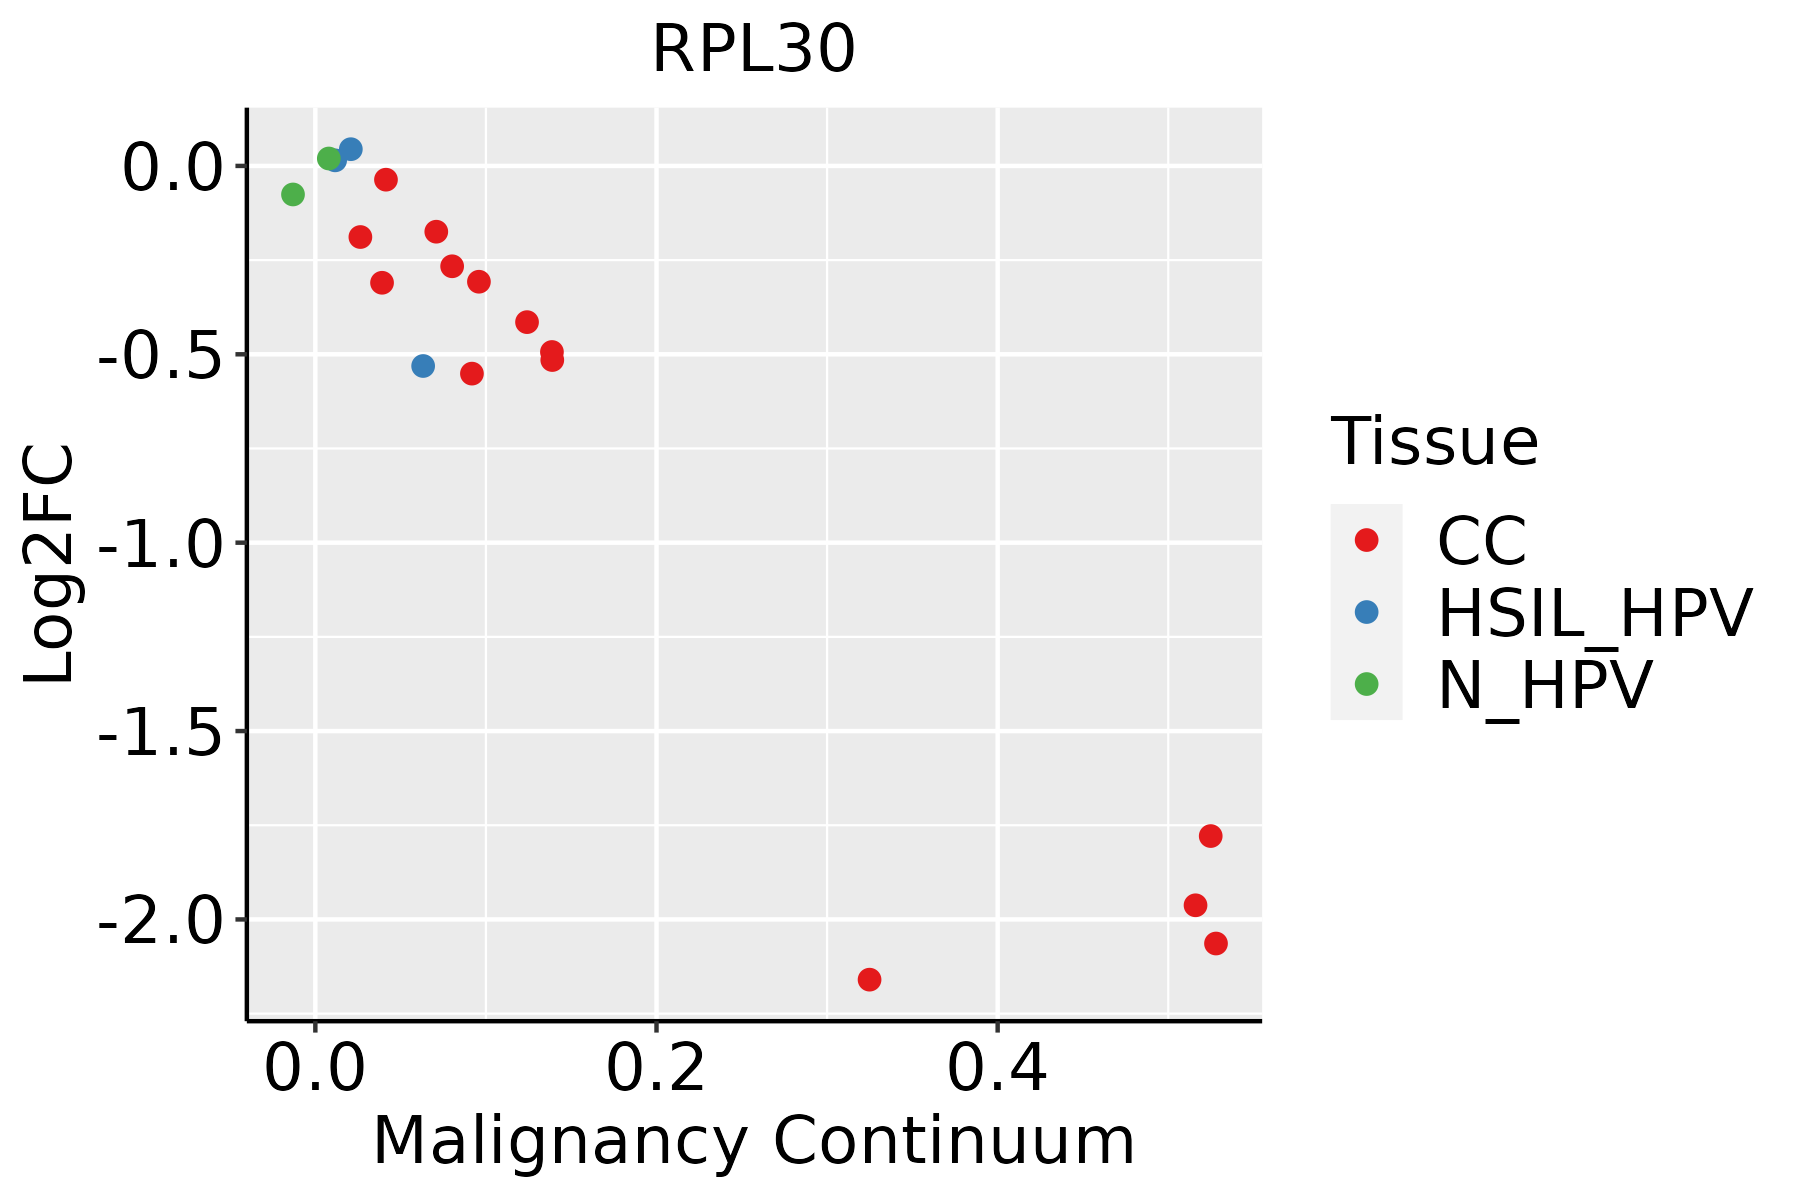 | CC: Cervix cancer |
| HSIL_HPV: HPV-infected high-grade squamous intraepithelial lesions | ||
| N_HPV: HPV-infected normal cervix | ||
| Colorectum (GSE201348) |  | FAP: Familial adenomatous polyposis |
| CRC: Colorectal cancer | ||
| Colorectum (HTA11) |  | AD: Adenomas |
| SER: Sessile serrated lesions | ||
| MSI-H: Microsatellite-high colorectal cancer | ||
| MSS: Microsatellite stable colorectal cancer | ||
| Endometrium | 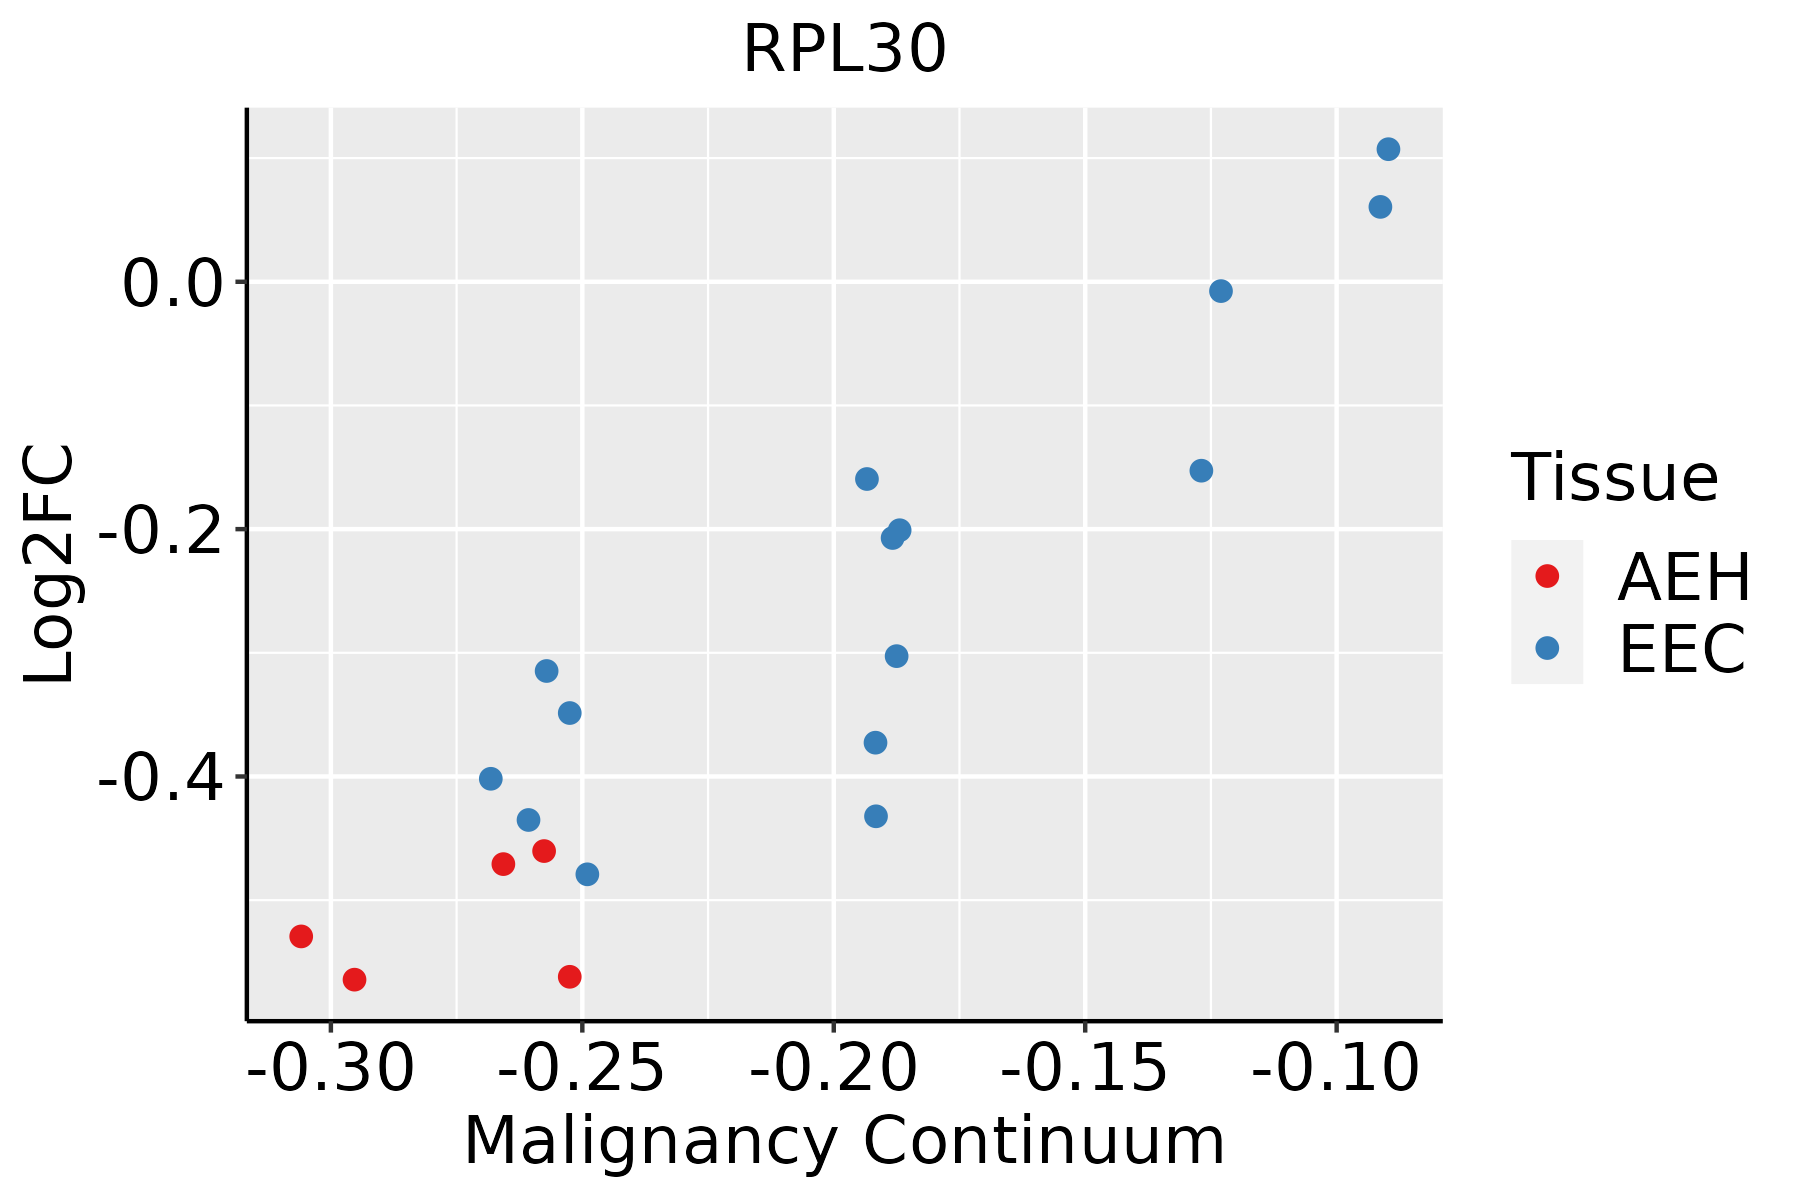 | AEH: Atypical endometrial hyperplasia |
| EEC: Endometrioid Cancer | ||
| Esophagus | 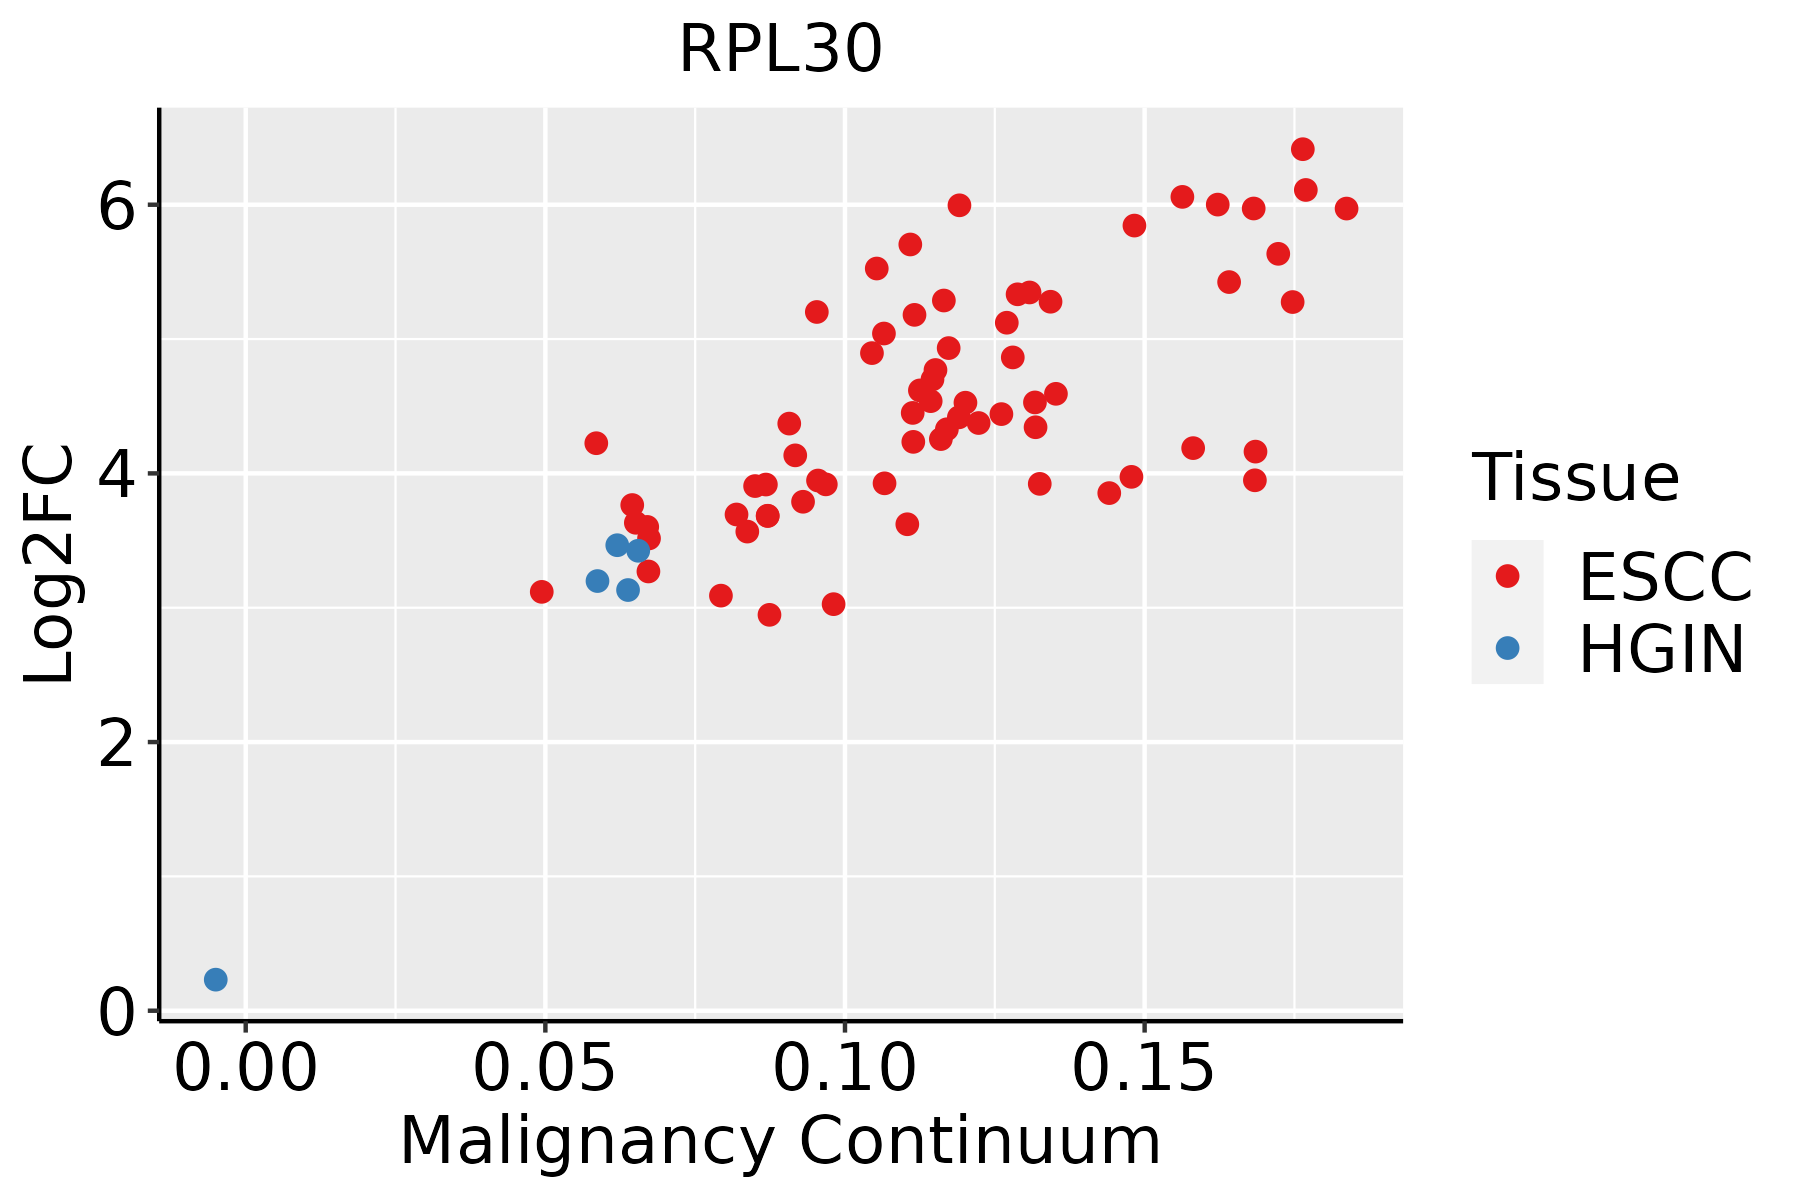 | ESCC: Esophageal squamous cell carcinoma |
| HGIN: High-grade intraepithelial neoplasias | ||
| LGIN: Low-grade intraepithelial neoplasias | ||
| GC | 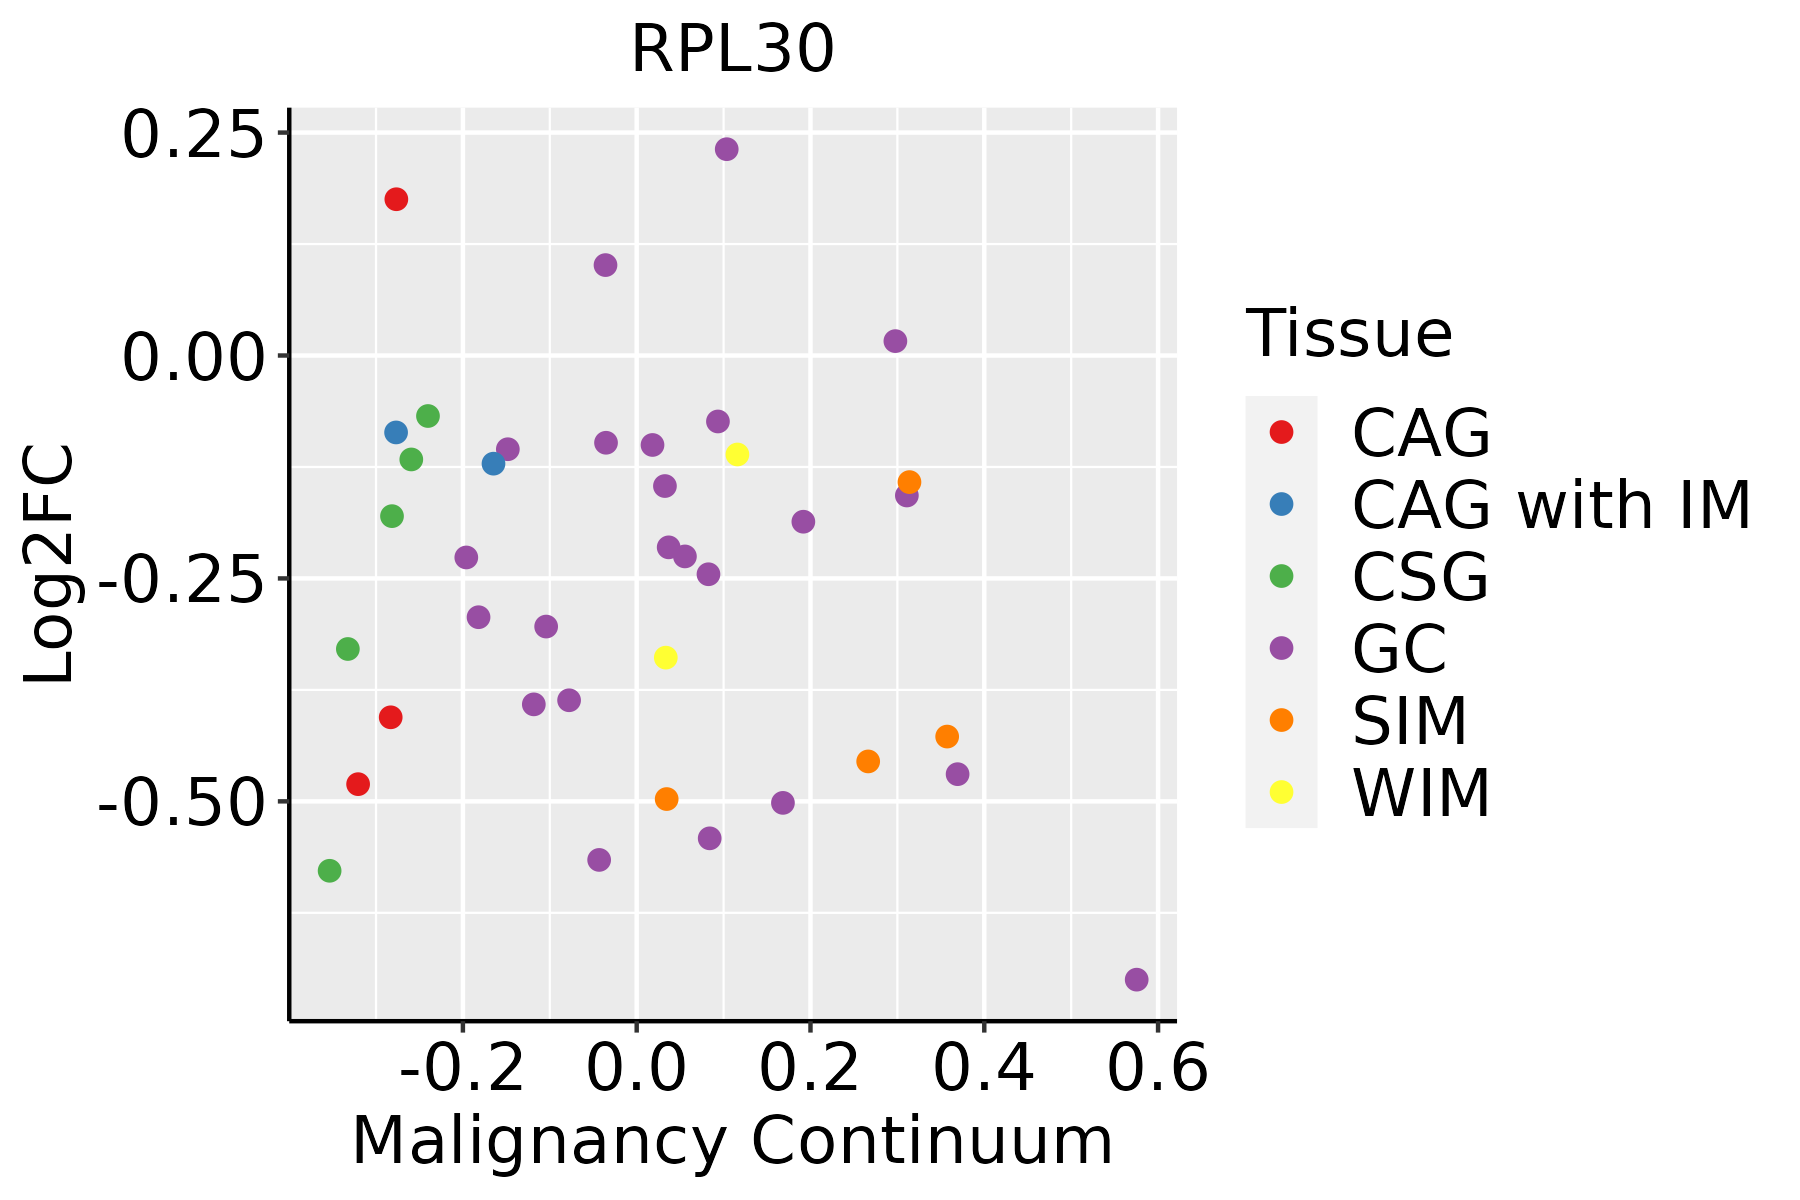 | CAG: Chronic atrophic gastritis |
| CAG with IM: Chronic atrophic gastritis with intestinal metaplasia | ||
| CSG: Chronic superficial gastritis | ||
| GC: Gastric cancer | ||
| SIM: Severe intestinal metaplasia | ||
| WIM: Wild intestinal metaplasia | ||
| Liver |  | HCC: Hepatocellular carcinoma |
| NAFLD: Non-alcoholic fatty liver disease | ||
| Lung | 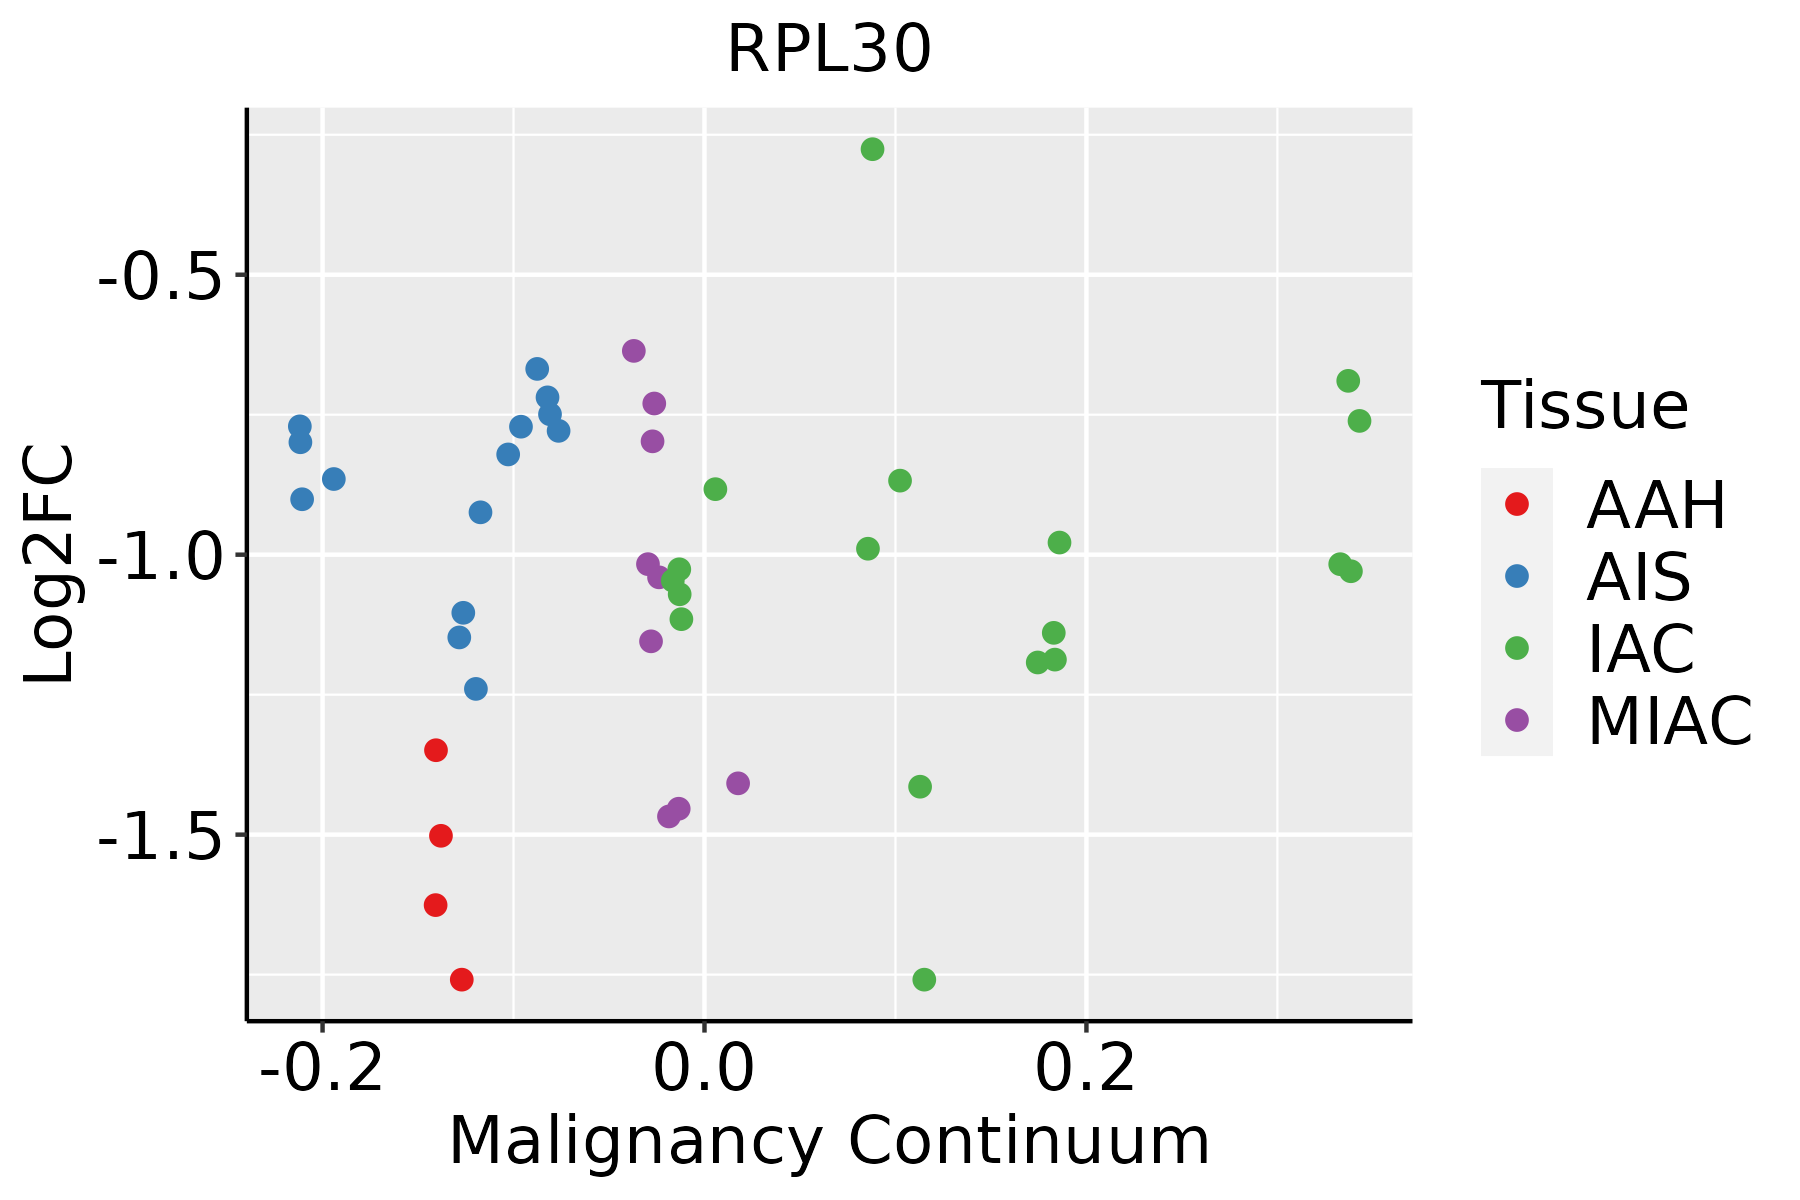 | AAH: Atypical adenomatous hyperplasia |
| AIS: Adenocarcinoma in situ | ||
| IAC: Invasive lung adenocarcinoma | ||
| MIA: Minimally invasive adenocarcinoma | ||
| Oral Cavity | 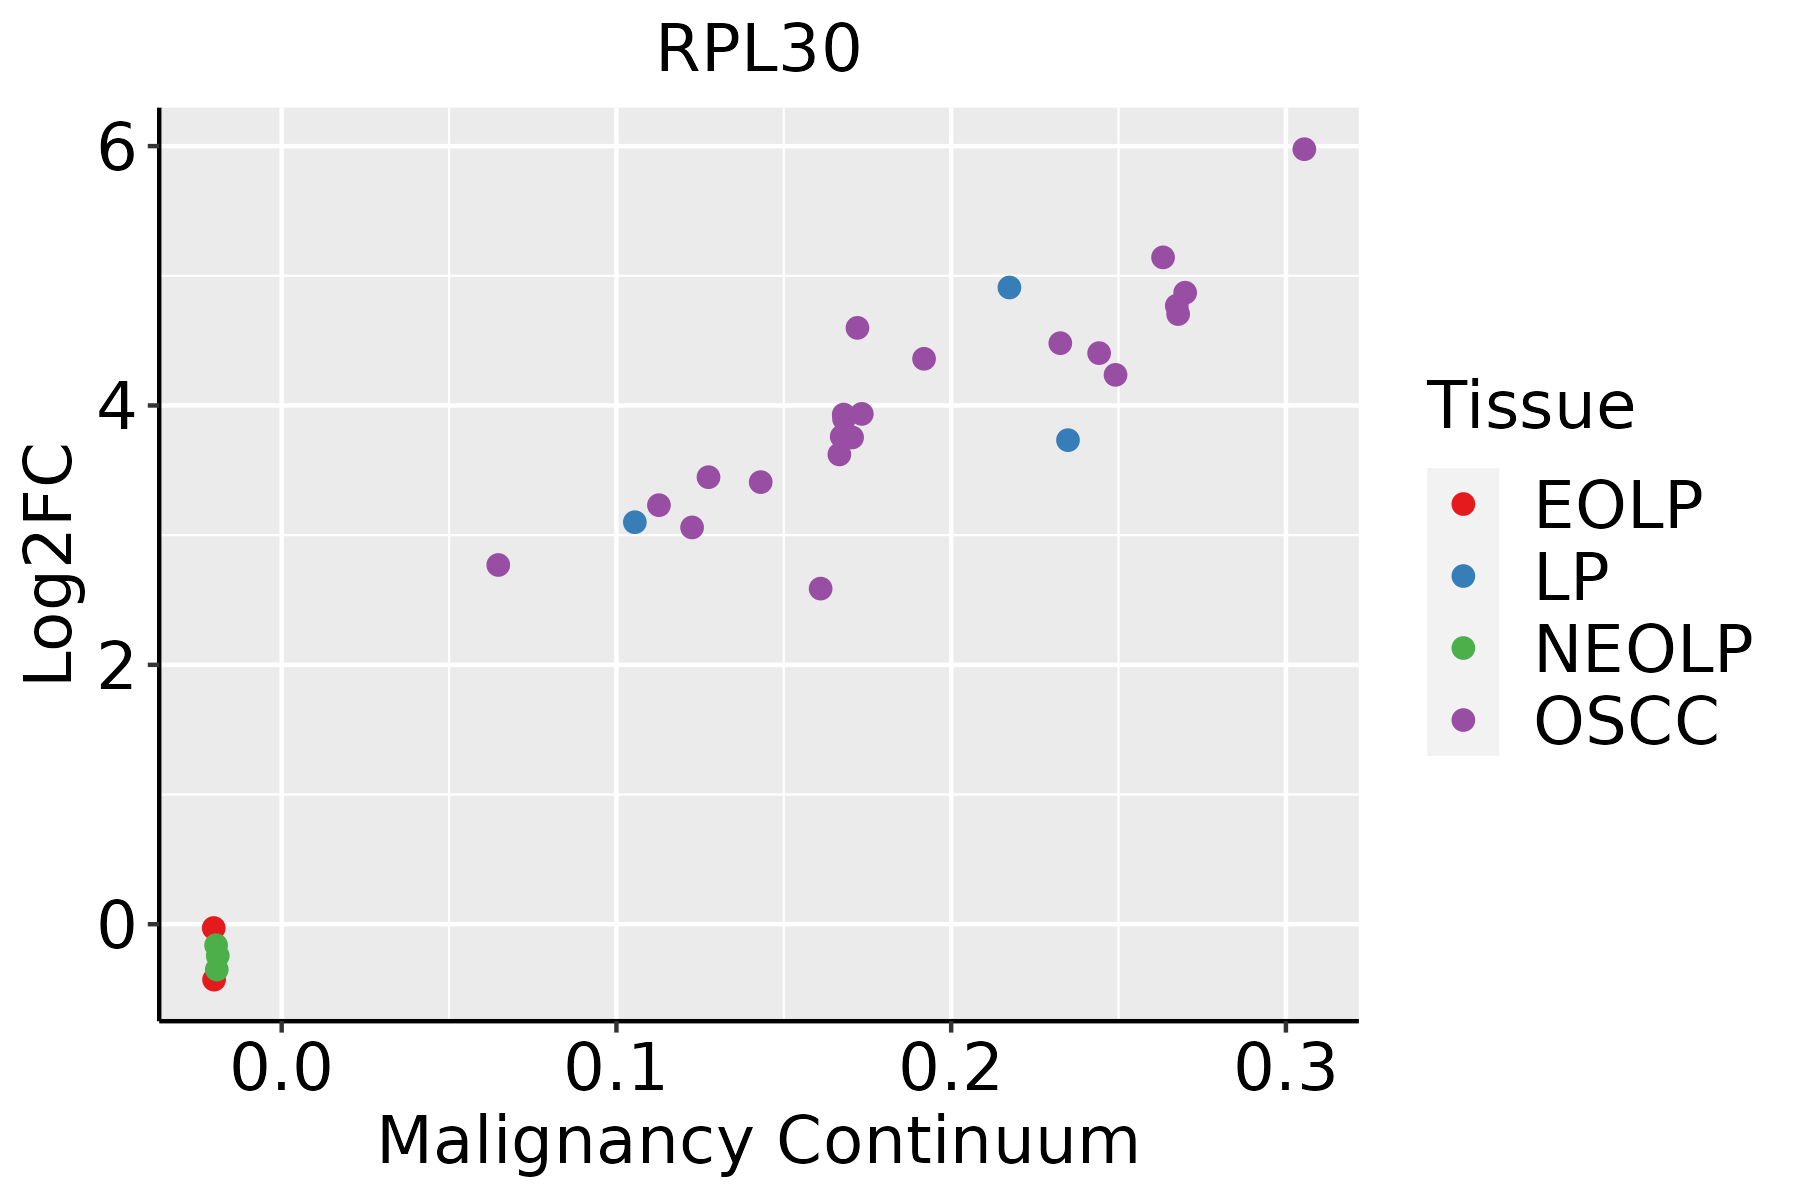 | EOLP: Erosive Oral lichen planus |
| LP: leukoplakia | ||
| NEOLP: Non-erosive oral lichen planus | ||
| OSCC: Oral squamous cell carcinoma | ||
| Prostate | 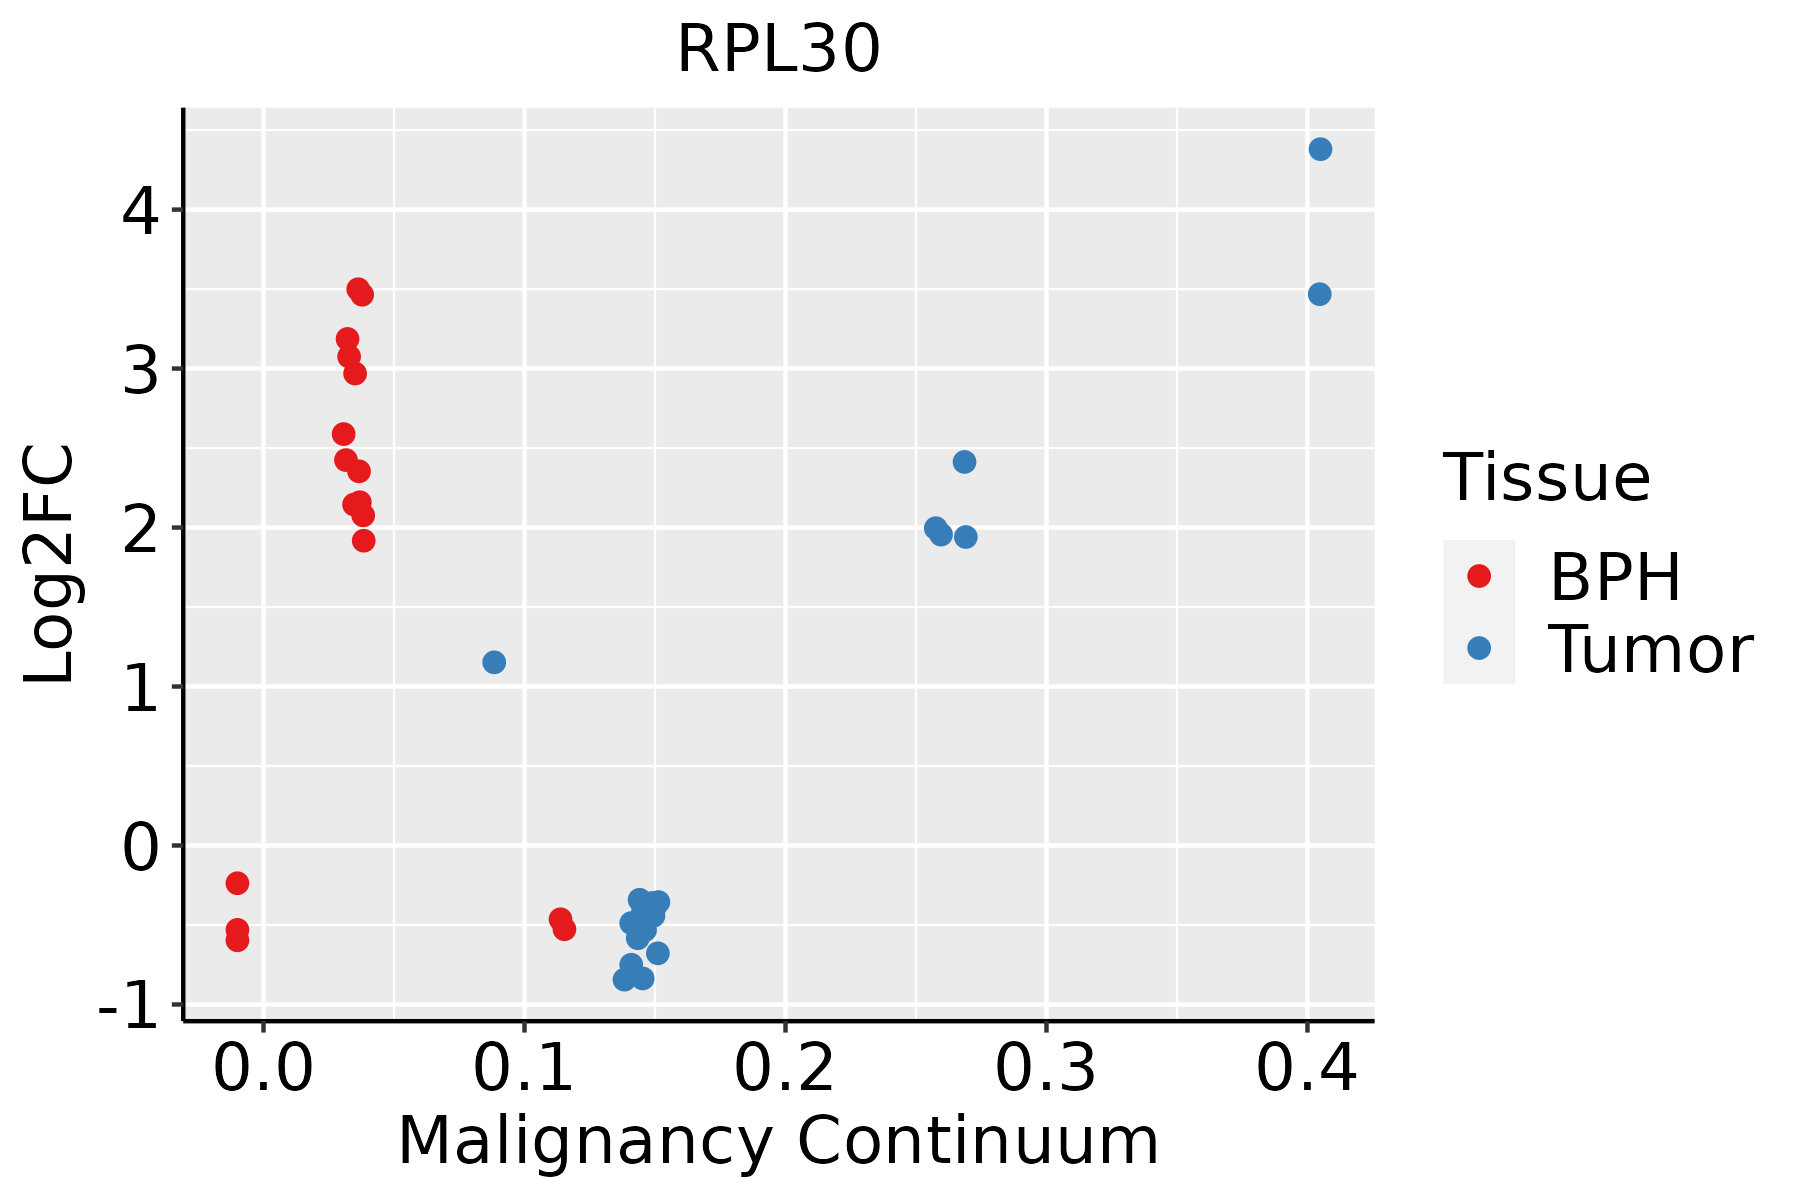 | BPH: Benign Prostatic Hyperplasia |
| Skin | 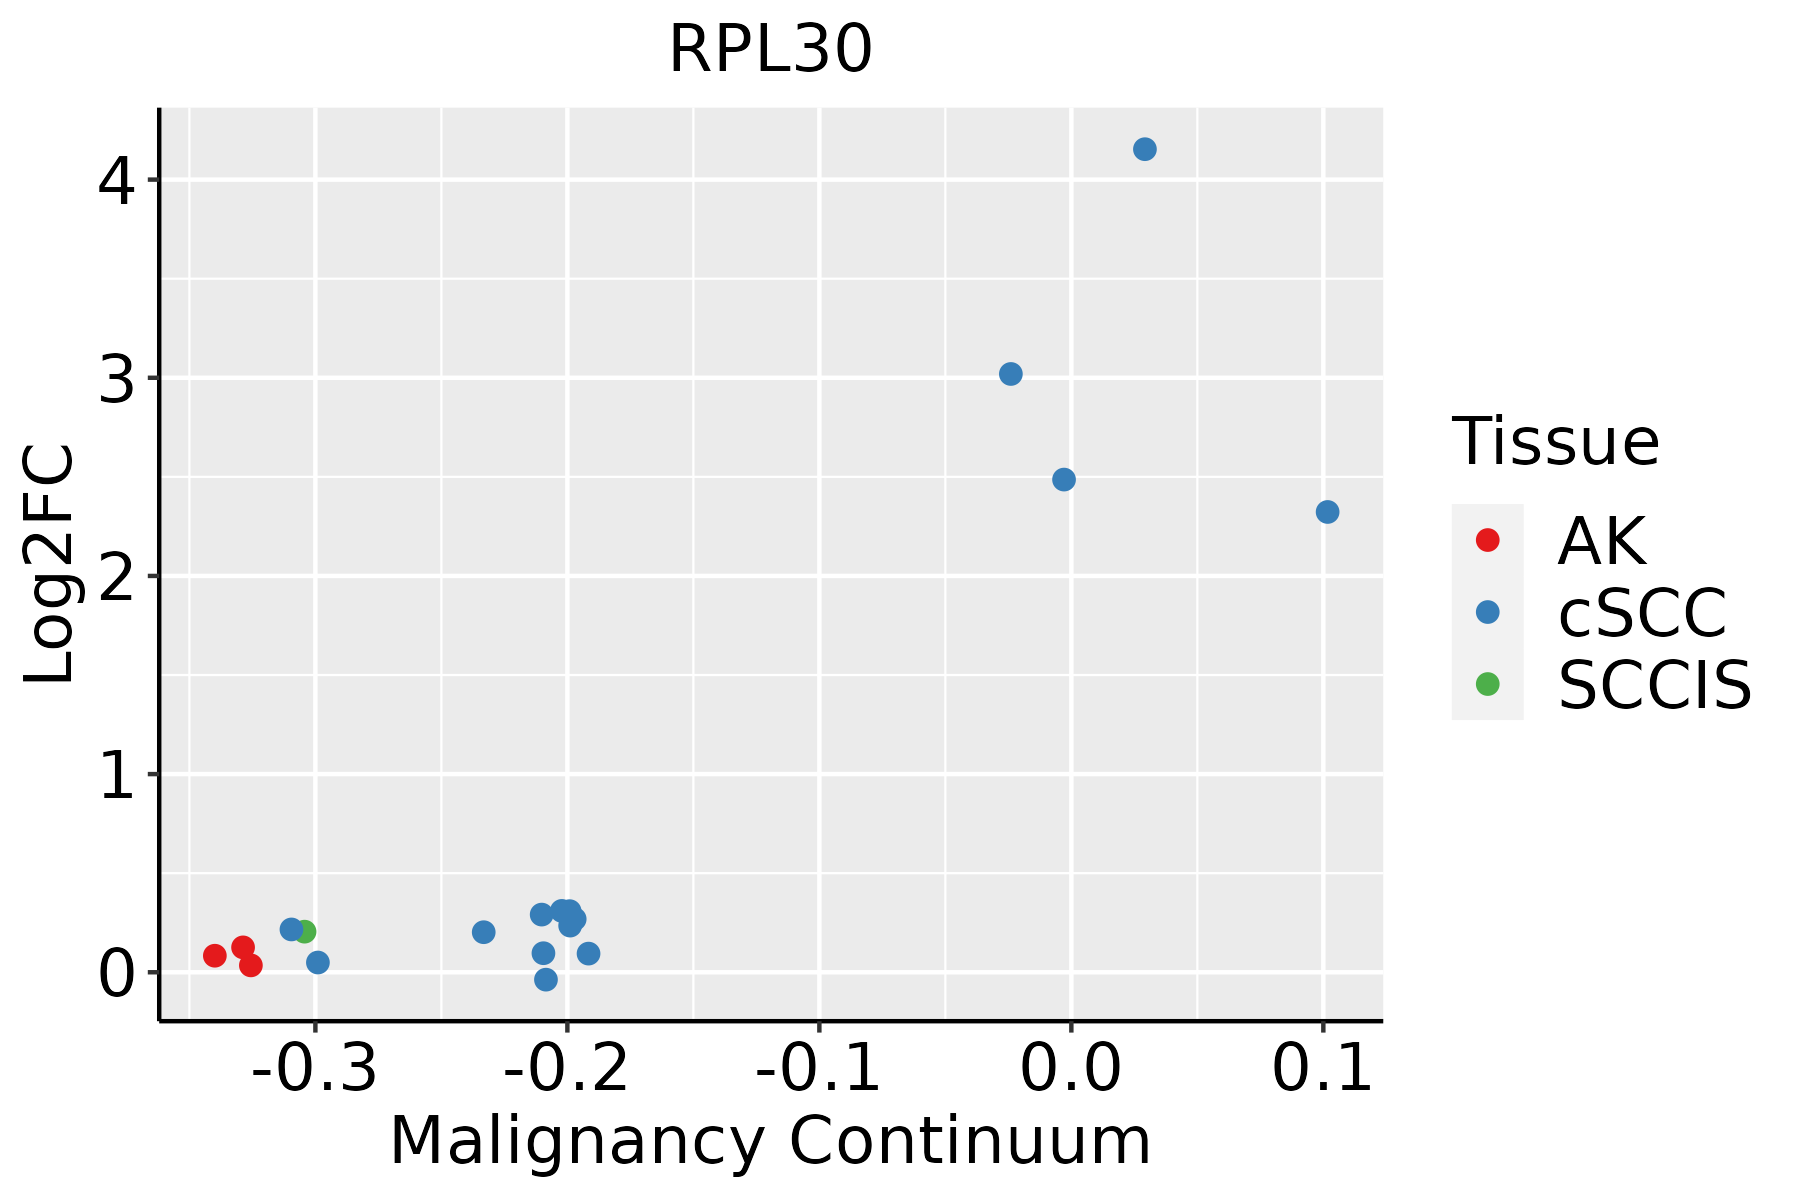 | AK: Actinic keratosis |
| cSCC: Cutaneous squamous cell carcinoma | ||
| SCCIS:squamous cell carcinoma in situ | ||
| Thyroid | 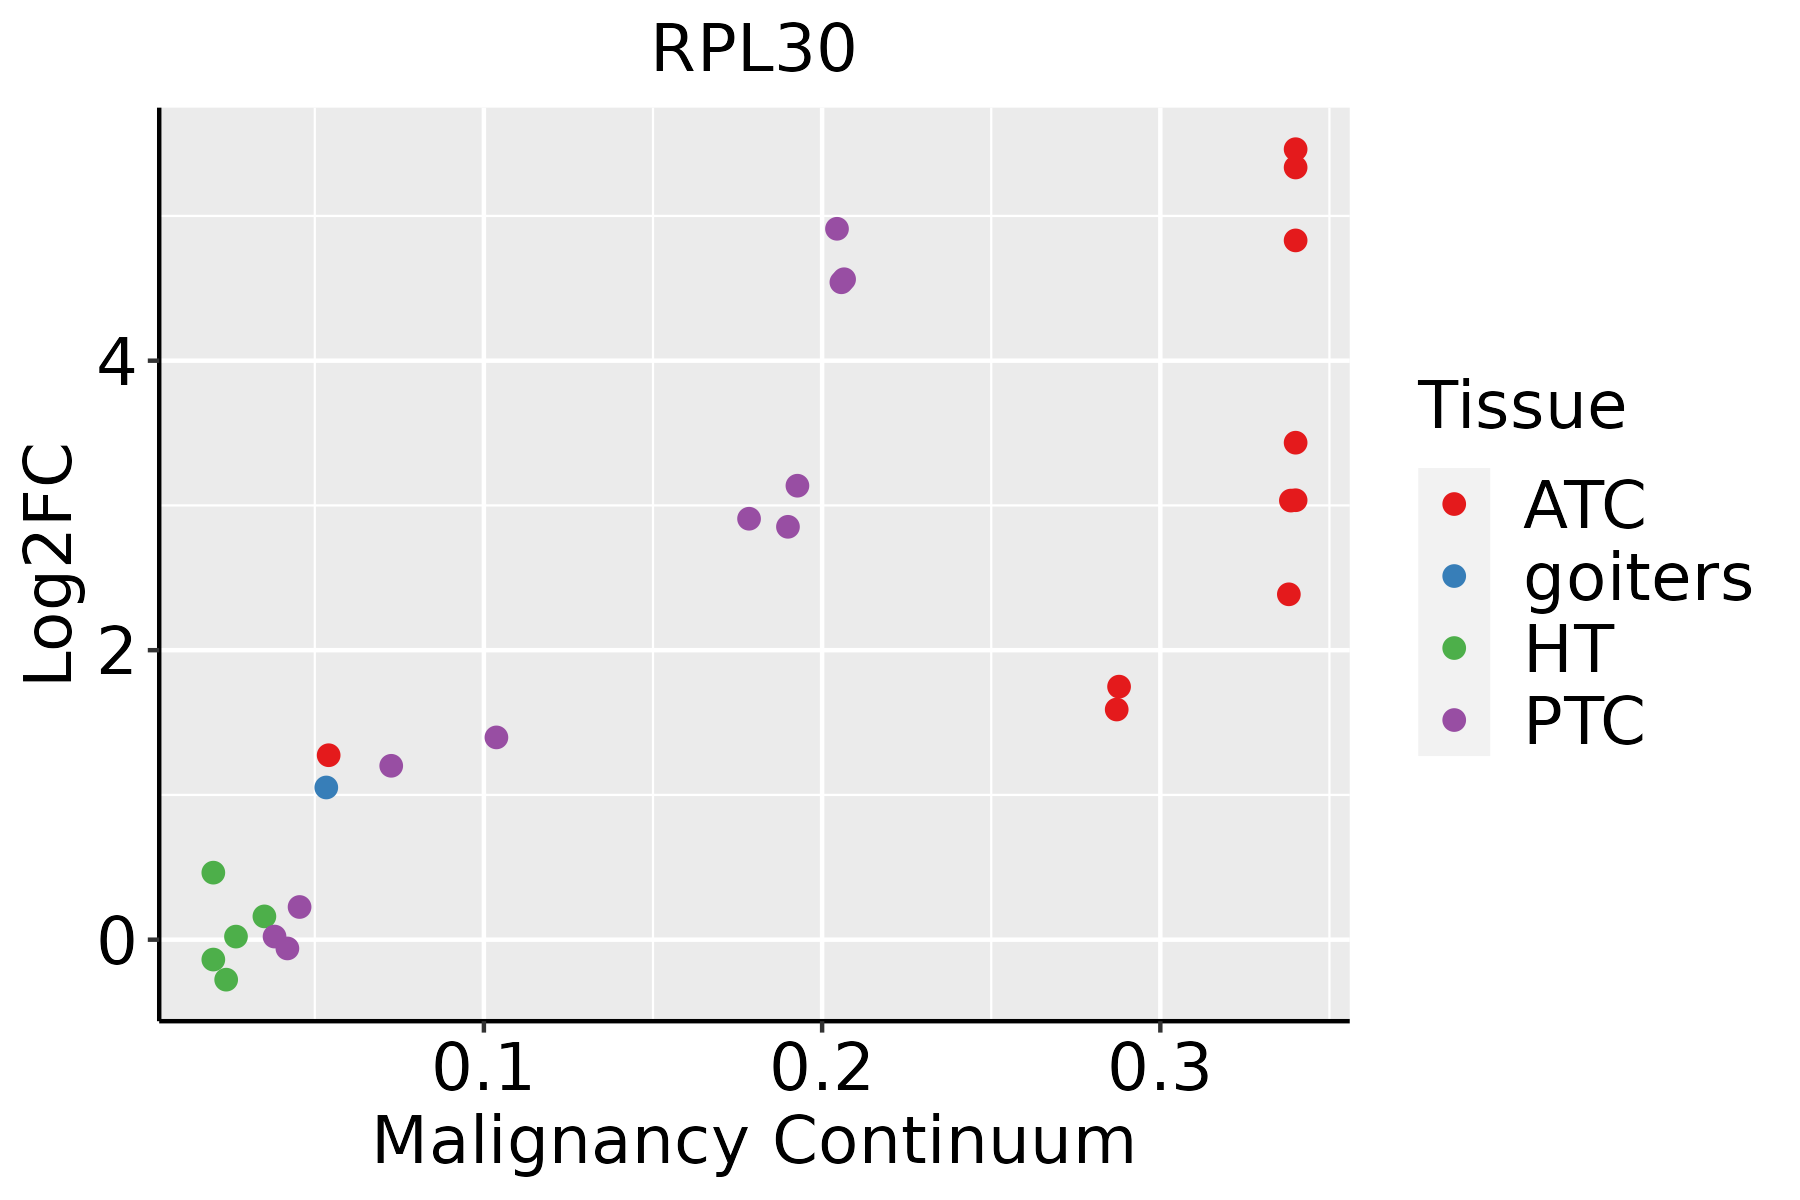 | ATC: Anaplastic thyroid cancer |
| HT: Hashimoto's thyroiditis | ||
| PTC: Papillary thyroid cancer |
| ∗log2FC in expression of this searched gene in stem-like cells from each diseased tissue sample relative to stem-like cells in normal samples in each tissue plotted against the malignancy continuum. Samples are colored based on if they are from different disease stage. |
Top |
Malignant transformation related pathway analysis |
| Find out the enriched GO biological processes and KEGG pathways involved in transition from healthy to precancer to cancer |
| Tissue | Disease Stage | Enriched GO biological Processes |
| Colorectum | AD |  |
| Colorectum | SER |  |
| Colorectum | MSS |  |
| Colorectum | MSI-H |  |
| Colorectum | FAP |  |
| ∗Top 15 enriched GO BP terms are showed in the bar plot of each disease state in each tissue. Each row represents a significant GO biological process which is colored according to the -log10(p.adjust). |
| Page: 1 2 3 4 5 6 7 8 9 |
| GO ID | Tissue | Disease Stage | Description | Gene Ratio | Bg Ratio | pvalue | p.adjust | Count |
| GO:0002181111 | Esophagus | ESCC | cytoplasmic translation | 135/8552 | 148/18723 | 4.17e-32 | 2.65e-29 | 135 |
| GO:00021817 | Liver | NAFLD | cytoplasmic translation | 93/1882 | 148/18723 | 1.44e-55 | 8.41e-52 | 93 |
| GO:000218112 | Liver | Cirrhotic | cytoplasmic translation | 120/4634 | 148/18723 | 2.95e-47 | 1.85e-43 | 120 |
| GO:000218122 | Liver | HCC | cytoplasmic translation | 132/7958 | 148/18723 | 9.09e-33 | 5.76e-30 | 132 |
| GO:000218132 | Liver | Cyst | cytoplasmic translation | 70/496 | 148/18723 | 9.01e-71 | 3.85e-67 | 70 |
| GO:00197306 | Liver | Cyst | antimicrobial humoral response | 11/496 | 122/18723 | 4.02e-04 | 1.24e-02 | 11 |
| GO:00019066 | Liver | Cyst | cell killing | 13/496 | 188/18723 | 1.55e-03 | 3.61e-02 | 13 |
| GO:00021818 | Lung | IAC | cytoplasmic translation | 85/2061 | 148/18723 | 3.11e-43 | 1.85e-39 | 85 |
| GO:000218113 | Lung | AIS | cytoplasmic translation | 85/1849 | 148/18723 | 5.48e-47 | 3.19e-43 | 85 |
| GO:000218123 | Lung | AAH | cytoplasmic translation | 64/613 | 148/18723 | 1.74e-55 | 7.99e-52 | 64 |
| GO:000218133 | Lung | MIAC | cytoplasmic translation | 73/967 | 148/18723 | 4.84e-54 | 2.48e-50 | 73 |
| GO:000218120 | Oral cavity | OSCC | cytoplasmic translation | 133/7305 | 148/18723 | 1.94e-38 | 2.46e-35 | 133 |
| GO:0002181110 | Oral cavity | LP | cytoplasmic translation | 124/4623 | 148/18723 | 5.09e-52 | 3.19e-48 | 124 |
| GO:000218126 | Oral cavity | EOLP | cytoplasmic translation | 102/2218 | 148/18723 | 7.91e-60 | 4.74e-56 | 102 |
| GO:000218134 | Oral cavity | NEOLP | cytoplasmic translation | 102/2005 | 148/18723 | 3.70e-64 | 2.20e-60 | 102 |
| GO:000218118 | Prostate | BPH | cytoplasmic translation | 115/3107 | 148/18723 | 1.08e-60 | 6.68e-57 | 115 |
| GO:000218119 | Prostate | Tumor | cytoplasmic translation | 115/3246 | 148/18723 | 1.36e-58 | 8.43e-55 | 115 |
| GO:000218128 | Skin | AK | cytoplasmic translation | 101/1910 | 148/18723 | 5.98e-65 | 3.54e-61 | 101 |
| GO:0002181112 | Skin | SCCIS | cytoplasmic translation | 58/919 | 148/18723 | 2.30e-37 | 1.22e-33 | 58 |
| GO:000218129 | Skin | cSCC | cytoplasmic translation | 127/4864 | 148/18723 | 4.83e-53 | 7.57e-50 | 127 |
| Page: 1 2 3 4 |
| Pathway ID | Tissue | Disease Stage | Description | Gene Ratio | Bg Ratio | pvalue | p.adjust | qvalue | Count |
| hsa0517120 | Cervix | CC | Coronavirus disease - COVID-19 | 111/1267 | 232/8465 | 1.82e-33 | 5.90e-31 | 3.49e-31 | 111 |
| hsa0301020 | Cervix | CC | Ribosome | 85/1267 | 167/8465 | 3.17e-28 | 5.14e-26 | 3.04e-26 | 85 |
| hsa05171110 | Cervix | CC | Coronavirus disease - COVID-19 | 111/1267 | 232/8465 | 1.82e-33 | 5.90e-31 | 3.49e-31 | 111 |
| hsa03010110 | Cervix | CC | Ribosome | 85/1267 | 167/8465 | 3.17e-28 | 5.14e-26 | 3.04e-26 | 85 |
| hsa0301025 | Cervix | HSIL_HPV | Ribosome | 80/459 | 167/8465 | 9.61e-58 | 2.82e-55 | 2.28e-55 | 80 |
| hsa0517125 | Cervix | HSIL_HPV | Coronavirus disease - COVID-19 | 91/459 | 232/8465 | 2.14e-56 | 3.13e-54 | 2.53e-54 | 91 |
| hsa0301035 | Cervix | HSIL_HPV | Ribosome | 80/459 | 167/8465 | 9.61e-58 | 2.82e-55 | 2.28e-55 | 80 |
| hsa0517135 | Cervix | HSIL_HPV | Coronavirus disease - COVID-19 | 91/459 | 232/8465 | 2.14e-56 | 3.13e-54 | 2.53e-54 | 91 |
| hsa03010 | Colorectum | AD | Ribosome | 96/2092 | 167/8465 | 8.28e-20 | 5.54e-18 | 3.54e-18 | 96 |
| hsa05171 | Colorectum | AD | Coronavirus disease - COVID-19 | 113/2092 | 232/8465 | 9.90e-16 | 2.55e-14 | 1.63e-14 | 113 |
| hsa030101 | Colorectum | AD | Ribosome | 96/2092 | 167/8465 | 8.28e-20 | 5.54e-18 | 3.54e-18 | 96 |
| hsa051711 | Colorectum | AD | Coronavirus disease - COVID-19 | 113/2092 | 232/8465 | 9.90e-16 | 2.55e-14 | 1.63e-14 | 113 |
| hsa030102 | Colorectum | SER | Ribosome | 92/1580 | 167/8465 | 2.21e-26 | 3.66e-24 | 2.66e-24 | 92 |
| hsa051712 | Colorectum | SER | Coronavirus disease - COVID-19 | 98/1580 | 232/8465 | 3.33e-17 | 8.50e-16 | 6.17e-16 | 98 |
| hsa030103 | Colorectum | SER | Ribosome | 92/1580 | 167/8465 | 2.21e-26 | 3.66e-24 | 2.66e-24 | 92 |
| hsa051713 | Colorectum | SER | Coronavirus disease - COVID-19 | 98/1580 | 232/8465 | 3.33e-17 | 8.50e-16 | 6.17e-16 | 98 |
| hsa030104 | Colorectum | MSS | Ribosome | 96/1875 | 167/8465 | 1.82e-23 | 2.03e-21 | 1.24e-21 | 96 |
| hsa051714 | Colorectum | MSS | Coronavirus disease - COVID-19 | 108/1875 | 232/8465 | 6.50e-17 | 1.67e-15 | 1.03e-15 | 108 |
| hsa030105 | Colorectum | MSS | Ribosome | 96/1875 | 167/8465 | 1.82e-23 | 2.03e-21 | 1.24e-21 | 96 |
| hsa051715 | Colorectum | MSS | Coronavirus disease - COVID-19 | 108/1875 | 232/8465 | 6.50e-17 | 1.67e-15 | 1.03e-15 | 108 |
| Page: 1 2 3 4 5 6 7 |
Top |
Cell-cell communication analysis |
| Identification of potential cell-cell interactions between two cell types and their ligand-receptor pairs for different disease states |
| Ligand | Receptor | LRpair | Pathway | Tissue | Disease Stage |
| Page: 1 |
Top |
Single-cell gene regulatory network inference analysis |
| Find out the significant the regulons (TFs) and the target genes of each regulon across cell types for different disease states |
| TF | Cell Type | Tissue | Disease Stage | Target Gene | RSS | Regulon Activity |
| ∗The dot plots of a searched regulon are shown for all cell subpopulations in each disease state of each tissue based on the regulon specific score inferred using pySCENIC and by calculating the average expression. |
| Page: 1 |
Top |
Somatic mutation of malignant transformation related genes |
| Annotation of somatic variants for genes involved in malignant transformation |
| Hugo Symbol | Variant Class | Variant Classification | dbSNP RS | HGVSc | HGVSp | HGVSp Short | SWISSPROT | BIOTYPE | SIFT | PolyPhen | Tumor Sample Barcode | Tissue | Histology | Sex | Age | Stage | Therapy Types | Drugs | Outcome |
| RPL30 | insertion | In_Frame_Ins | novel | c.38_39insCTGCTTTTTTGGTTCTTTTAGCTTTGAGGT | p.Ser13_Ile14insCysPhePheGlySerPheSerPheGluVal | p.S13_I14insCFFGSFSFEV | P62888 | protein_coding | TCGA-A8-A07B-01 | Breast | breast invasive carcinoma | Female | >=65 | I/II | Unknown | Unknown | SD | ||
| RPL30 | insertion | Nonsense_Mutation | novel | c.243_244insTAAAGAGTTACACATCCTGGGCCGGGCGTGGTGGCT | p.Leu81_Gly82insTer | p.L81_G82ins* | P62888 | protein_coding | TCGA-A8-A07J-01 | Breast | breast invasive carcinoma | Female | <65 | I/II | Chemotherapy | 5-fluorouracil | CR | ||
| RPL30 | insertion | Nonsense_Mutation | novel | c.110_111insAGAATCACCTAGTTTAGCCCGCTAAATCAGTTCTGAGTCA | p.Met37IlefsTer9 | p.M37Ifs*9 | P62888 | protein_coding | TCGA-A8-A090-01 | Breast | breast invasive carcinoma | Female | >=65 | I/II | Unknown | Unknown | SD | ||
| RPL30 | insertion | Frame_Shift_Ins | novel | c.110_111insTTTGTGTCCTGCTTTTTTGGTTCTTTTAGCTTTGA | p.Met37IlefsTer31 | p.M37Ifs*31 | P62888 | protein_coding | TCGA-BH-A0DP-01 | Breast | breast invasive carcinoma | Female | <65 | I/II | Hormone Therapy | arimidex | SD | ||
| RPL30 | SNV | Missense_Mutation | novel | c.45N>A | p.Asn15Lys | p.N15K | P62888 | protein_coding | deleterious(0.03) | probably_damaging(0.929) | TCGA-CA-6717-01 | Colorectum | colon adenocarcinoma | Male | <65 | I/II | Chemotherapy | oxaliplatin | CR |
| RPL30 | SNV | Missense_Mutation | novel | c.130A>G | p.Lys44Glu | p.K44E | P62888 | protein_coding | deleterious(0.02) | possibly_damaging(0.558) | TCGA-A5-A0G2-01 | Endometrium | uterine corpus endometrioid carcinoma | Female | <65 | III/IV | Unknown | Unknown | SD |
| RPL30 | SNV | Missense_Mutation | novel | c.302N>G | p.Asp101Gly | p.D101G | P62888 | protein_coding | deleterious(0) | probably_damaging(0.973) | TCGA-AX-A1CE-01 | Endometrium | uterine corpus endometrioid carcinoma | Female | <65 | I/II | Unspecific | Paclitaxel | SD |
| RPL30 | SNV | Missense_Mutation | novel | c.17N>C | p.Lys6Thr | p.K6T | P62888 | protein_coding | deleterious(0.01) | benign(0.367) | TCGA-EO-A22R-01 | Endometrium | uterine corpus endometrioid carcinoma | Female | <65 | I/II | Unknown | Unknown | SD |
| RPL30 | SNV | Missense_Mutation | c.10G>C | p.Ala4Pro | p.A4P | P62888 | protein_coding | tolerated(0.08) | benign(0.011) | TCGA-55-A490-01 | Lung | lung adenocarcinoma | Male | >=65 | I/II | Chemotherapy | carboplatin | SD | |
| RPL30 | deletion | Nonsense_Mutation | novel | c.267_268delNN | p.Tyr89Ter | p.Y89* | P62888 | protein_coding | TCGA-44-3396-01 | Lung | lung adenocarcinoma | Female | >=65 | III/IV | Chemotherapy | alimta | SD |
| Page: 1 |
Top |
Related drugs of malignant transformation related genes |
| Identification of chemicals and drugs interact with genes involved in malignant transfromation |
| (DGIdb 4.0) |
| Entrez ID | Symbol | Category | Interaction Types | Drug Claim Name | Drug Name | PMIDs |
| Page: 1 |

Copyright 2023-Present -The University of Texas Health Science Center at Houston |