
|
|||||
|
 | |
| |
| |
| |
| |
| |
|
Gene: RNF139 |
Gene summary for RNF139 |
| Gene information | Species | Human | Gene symbol | RNF139 | Gene ID | 11236 |
| Gene name | ring finger protein 139 | |
| Gene Alias | HRCA1 | |
| Cytomap | 8q24.13 | |
| Gene Type | protein-coding | GO ID | GO:0006412 | UniProtAcc | Q8WU17 |
Top |
Malignant transformation analysis |
| Identification of the aberrant gene expression in precancerous and cancerous lesions by comparing the gene expression of stem-like cells in diseased tissues with normal stem cells |
| Entrez ID | Symbol | Replicates | Species | Organ | Tissue | Adj P-value | Log2FC | Malignancy |
| 11236 | RNF139 | LZE4T | Human | Esophagus | ESCC | 1.10e-05 | 1.26e-01 | 0.0811 |
| 11236 | RNF139 | LZE20T | Human | Esophagus | ESCC | 2.79e-05 | 1.47e-01 | 0.0662 |
| 11236 | RNF139 | LZE24T | Human | Esophagus | ESCC | 3.01e-12 | 2.96e-01 | 0.0596 |
| 11236 | RNF139 | LZE6T | Human | Esophagus | ESCC | 4.49e-02 | 3.35e-02 | 0.0845 |
| 11236 | RNF139 | P1T-E | Human | Esophagus | ESCC | 9.65e-05 | 2.44e-01 | 0.0875 |
| 11236 | RNF139 | P2T-E | Human | Esophagus | ESCC | 7.55e-29 | 4.21e-01 | 0.1177 |
| 11236 | RNF139 | P4T-E | Human | Esophagus | ESCC | 1.50e-17 | 3.58e-01 | 0.1323 |
| 11236 | RNF139 | P5T-E | Human | Esophagus | ESCC | 8.99e-29 | 3.25e-01 | 0.1327 |
| 11236 | RNF139 | P8T-E | Human | Esophagus | ESCC | 4.13e-10 | 9.82e-02 | 0.0889 |
| 11236 | RNF139 | P9T-E | Human | Esophagus | ESCC | 2.60e-13 | 3.03e-01 | 0.1131 |
| 11236 | RNF139 | P10T-E | Human | Esophagus | ESCC | 1.40e-22 | 1.49e-01 | 0.116 |
| 11236 | RNF139 | P11T-E | Human | Esophagus | ESCC | 1.74e-10 | 3.60e-01 | 0.1426 |
| 11236 | RNF139 | P12T-E | Human | Esophagus | ESCC | 3.42e-17 | 3.82e-01 | 0.1122 |
| 11236 | RNF139 | P15T-E | Human | Esophagus | ESCC | 1.83e-27 | 3.58e-01 | 0.1149 |
| 11236 | RNF139 | P16T-E | Human | Esophagus | ESCC | 7.98e-16 | 2.34e-01 | 0.1153 |
| 11236 | RNF139 | P17T-E | Human | Esophagus | ESCC | 2.22e-05 | 9.92e-02 | 0.1278 |
| 11236 | RNF139 | P20T-E | Human | Esophagus | ESCC | 1.12e-11 | 1.25e-01 | 0.1124 |
| 11236 | RNF139 | P21T-E | Human | Esophagus | ESCC | 3.79e-17 | 2.19e-01 | 0.1617 |
| 11236 | RNF139 | P22T-E | Human | Esophagus | ESCC | 3.23e-13 | 8.68e-02 | 0.1236 |
| 11236 | RNF139 | P23T-E | Human | Esophagus | ESCC | 5.14e-14 | 5.13e-01 | 0.108 |
| Page: 1 2 3 4 5 |
| Tissue | Expression Dynamics | Abbreviation |
| Esophagus | 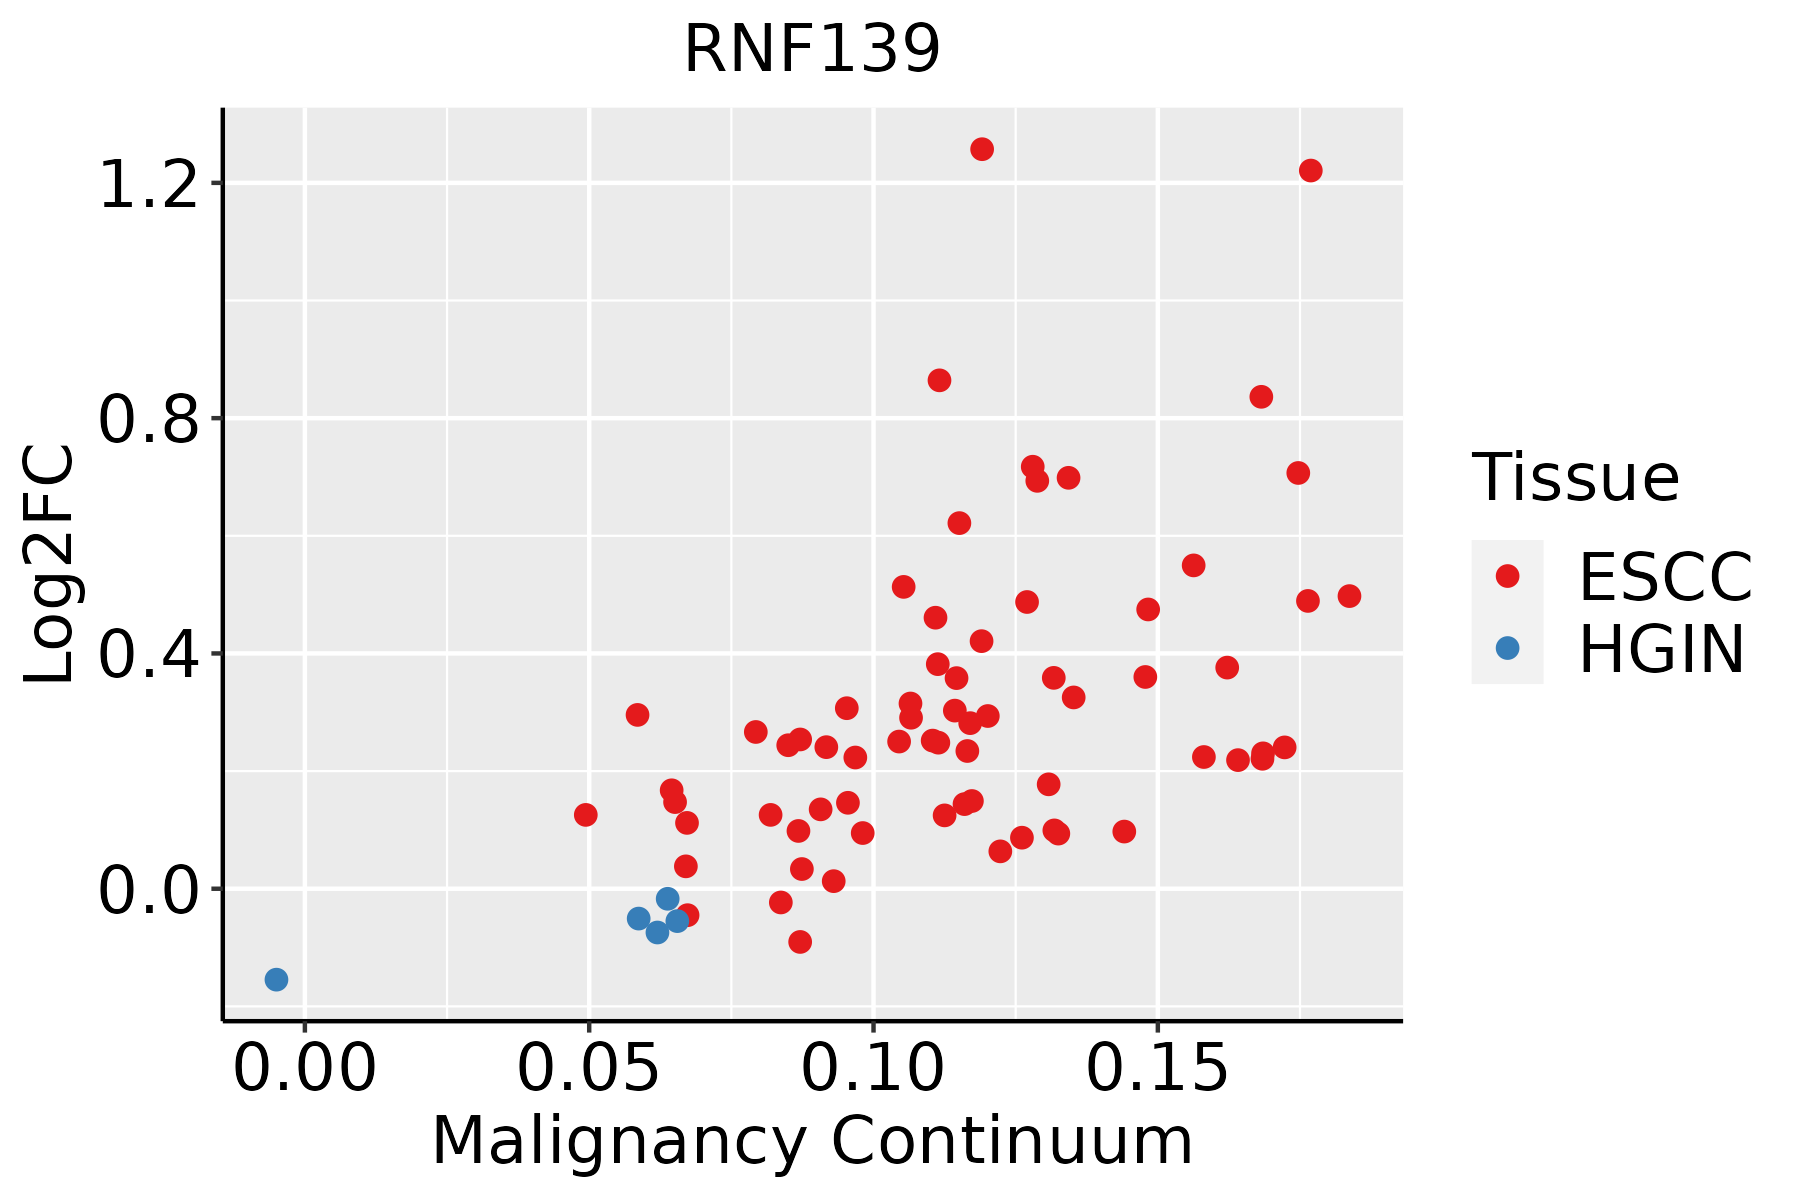 | ESCC: Esophageal squamous cell carcinoma |
| HGIN: High-grade intraepithelial neoplasias | ||
| LGIN: Low-grade intraepithelial neoplasias | ||
| Liver | 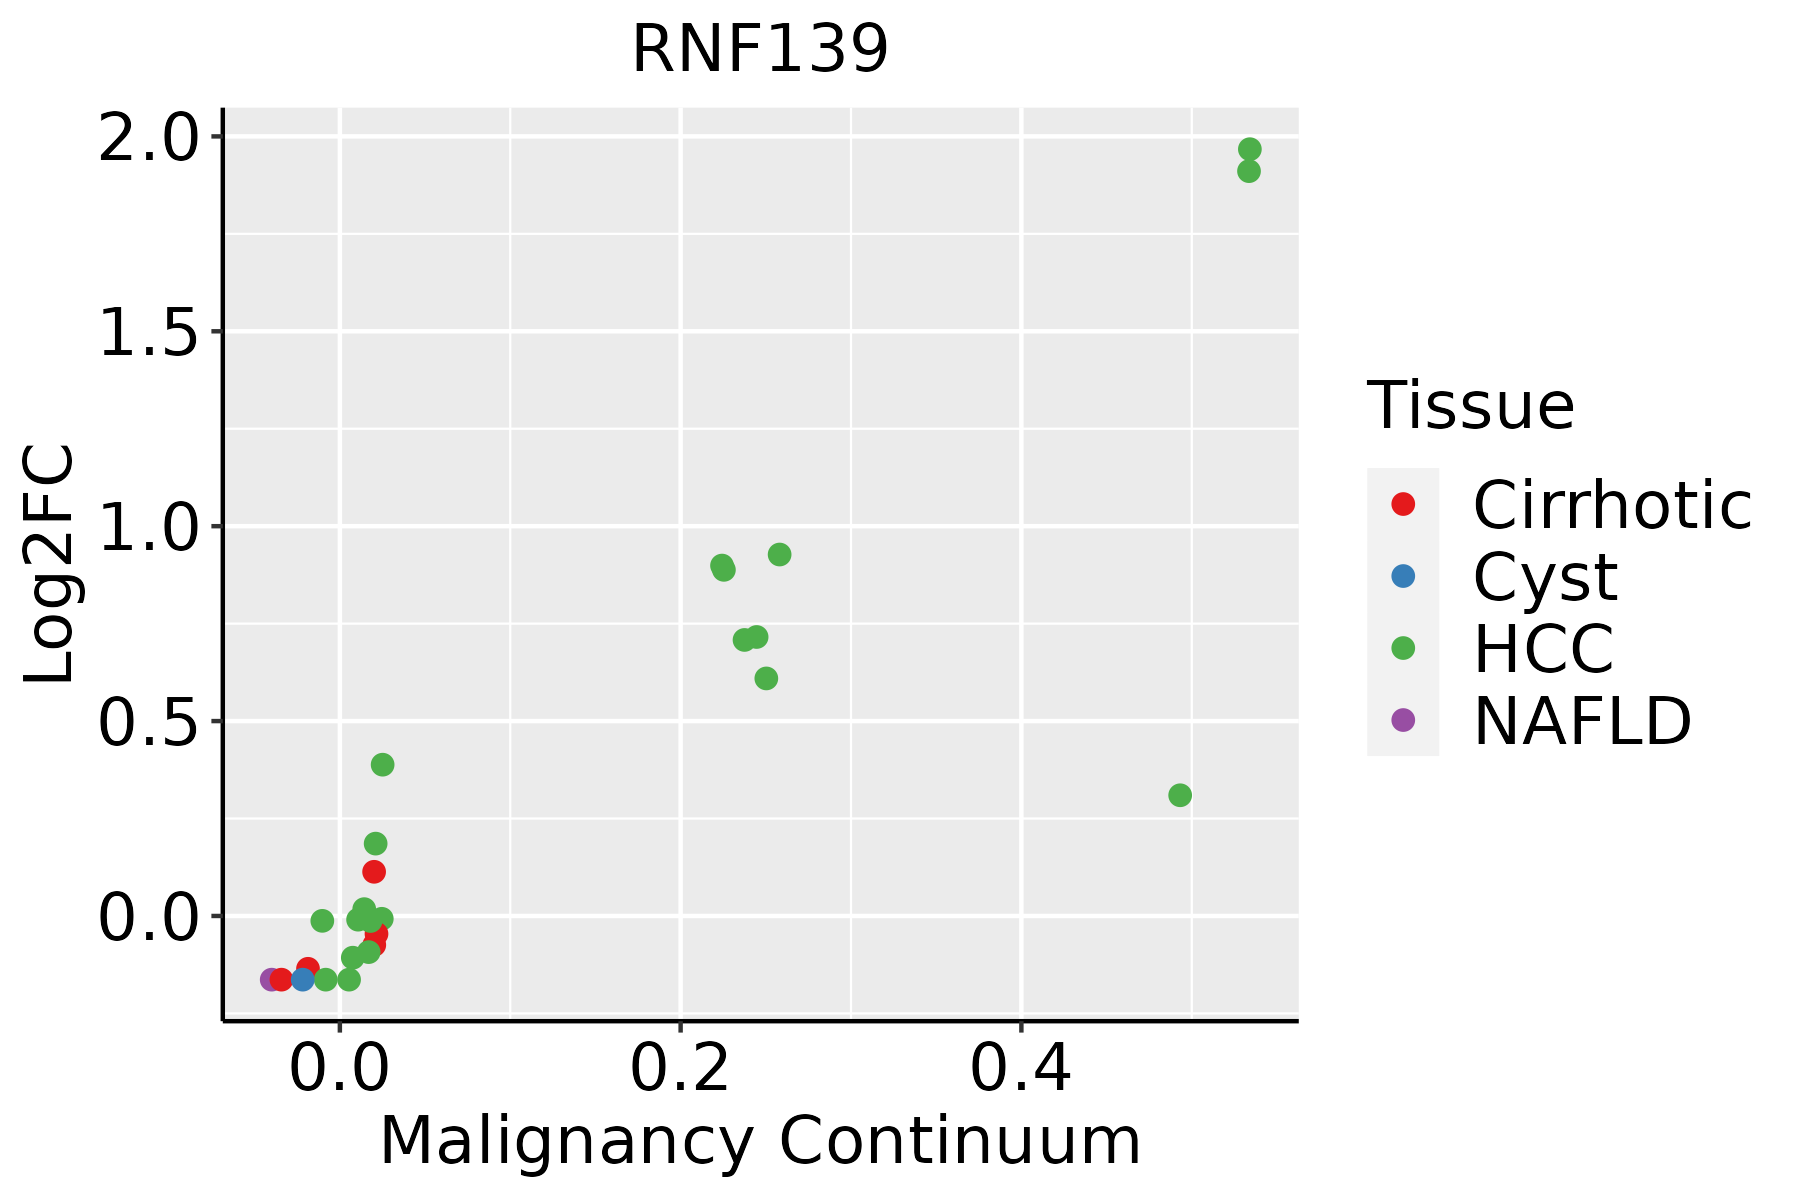 | HCC: Hepatocellular carcinoma |
| NAFLD: Non-alcoholic fatty liver disease | ||
| Oral Cavity | 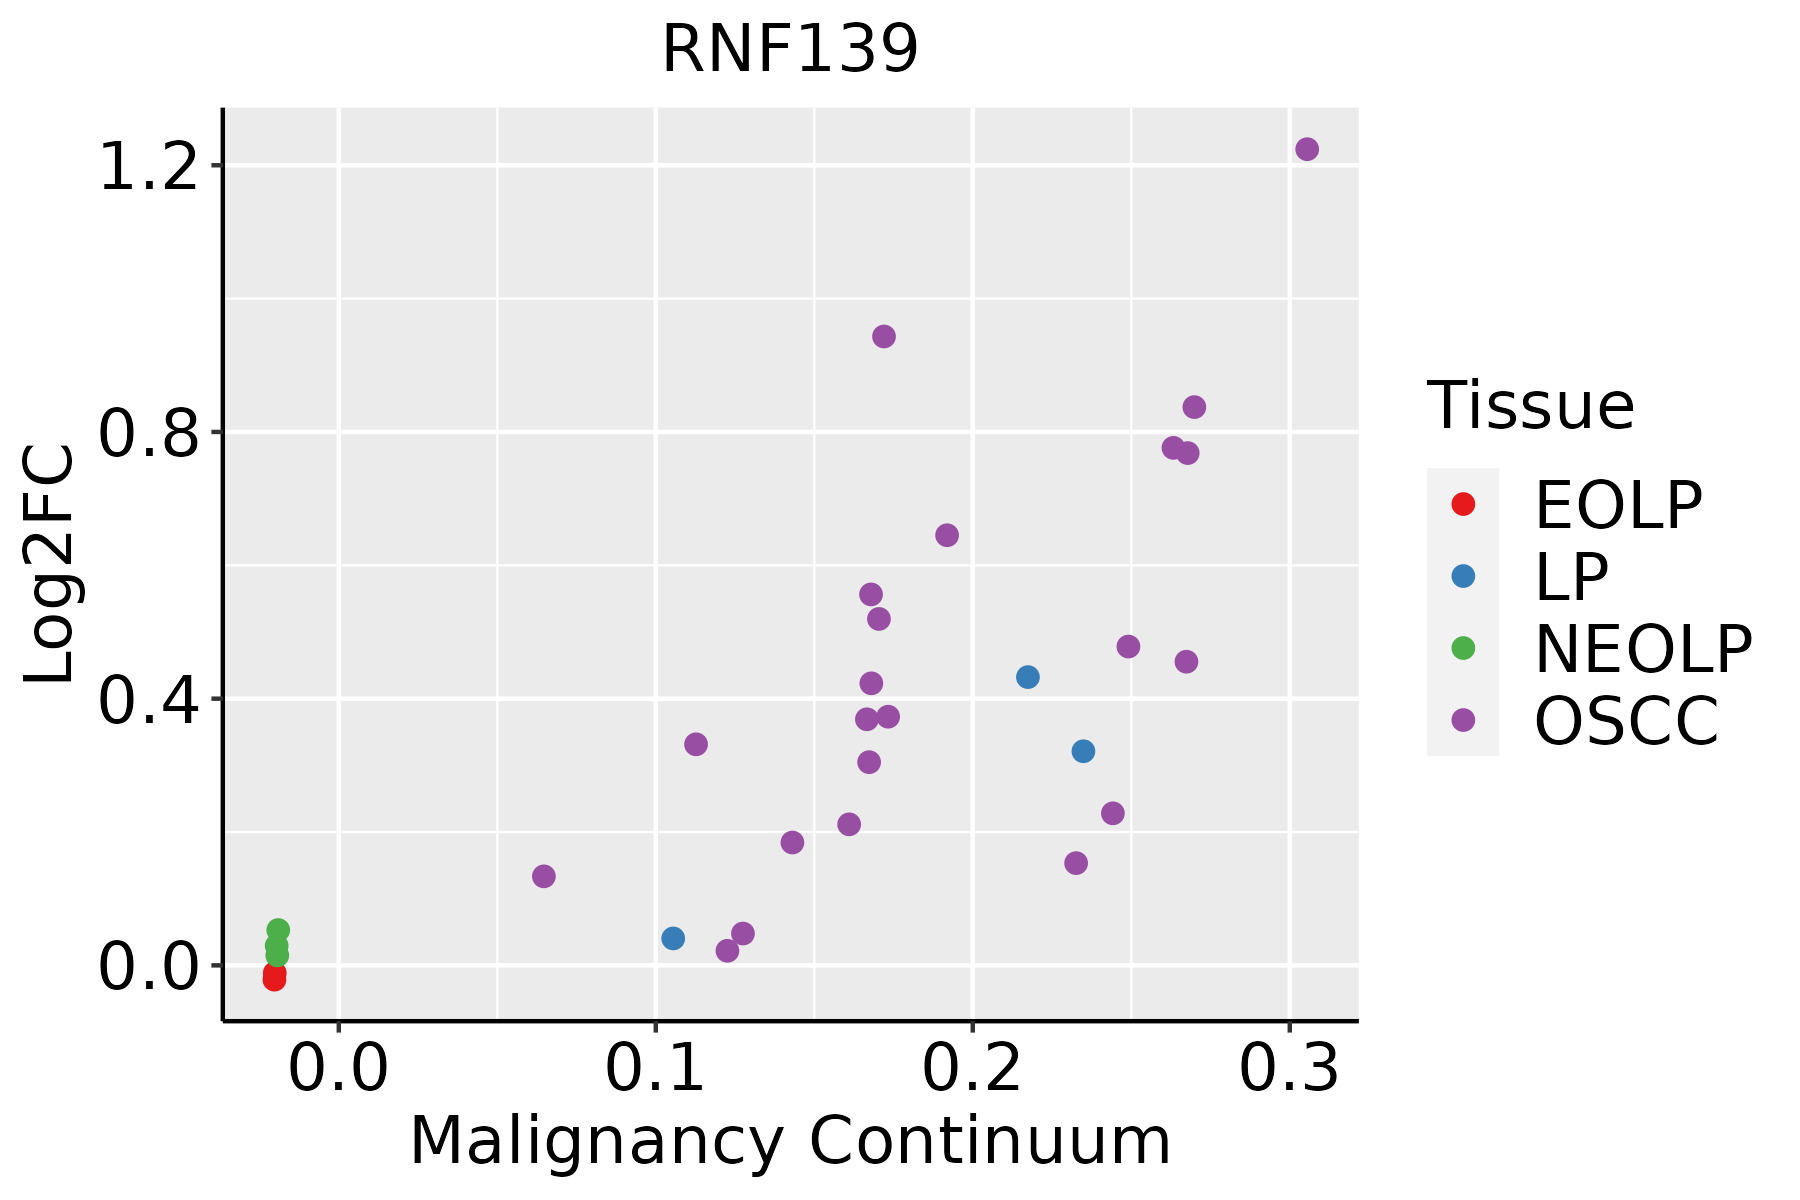 | EOLP: Erosive Oral lichen planus |
| LP: leukoplakia | ||
| NEOLP: Non-erosive oral lichen planus | ||
| OSCC: Oral squamous cell carcinoma |
| ∗log2FC in expression of this searched gene in stem-like cells from each diseased tissue sample relative to stem-like cells in normal samples in each tissue plotted against the malignancy continuum. Samples are colored based on if they are from different disease stage. |
Top |
Malignant transformation related pathway analysis |
| Find out the enriched GO biological processes and KEGG pathways involved in transition from healthy to precancer to cancer |
| Tissue | Disease Stage | Enriched GO biological Processes |
| Colorectum | AD |  |
| Colorectum | SER |  |
| Colorectum | MSS |  |
| Colorectum | MSI-H |  |
| Colorectum | FAP |  |
| ∗Top 15 enriched GO BP terms are showed in the bar plot of each disease state in each tissue. Each row represents a significant GO biological process which is colored according to the -log10(p.adjust). |
| Page: 1 2 3 4 5 6 7 8 9 |
| GO ID | Tissue | Disease Stage | Description | Gene Ratio | Bg Ratio | pvalue | p.adjust | Count |
| GO:00091002 | Esophagus | ESCC | glycoprotein metabolic process | 226/8552 | 387/18723 | 2.64e-07 | 3.94e-06 | 226 |
| GO:001648514 | Esophagus | ESCC | protein processing | 134/8552 | 225/18723 | 1.81e-05 | 1.60e-04 | 134 |
| GO:00316486 | Esophagus | ESCC | protein destabilization | 33/8552 | 46/18723 | 3.06e-04 | 1.83e-03 | 33 |
| GO:00065173 | Esophagus | ESCC | protein deglycosylation | 19/8552 | 26/18723 | 4.31e-03 | 1.71e-02 | 19 |
| GO:00606281 | Esophagus | ESCC | regulation of ER to Golgi vesicle-mediated transport | 12/8552 | 15/18723 | 7.31e-03 | 2.63e-02 | 12 |
| GO:003424914 | Esophagus | ESCC | negative regulation of cellular amide metabolic process | 144/8552 | 273/18723 | 1.08e-02 | 3.67e-02 | 144 |
| GO:004819311 | Liver | Cirrhotic | Golgi vesicle transport | 153/4634 | 296/18723 | 1.02e-23 | 6.43e-21 | 153 |
| GO:001049812 | Liver | Cirrhotic | proteasomal protein catabolic process | 216/4634 | 490/18723 | 2.52e-21 | 9.29e-19 | 216 |
| GO:004217612 | Liver | Cirrhotic | regulation of protein catabolic process | 181/4634 | 391/18723 | 7.94e-21 | 2.77e-18 | 181 |
| GO:000989612 | Liver | Cirrhotic | positive regulation of catabolic process | 215/4634 | 492/18723 | 1.13e-20 | 3.56e-18 | 215 |
| GO:00349767 | Liver | Cirrhotic | response to endoplasmic reticulum stress | 130/4634 | 256/18723 | 1.72e-19 | 3.86e-17 | 130 |
| GO:003133112 | Liver | Cirrhotic | positive regulation of cellular catabolic process | 190/4634 | 427/18723 | 1.94e-19 | 4.18e-17 | 190 |
| GO:003164712 | Liver | Cirrhotic | regulation of protein stability | 144/4634 | 298/18723 | 6.74e-19 | 1.28e-16 | 144 |
| GO:000688811 | Liver | Cirrhotic | endoplasmic reticulum to Golgi vesicle-mediated transport | 77/4634 | 130/18723 | 5.78e-17 | 7.56e-15 | 77 |
| GO:190336212 | Liver | Cirrhotic | regulation of cellular protein catabolic process | 124/4634 | 255/18723 | 9.85e-17 | 1.26e-14 | 124 |
| GO:004586212 | Liver | Cirrhotic | positive regulation of proteolysis | 163/4634 | 372/18723 | 4.18e-16 | 5.14e-14 | 163 |
| GO:000641712 | Liver | Cirrhotic | regulation of translation | 194/4634 | 468/18723 | 7.28e-16 | 8.79e-14 | 194 |
| GO:004573212 | Liver | Cirrhotic | positive regulation of protein catabolic process | 112/4634 | 231/18723 | 3.89e-15 | 4.21e-13 | 112 |
| GO:003238611 | Liver | Cirrhotic | regulation of intracellular transport | 147/4634 | 337/18723 | 1.84e-14 | 1.72e-12 | 147 |
| GO:190336412 | Liver | Cirrhotic | positive regulation of cellular protein catabolic process | 80/4634 | 155/18723 | 5.04e-13 | 3.86e-11 | 80 |
| Page: 1 2 3 4 5 6 |
| Pathway ID | Tissue | Disease Stage | Description | Gene Ratio | Bg Ratio | pvalue | p.adjust | qvalue | Count |
| Page: 1 |
Top |
Cell-cell communication analysis |
| Identification of potential cell-cell interactions between two cell types and their ligand-receptor pairs for different disease states |
| Ligand | Receptor | LRpair | Pathway | Tissue | Disease Stage |
| Page: 1 |
Top |
Single-cell gene regulatory network inference analysis |
| Find out the significant the regulons (TFs) and the target genes of each regulon across cell types for different disease states |
| TF | Cell Type | Tissue | Disease Stage | Target Gene | RSS | Regulon Activity |
| ∗The dot plots of a searched regulon are shown for all cell subpopulations in each disease state of each tissue based on the regulon specific score inferred using pySCENIC and by calculating the average expression. |
| Page: 1 |
Top |
Somatic mutation of malignant transformation related genes |
| Annotation of somatic variants for genes involved in malignant transformation |
| Hugo Symbol | Variant Class | Variant Classification | dbSNP RS | HGVSc | HGVSp | HGVSp Short | SWISSPROT | BIOTYPE | SIFT | PolyPhen | Tumor Sample Barcode | Tissue | Histology | Sex | Age | Stage | Therapy Types | Drugs | Outcome |
| RNF139 | SNV | Missense_Mutation | c.213N>C | p.Leu71Phe | p.L71F | Q8WU17 | protein_coding | deleterious(0.01) | probably_damaging(0.999) | TCGA-AC-A23H-01 | Breast | breast invasive carcinoma | Female | >=65 | I/II | Unknown | Unknown | PD | |
| RNF139 | SNV | Missense_Mutation | rs758345551 | c.450N>G | p.Ile150Met | p.I150M | Q8WU17 | protein_coding | tolerated(0.08) | benign(0.079) | TCGA-AC-A23H-01 | Breast | breast invasive carcinoma | Female | >=65 | I/II | Unknown | Unknown | PD |
| RNF139 | SNV | Missense_Mutation | rs145952657 | c.1774N>A | p.Glu592Lys | p.E592K | Q8WU17 | protein_coding | tolerated(0.3) | benign(0.229) | TCGA-AN-A046-01 | Breast | breast invasive carcinoma | Female | >=65 | I/II | Unknown | Unknown | SD |
| RNF139 | SNV | Missense_Mutation | c.706G>A | p.Asp236Asn | p.D236N | Q8WU17 | protein_coding | tolerated(0.56) | benign(0.048) | TCGA-E2-A14V-01 | Breast | breast invasive carcinoma | Female | <65 | I/II | Chemotherapy | cyclophosphamide | SD | |
| RNF139 | insertion | Nonsense_Mutation | novel | c.336_337insACCCTGAGGCTACAAGCAAAGCAGCTGCTATAGAAGAAGTCTCTGAG | p.Ala113ThrfsTer11 | p.A113Tfs*11 | Q8WU17 | protein_coding | TCGA-A2-A0CX-01 | Breast | breast invasive carcinoma | Female | <65 | I/II | Chemotherapy | adriamycin | SD | ||
| RNF139 | SNV | Missense_Mutation | novel | c.1682N>T | p.Thr561Ile | p.T561I | Q8WU17 | protein_coding | deleterious(0) | probably_damaging(0.998) | TCGA-2W-A8YY-01 | Cervix | cervical & endocervical cancer | Female | <65 | I/II | Chemotherapy | cisplatin | CR |
| RNF139 | SNV | Missense_Mutation | novel | c.1332N>A | p.Phe444Leu | p.F444L | Q8WU17 | protein_coding | deleterious(0.05) | possibly_damaging(0.841) | TCGA-C5-A7X8-01 | Cervix | cervical & endocervical cancer | Female | <65 | I/II | Chemotherapy | cisplatin | SD |
| RNF139 | SNV | Missense_Mutation | c.1374C>G | p.Asp458Glu | p.D458E | Q8WU17 | protein_coding | deleterious(0) | probably_damaging(1) | TCGA-LP-A5U3-01 | Cervix | cervical & endocervical cancer | Female | <65 | I/II | Unknown | Unknown | SD | |
| RNF139 | SNV | Missense_Mutation | c.190N>A | p.Ala64Thr | p.A64T | Q8WU17 | protein_coding | tolerated(0.27) | benign(0.007) | TCGA-A6-3809-01 | Colorectum | colon adenocarcinoma | Female | >=65 | I/II | Unknown | Unknown | SD | |
| RNF139 | SNV | Missense_Mutation | c.1639N>C | p.Cys547Arg | p.C547R | Q8WU17 | protein_coding | deleterious(0) | probably_damaging(1) | TCGA-AA-3663-01 | Colorectum | colon adenocarcinoma | Male | <65 | I/II | Unknown | Unknown | SD |
| Page: 1 2 3 4 5 6 7 8 |
Top |
Related drugs of malignant transformation related genes |
| Identification of chemicals and drugs interact with genes involved in malignant transfromation |
| (DGIdb 4.0) |
| Entrez ID | Symbol | Category | Interaction Types | Drug Claim Name | Drug Name | PMIDs |
| Page: 1 |

Copyright 2023-Present -The University of Texas Health Science Center at Houston |