
|
|||||
|
 | |
| |
| |
| |
| |
| |
|
Gene: RHBDF2 |
Gene summary for RHBDF2 |
| Gene information | Species | Human | Gene symbol | RHBDF2 | Gene ID | 79651 |
| Gene name | rhomboid 5 homolog 2 | |
| Gene Alias | RHBDL5 | |
| Cytomap | 17q25.1 | |
| Gene Type | protein-coding | GO ID | GO:0002376 | UniProtAcc | Q6PJF5 |
Top |
Malignant transformation analysis |
| Identification of the aberrant gene expression in precancerous and cancerous lesions by comparing the gene expression of stem-like cells in diseased tissues with normal stem cells |
| Entrez ID | Symbol | Replicates | Species | Organ | Tissue | Adj P-value | Log2FC | Malignancy |
| 79651 | RHBDF2 | LZE4T | Human | Esophagus | ESCC | 4.59e-03 | 1.41e-01 | 0.0811 |
| 79651 | RHBDF2 | LZE22T | Human | Esophagus | ESCC | 3.01e-07 | 4.34e-01 | 0.068 |
| 79651 | RHBDF2 | LZE24T | Human | Esophagus | ESCC | 4.47e-10 | 2.86e-01 | 0.0596 |
| 79651 | RHBDF2 | P1T-E | Human | Esophagus | ESCC | 1.07e-02 | 2.10e-01 | 0.0875 |
| 79651 | RHBDF2 | P2T-E | Human | Esophagus | ESCC | 2.79e-07 | 1.90e-01 | 0.1177 |
| 79651 | RHBDF2 | P4T-E | Human | Esophagus | ESCC | 6.82e-04 | 1.25e-01 | 0.1323 |
| 79651 | RHBDF2 | P5T-E | Human | Esophagus | ESCC | 8.86e-06 | 8.89e-02 | 0.1327 |
| 79651 | RHBDF2 | P8T-E | Human | Esophagus | ESCC | 5.88e-10 | 2.54e-01 | 0.0889 |
| 79651 | RHBDF2 | P9T-E | Human | Esophagus | ESCC | 1.21e-04 | 1.58e-01 | 0.1131 |
| 79651 | RHBDF2 | P10T-E | Human | Esophagus | ESCC | 2.56e-09 | 1.81e-01 | 0.116 |
| 79651 | RHBDF2 | P11T-E | Human | Esophagus | ESCC | 3.32e-14 | 7.26e-01 | 0.1426 |
| 79651 | RHBDF2 | P12T-E | Human | Esophagus | ESCC | 8.21e-07 | 2.10e-01 | 0.1122 |
| 79651 | RHBDF2 | P15T-E | Human | Esophagus | ESCC | 2.37e-15 | 4.12e-01 | 0.1149 |
| 79651 | RHBDF2 | P16T-E | Human | Esophagus | ESCC | 1.94e-05 | 1.40e-01 | 0.1153 |
| 79651 | RHBDF2 | P20T-E | Human | Esophagus | ESCC | 6.74e-26 | 5.44e-01 | 0.1124 |
| 79651 | RHBDF2 | P21T-E | Human | Esophagus | ESCC | 2.71e-16 | 3.82e-01 | 0.1617 |
| 79651 | RHBDF2 | P22T-E | Human | Esophagus | ESCC | 3.13e-18 | 2.37e-01 | 0.1236 |
| 79651 | RHBDF2 | P23T-E | Human | Esophagus | ESCC | 4.55e-11 | 2.39e-01 | 0.108 |
| 79651 | RHBDF2 | P24T-E | Human | Esophagus | ESCC | 7.86e-09 | 2.89e-01 | 0.1287 |
| 79651 | RHBDF2 | P26T-E | Human | Esophagus | ESCC | 5.17e-05 | 1.84e-01 | 0.1276 |
| Page: 1 2 3 4 |
| Tissue | Expression Dynamics | Abbreviation |
| Esophagus | 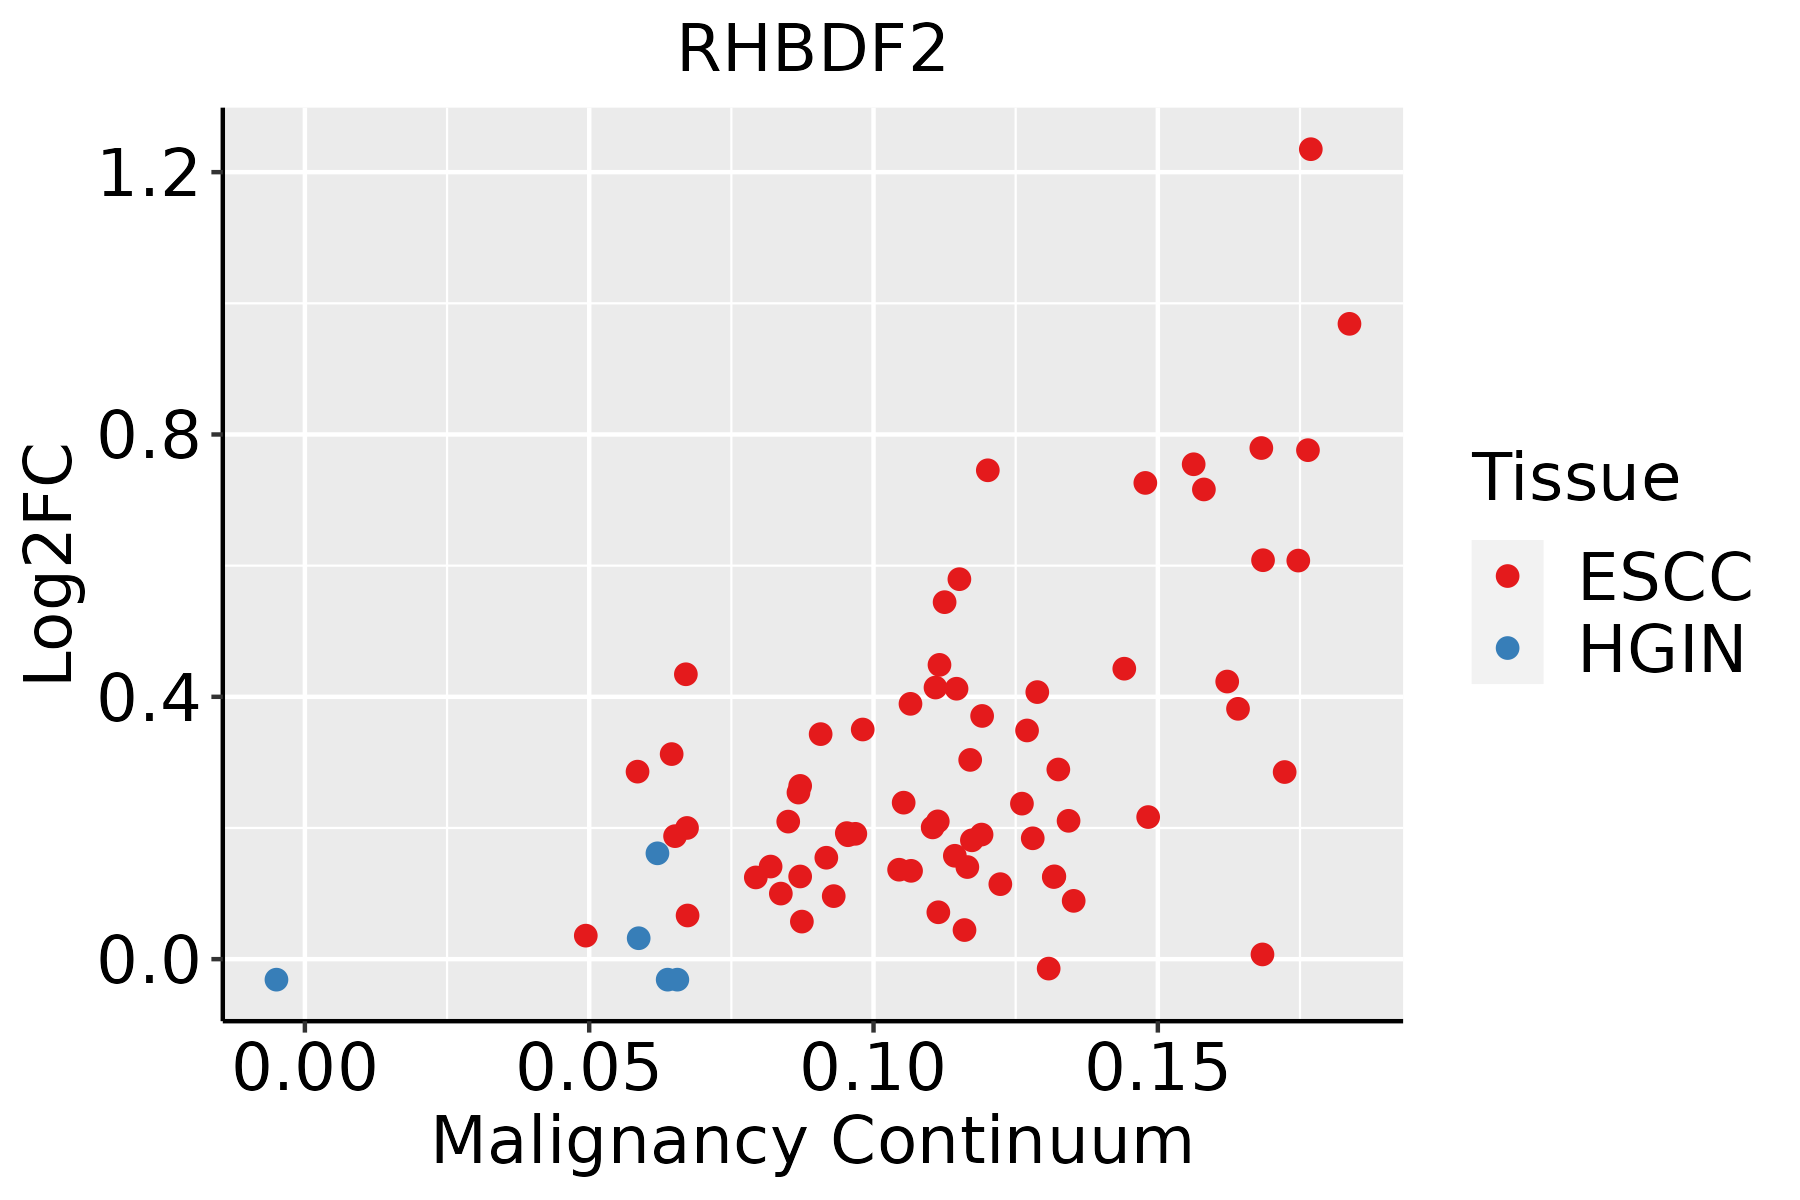 | ESCC: Esophageal squamous cell carcinoma |
| HGIN: High-grade intraepithelial neoplasias | ||
| LGIN: Low-grade intraepithelial neoplasias | ||
| Liver |  | HCC: Hepatocellular carcinoma |
| NAFLD: Non-alcoholic fatty liver disease | ||
| Oral Cavity | 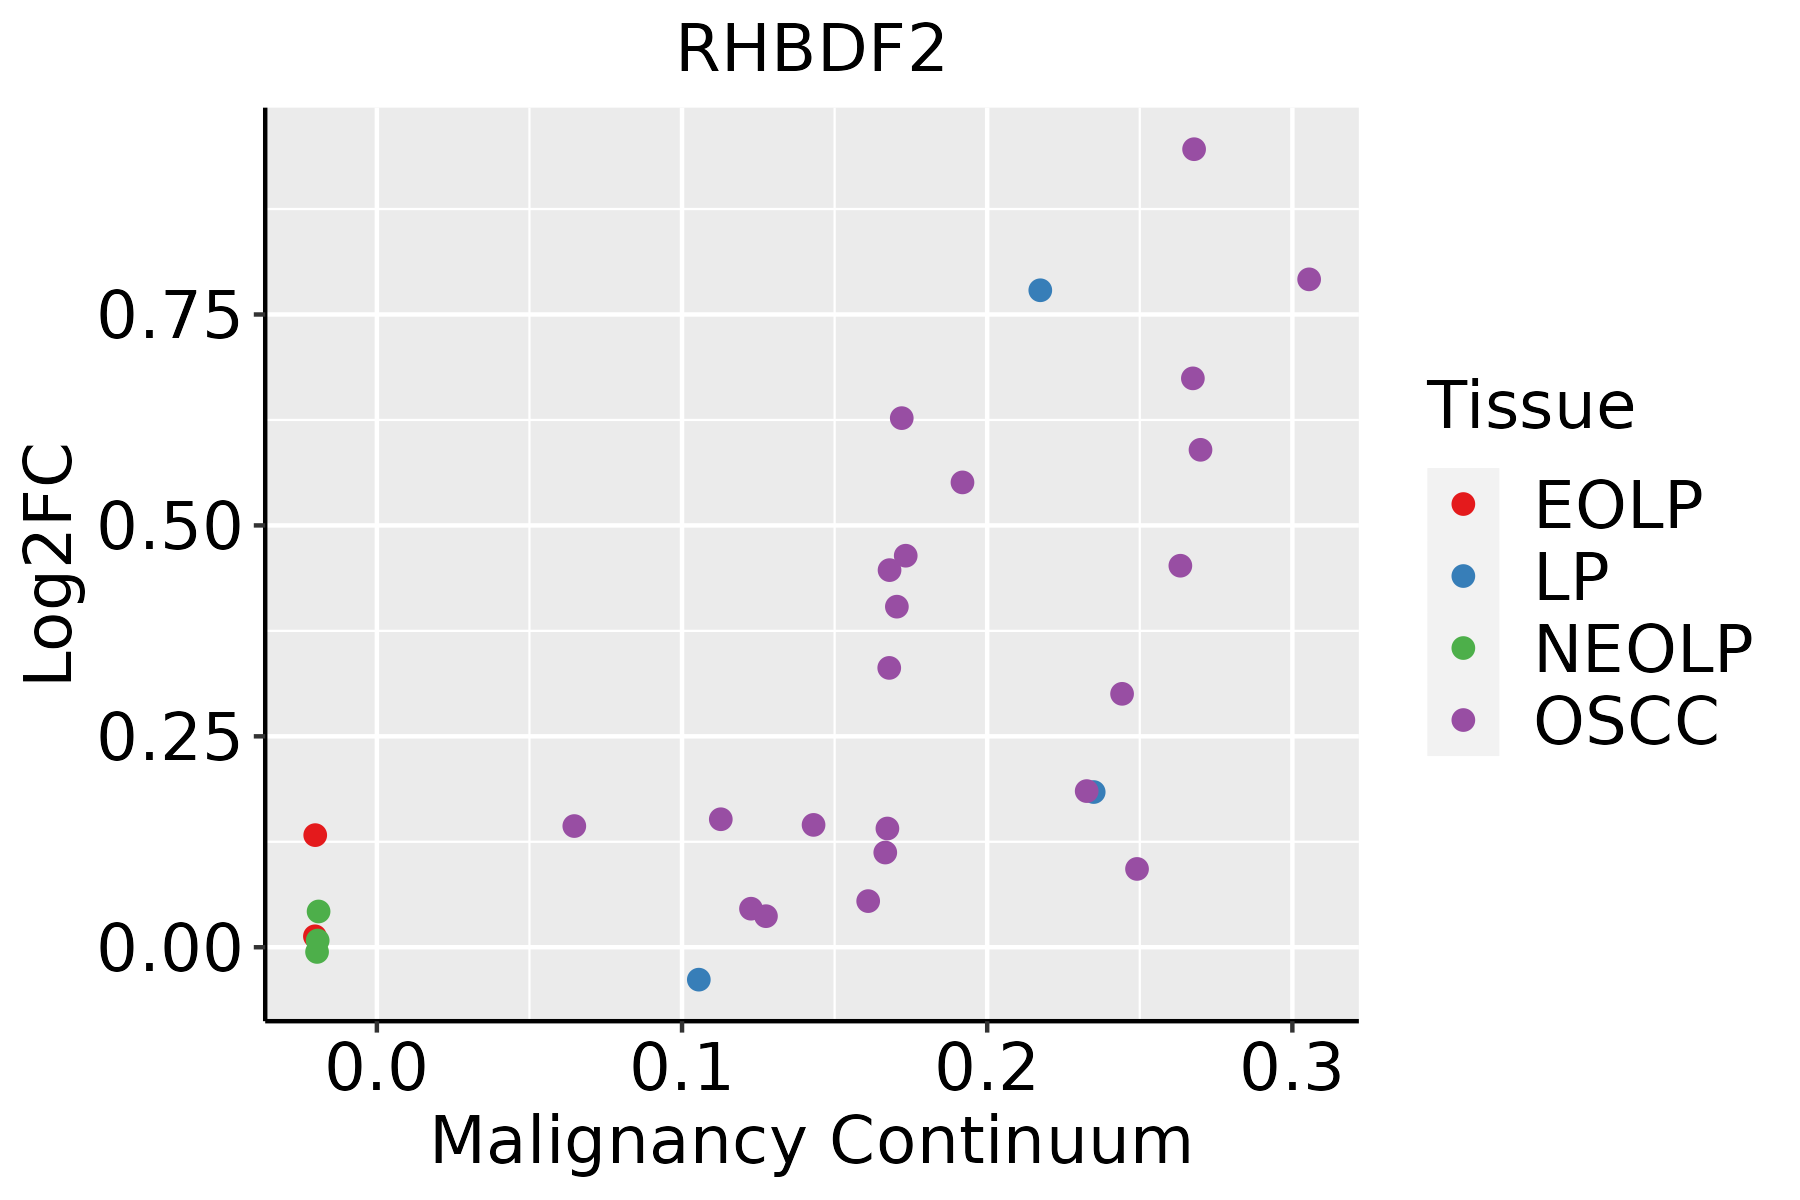 | EOLP: Erosive Oral lichen planus |
| LP: leukoplakia | ||
| NEOLP: Non-erosive oral lichen planus | ||
| OSCC: Oral squamous cell carcinoma |
| ∗log2FC in expression of this searched gene in stem-like cells from each diseased tissue sample relative to stem-like cells in normal samples in each tissue plotted against the malignancy continuum. Samples are colored based on if they are from different disease stage. |
Top |
Malignant transformation related pathway analysis |
| Find out the enriched GO biological processes and KEGG pathways involved in transition from healthy to precancer to cancer |
| Tissue | Disease Stage | Enriched GO biological Processes |
| Colorectum | AD |  |
| Colorectum | SER |  |
| Colorectum | MSS |  |
| Colorectum | MSI-H |  |
| Colorectum | FAP |  |
| ∗Top 15 enriched GO BP terms are showed in the bar plot of each disease state in each tissue. Each row represents a significant GO biological process which is colored according to the -log10(p.adjust). |
| Page: 1 2 3 4 5 6 7 8 9 |
| GO ID | Tissue | Disease Stage | Description | Gene Ratio | Bg Ratio | pvalue | p.adjust | Count |
| GO:19049501 | Liver | HCC | negative regulation of establishment of protein localization | 72/7958 | 131/18723 | 2.65e-03 | 1.27e-02 | 72 |
| GO:00420584 | Liver | HCC | regulation of epidermal growth factor receptor signaling pathway | 43/7958 | 73/18723 | 3.43e-03 | 1.55e-02 | 43 |
| GO:0050777 | Liver | HCC | negative regulation of immune response | 101/7958 | 194/18723 | 4.40e-03 | 1.90e-02 | 101 |
| GO:00512241 | Liver | HCC | negative regulation of protein transport | 69/7958 | 127/18723 | 4.67e-03 | 2.01e-02 | 69 |
| GO:003559212 | Liver | HCC | establishment of protein localization to extracellular region | 176/7958 | 360/18723 | 7.96e-03 | 3.15e-02 | 176 |
| GO:000930612 | Liver | HCC | protein secretion | 175/7958 | 359/18723 | 9.32e-03 | 3.57e-02 | 175 |
| GO:003812715 | Oral cavity | OSCC | ERBB signaling pathway | 76/7305 | 121/18723 | 9.59e-08 | 1.66e-06 | 76 |
| GO:000717315 | Oral cavity | OSCC | epidermal growth factor receptor signaling pathway | 67/7305 | 108/18723 | 1.04e-06 | 1.40e-05 | 67 |
| GO:19011847 | Oral cavity | OSCC | regulation of ERBB signaling pathway | 50/7305 | 79/18723 | 1.06e-05 | 1.12e-04 | 50 |
| GO:00420587 | Oral cavity | OSCC | regulation of epidermal growth factor receptor signaling pathway | 46/7305 | 73/18723 | 2.80e-05 | 2.59e-04 | 46 |
| GO:19049504 | Oral cavity | OSCC | negative regulation of establishment of protein localization | 72/7305 | 131/18723 | 1.51e-04 | 1.06e-03 | 72 |
| GO:00512243 | Oral cavity | OSCC | negative regulation of protein transport | 70/7305 | 127/18723 | 1.65e-04 | 1.14e-03 | 70 |
| GO:000268310 | Oral cavity | OSCC | negative regulation of immune system process | 204/7305 | 434/18723 | 3.72e-04 | 2.27e-03 | 204 |
| GO:000930610 | Oral cavity | OSCC | protein secretion | 169/7305 | 359/18723 | 1.04e-03 | 5.34e-03 | 169 |
| GO:00507774 | Oral cavity | OSCC | negative regulation of immune response | 97/7305 | 194/18723 | 1.16e-03 | 5.91e-03 | 97 |
| GO:003559210 | Oral cavity | OSCC | establishment of protein localization to extracellular region | 169/7305 | 360/18723 | 1.21e-03 | 6.08e-03 | 169 |
| GO:00716929 | Oral cavity | OSCC | protein localization to extracellular region | 172/7305 | 368/18723 | 1.40e-03 | 6.79e-03 | 172 |
| GO:00507089 | Oral cavity | OSCC | regulation of protein secretion | 126/7305 | 268/18723 | 4.41e-03 | 1.79e-02 | 126 |
| GO:190495012 | Oral cavity | LP | negative regulation of establishment of protein localization | 47/4623 | 131/18723 | 2.73e-03 | 1.92e-02 | 47 |
| GO:005077711 | Oral cavity | LP | negative regulation of immune response | 65/4623 | 194/18723 | 3.47e-03 | 2.32e-02 | 65 |
| Page: 1 2 3 4 |
| Pathway ID | Tissue | Disease Stage | Description | Gene Ratio | Bg Ratio | pvalue | p.adjust | qvalue | Count |
| Page: 1 |
Top |
Cell-cell communication analysis |
| Identification of potential cell-cell interactions between two cell types and their ligand-receptor pairs for different disease states |
| Ligand | Receptor | LRpair | Pathway | Tissue | Disease Stage |
| Page: 1 |
Top |
Single-cell gene regulatory network inference analysis |
| Find out the significant the regulons (TFs) and the target genes of each regulon across cell types for different disease states |
| TF | Cell Type | Tissue | Disease Stage | Target Gene | RSS | Regulon Activity |
| ∗The dot plots of a searched regulon are shown for all cell subpopulations in each disease state of each tissue based on the regulon specific score inferred using pySCENIC and by calculating the average expression. |
| Page: 1 |
Top |
Somatic mutation of malignant transformation related genes |
| Annotation of somatic variants for genes involved in malignant transformation |
| Hugo Symbol | Variant Class | Variant Classification | dbSNP RS | HGVSc | HGVSp | HGVSp Short | SWISSPROT | BIOTYPE | SIFT | PolyPhen | Tumor Sample Barcode | Tissue | Histology | Sex | Age | Stage | Therapy Types | Drugs | Outcome |
| RHBDF2 | SNV | Missense_Mutation | c.1600A>G | p.Met534Val | p.M534V | Q6PJF5 | protein_coding | tolerated(0.24) | benign(0) | TCGA-A2-A25E-01 | Breast | breast invasive carcinoma | Female | <65 | III/IV | Chemotherapy | cytoxan | PD | |
| RHBDF2 | SNV | Missense_Mutation | rs776242666 | c.1202N>A | p.Arg401Gln | p.R401Q | Q6PJF5 | protein_coding | deleterious(0) | probably_damaging(1) | TCGA-AO-A128-01 | Breast | breast invasive carcinoma | Female | <65 | I/II | Chemotherapy | doxorubicin | SD |
| RHBDF2 | SNV | Missense_Mutation | c.689N>A | p.Ser230Tyr | p.S230Y | Q6PJF5 | protein_coding | deleterious(0.01) | possibly_damaging(0.835) | TCGA-AR-A251-01 | Breast | breast invasive carcinoma | Female | <65 | III/IV | Chemotherapy | doxorubicin | SD | |
| RHBDF2 | SNV | Missense_Mutation | c.922N>C | p.Glu308Gln | p.E308Q | Q6PJF5 | protein_coding | deleterious(0.01) | probably_damaging(0.982) | TCGA-D8-A1JA-01 | Breast | breast invasive carcinoma | Female | <65 | III/IV | Chemotherapy | adriamycin | PD | |
| RHBDF2 | SNV | Missense_Mutation | rs775956509 | c.1090N>T | p.Arg364Trp | p.R364W | Q6PJF5 | protein_coding | deleterious(0) | probably_damaging(0.929) | TCGA-E2-A1LG-01 | Breast | breast invasive carcinoma | Female | <65 | I/II | Chemotherapy | doxorubicin | SD |
| RHBDF2 | SNV | Missense_Mutation | c.1506N>C | p.Gln502His | p.Q502H | Q6PJF5 | protein_coding | deleterious(0.04) | benign(0.023) | TCGA-GM-A2DO-01 | Breast | breast invasive carcinoma | Female | <65 | I/II | Hormone Therapy | tamoxiphen | CR | |
| RHBDF2 | insertion | Frame_Shift_Ins | novel | c.1419_1420insCAGTG | p.Ser474GlnfsTer207 | p.S474Qfs*207 | Q6PJF5 | protein_coding | TCGA-A8-A09C-01 | Breast | breast invasive carcinoma | Female | >=65 | I/II | Unknown | Unknown | SD | ||
| RHBDF2 | SNV | Missense_Mutation | novel | c.1585G>T | p.Asp529Tyr | p.D529Y | Q6PJF5 | protein_coding | tolerated(0.05) | benign(0.019) | TCGA-FU-A23L-01 | Cervix | cervical & endocervical cancer | Female | <65 | I/II | Chemotherapy | cisplatin | CR |
| RHBDF2 | SNV | Missense_Mutation | rs771107433 | c.1537C>T | p.Arg513Trp | p.R513W | Q6PJF5 | protein_coding | deleterious(0) | possibly_damaging(0.753) | TCGA-MA-AA42-01 | Cervix | cervical & endocervical cancer | Female | >=65 | I/II | Unknown | Unknown | SD |
| RHBDF2 | SNV | Missense_Mutation | novel | c.148N>A | p.Glu50Lys | p.E50K | Q6PJF5 | protein_coding | tolerated_low_confidence(0.51) | benign(0) | TCGA-VS-A958-01 | Cervix | cervical & endocervical cancer | Female | <65 | I/II | Chemotherapy | cisplatin | CR |
| Page: 1 2 3 4 5 6 7 8 |
Top |
Related drugs of malignant transformation related genes |
| Identification of chemicals and drugs interact with genes involved in malignant transfromation |
| (DGIdb 4.0) |
| Entrez ID | Symbol | Category | Interaction Types | Drug Claim Name | Drug Name | PMIDs |
| 79651 | RHBDF2 | ENZYME | opioids | 21622719 | ||
| 79651 | RHBDF2 | ENZYME | fentanyl | FENTANYL | 21622719 | |
| 79651 | RHBDF2 | ENZYME | morphine | MORPHINE | 21622719 | |
| 79651 | RHBDF2 | ENZYME | oxycodone | OXYCODONE | 21622719 |
| Page: 1 |

Copyright 2023-Present -The University of Texas Health Science Center at Houston |