
|
|||||
|
 | |
| |
| |
| |
| |
| |
|
Gene: RBMXL1 |
Gene summary for RBMXL1 |
| Gene information | Species | Human | Gene symbol | RBMXL1 | Gene ID | 494115 |
| Gene name | RBMX like 1 | |
| Gene Alias | RBM1 | |
| Cytomap | 1p22.2 | |
| Gene Type | protein-coding | GO ID | GO:0000245 | UniProtAcc | Q96E39 |
Top |
Malignant transformation analysis |
| Identification of the aberrant gene expression in precancerous and cancerous lesions by comparing the gene expression of stem-like cells in diseased tissues with normal stem cells |
| Entrez ID | Symbol | Replicates | Species | Organ | Tissue | Adj P-value | Log2FC | Malignancy |
| 494115 | RBMXL1 | LZE4T | Human | Esophagus | ESCC | 1.27e-09 | 1.88e-01 | 0.0811 |
| 494115 | RBMXL1 | LZE7T | Human | Esophagus | ESCC | 4.16e-02 | 2.27e-01 | 0.0667 |
| 494115 | RBMXL1 | LZE8T | Human | Esophagus | ESCC | 1.65e-08 | 2.02e-01 | 0.067 |
| 494115 | RBMXL1 | LZE22T | Human | Esophagus | ESCC | 1.52e-02 | 1.49e-01 | 0.068 |
| 494115 | RBMXL1 | LZE24T | Human | Esophagus | ESCC | 3.04e-12 | 2.56e-01 | 0.0596 |
| 494115 | RBMXL1 | LZE6T | Human | Esophagus | ESCC | 2.56e-04 | 1.46e-01 | 0.0845 |
| 494115 | RBMXL1 | P1T-E | Human | Esophagus | ESCC | 3.79e-04 | 2.04e-01 | 0.0875 |
| 494115 | RBMXL1 | P2T-E | Human | Esophagus | ESCC | 7.15e-33 | 5.41e-01 | 0.1177 |
| 494115 | RBMXL1 | P4T-E | Human | Esophagus | ESCC | 6.84e-13 | 2.96e-01 | 0.1323 |
| 494115 | RBMXL1 | P5T-E | Human | Esophagus | ESCC | 2.02e-12 | 1.24e-01 | 0.1327 |
| 494115 | RBMXL1 | P8T-E | Human | Esophagus | ESCC | 2.59e-16 | 2.47e-01 | 0.0889 |
| 494115 | RBMXL1 | P9T-E | Human | Esophagus | ESCC | 1.23e-13 | 2.04e-01 | 0.1131 |
| 494115 | RBMXL1 | P10T-E | Human | Esophagus | ESCC | 3.79e-12 | 2.15e-01 | 0.116 |
| 494115 | RBMXL1 | P11T-E | Human | Esophagus | ESCC | 4.53e-07 | 2.07e-01 | 0.1426 |
| 494115 | RBMXL1 | P12T-E | Human | Esophagus | ESCC | 6.16e-67 | 1.22e+00 | 0.1122 |
| 494115 | RBMXL1 | P15T-E | Human | Esophagus | ESCC | 2.24e-14 | 2.26e-01 | 0.1149 |
| 494115 | RBMXL1 | P16T-E | Human | Esophagus | ESCC | 2.26e-16 | 1.91e-01 | 0.1153 |
| 494115 | RBMXL1 | P17T-E | Human | Esophagus | ESCC | 1.22e-02 | 1.49e-01 | 0.1278 |
| 494115 | RBMXL1 | P19T-E | Human | Esophagus | ESCC | 1.04e-03 | 3.02e-01 | 0.1662 |
| 494115 | RBMXL1 | P20T-E | Human | Esophagus | ESCC | 1.95e-12 | 3.22e-01 | 0.1124 |
| Page: 1 2 3 4 |
| Tissue | Expression Dynamics | Abbreviation |
| Esophagus | 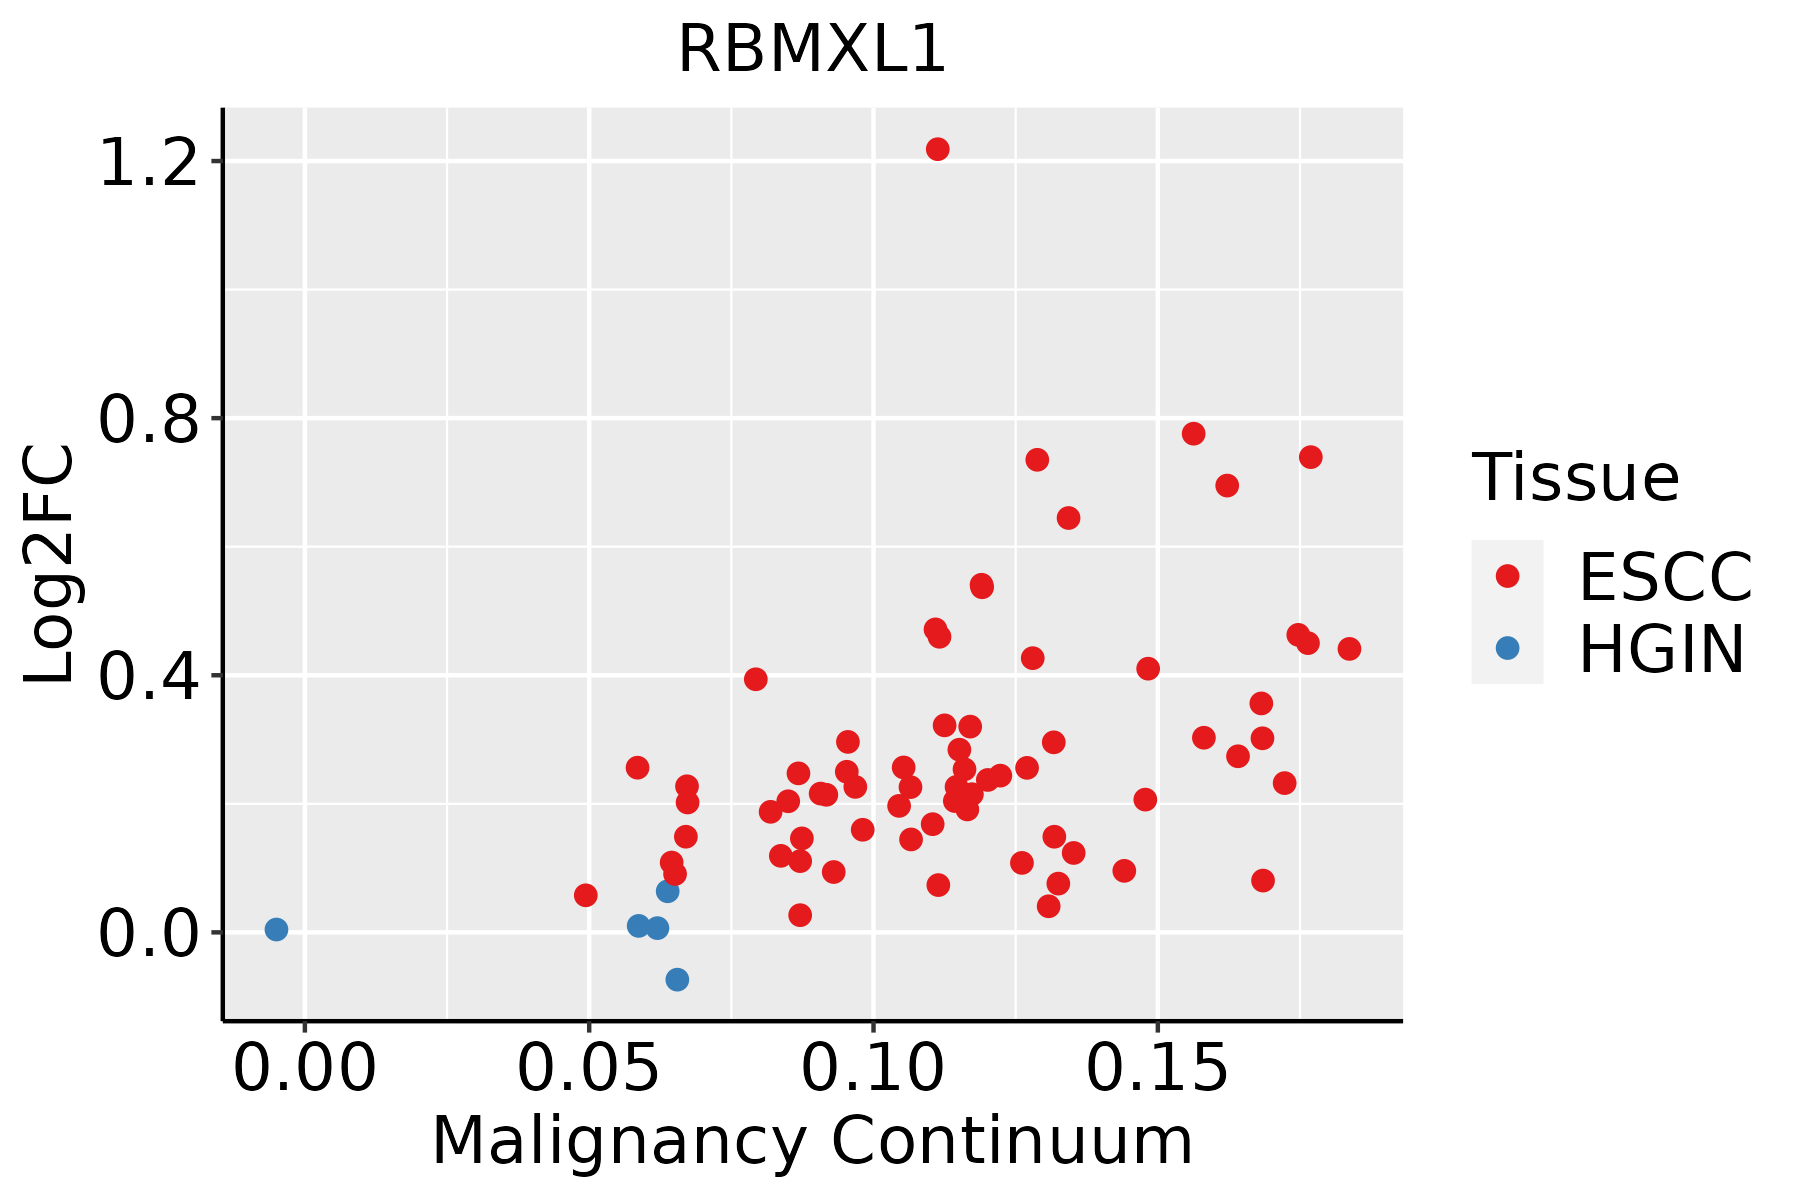 | ESCC: Esophageal squamous cell carcinoma |
| HGIN: High-grade intraepithelial neoplasias | ||
| LGIN: Low-grade intraepithelial neoplasias | ||
| Oral Cavity | 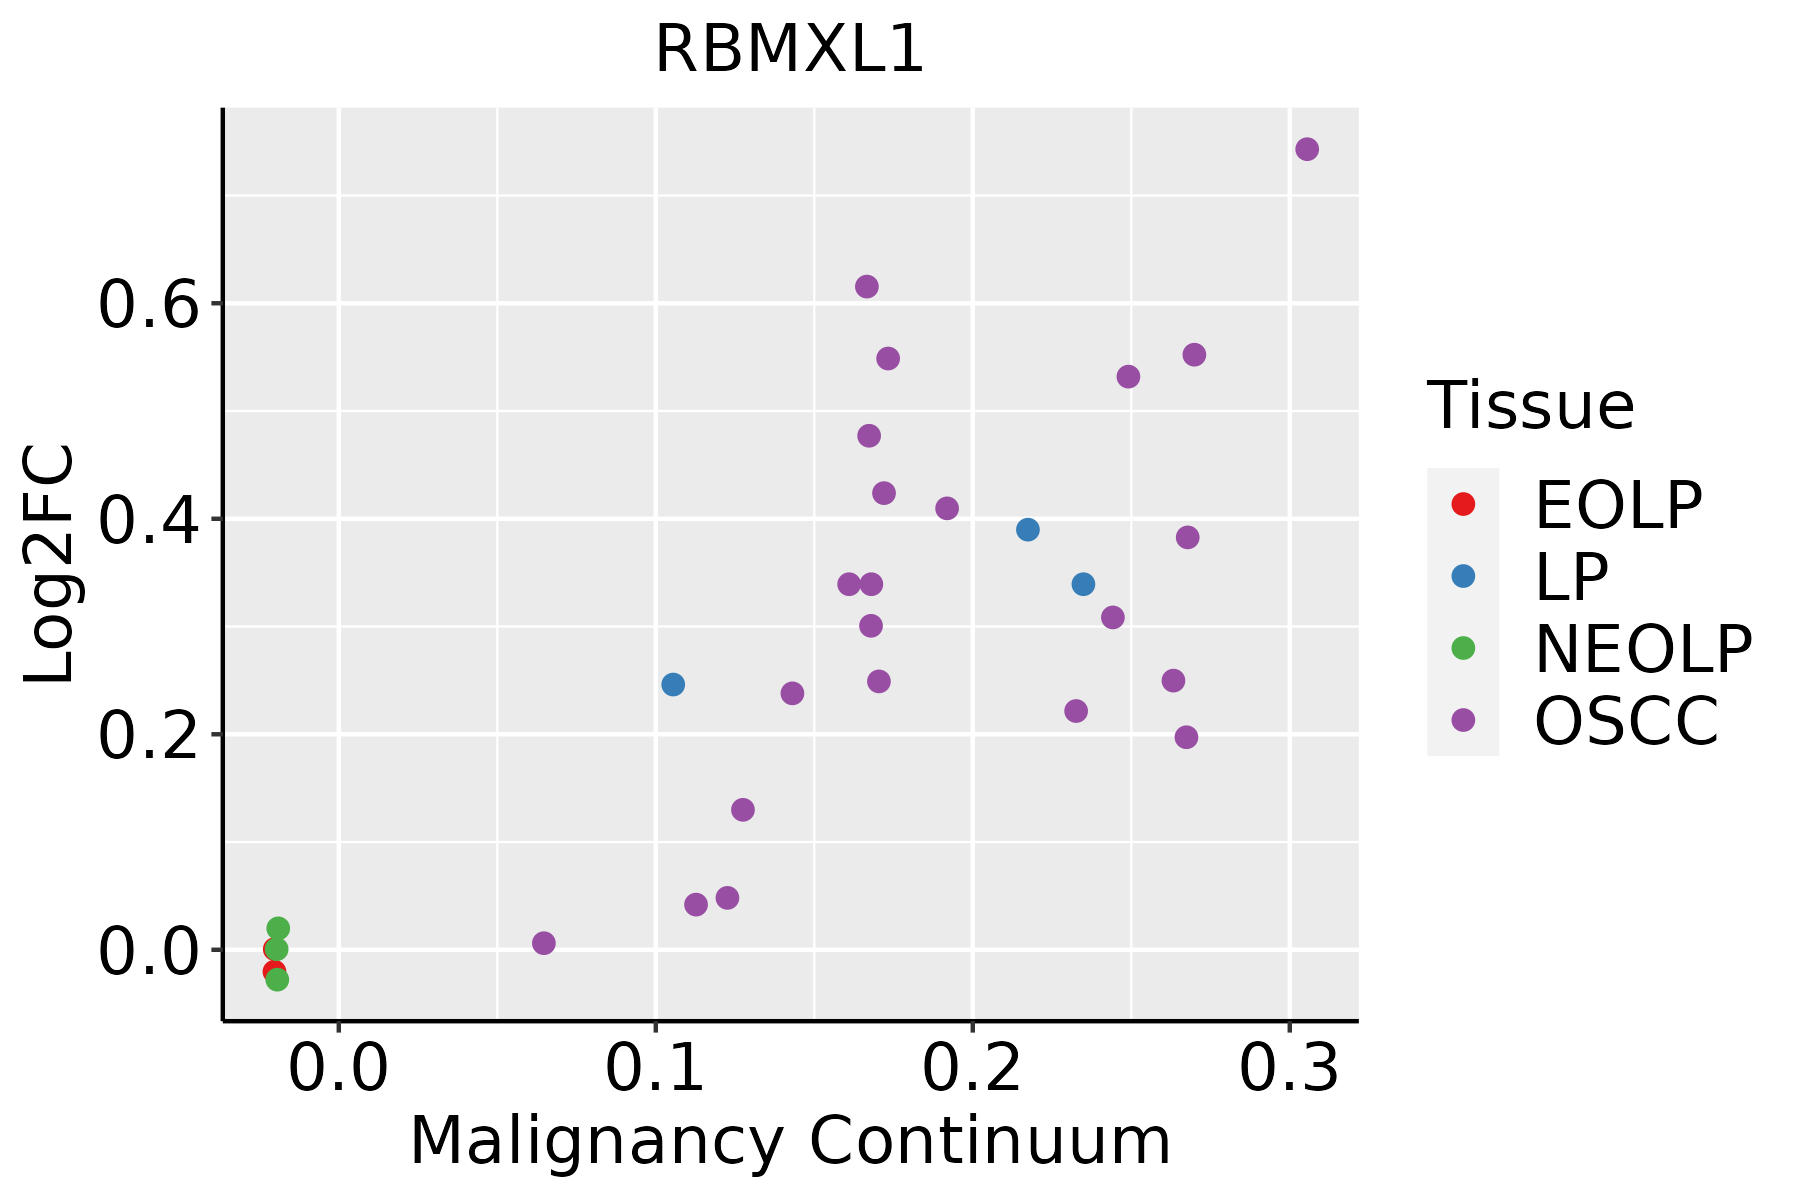 | EOLP: Erosive Oral lichen planus |
| LP: leukoplakia | ||
| NEOLP: Non-erosive oral lichen planus | ||
| OSCC: Oral squamous cell carcinoma | ||
| Skin | 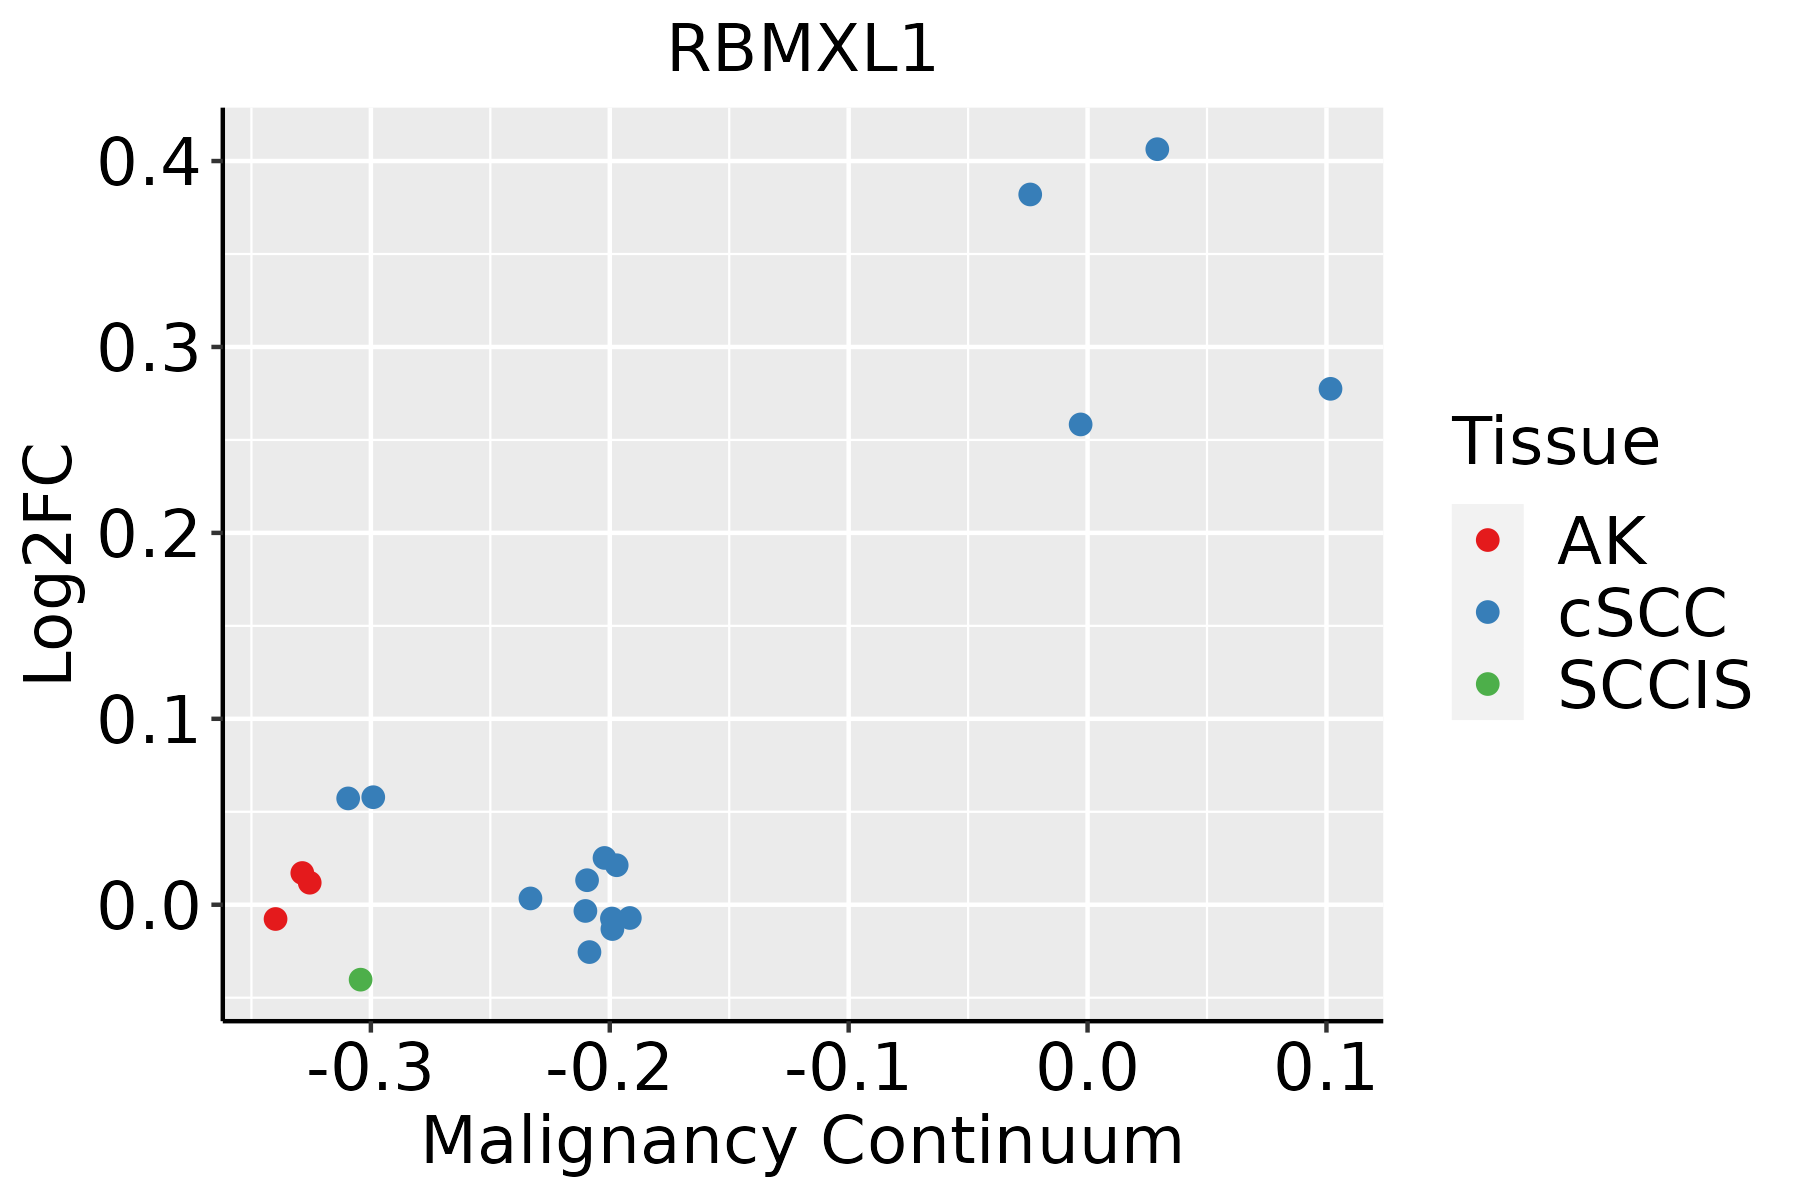 | AK: Actinic keratosis |
| cSCC: Cutaneous squamous cell carcinoma | ||
| SCCIS:squamous cell carcinoma in situ |
| ∗log2FC in expression of this searched gene in stem-like cells from each diseased tissue sample relative to stem-like cells in normal samples in each tissue plotted against the malignancy continuum. Samples are colored based on if they are from different disease stage. |
Top |
Malignant transformation related pathway analysis |
| Find out the enriched GO biological processes and KEGG pathways involved in transition from healthy to precancer to cancer |
| Tissue | Disease Stage | Enriched GO biological Processes |
| Colorectum | AD |  |
| Colorectum | SER |  |
| Colorectum | MSS |  |
| Colorectum | MSI-H |  |
| Colorectum | FAP |  |
| ∗Top 15 enriched GO BP terms are showed in the bar plot of each disease state in each tissue. Each row represents a significant GO biological process which is colored according to the -log10(p.adjust). |
| Page: 1 2 3 4 5 6 7 8 9 |
| GO ID | Tissue | Disease Stage | Description | Gene Ratio | Bg Ratio | pvalue | p.adjust | Count |
| GO:000039819 | Oral cavity | OSCC | mRNA splicing, via spliceosome | 221/7305 | 320/18723 | 5.50e-28 | 2.18e-25 | 221 |
| GO:190331118 | Oral cavity | OSCC | regulation of mRNA metabolic process | 197/7305 | 288/18723 | 2.83e-24 | 7.16e-22 | 197 |
| GO:005068417 | Oral cavity | OSCC | regulation of mRNA processing | 104/7305 | 137/18723 | 1.32e-18 | 1.58e-16 | 104 |
| GO:007182620 | Oral cavity | OSCC | ribonucleoprotein complex subunit organization | 152/7305 | 227/18723 | 1.05e-17 | 1.01e-15 | 152 |
| GO:004348420 | Oral cavity | OSCC | regulation of RNA splicing | 108/7305 | 148/18723 | 4.25e-17 | 3.69e-15 | 108 |
| GO:002261820 | Oral cavity | OSCC | ribonucleoprotein complex assembly | 146/7305 | 220/18723 | 1.53e-16 | 1.23e-14 | 146 |
| GO:004802420 | Oral cavity | OSCC | regulation of mRNA splicing, via spliceosome | 74/7305 | 101/18723 | 2.66e-12 | 1.09e-10 | 74 |
| GO:19033139 | Oral cavity | OSCC | positive regulation of mRNA metabolic process | 82/7305 | 118/18723 | 1.77e-11 | 6.13e-10 | 82 |
| GO:003312018 | Oral cavity | OSCC | positive regulation of RNA splicing | 29/7305 | 37/18723 | 1.21e-06 | 1.61e-05 | 29 |
| GO:00506854 | Oral cavity | OSCC | positive regulation of mRNA processing | 25/7305 | 32/18723 | 7.52e-06 | 8.14e-05 | 25 |
| GO:00480269 | Oral cavity | OSCC | positive regulation of mRNA splicing, via spliceosome | 17/7305 | 22/18723 | 2.99e-04 | 1.87e-03 | 17 |
| GO:00002456 | Oral cavity | OSCC | spliceosomal complex assembly | 45/7305 | 79/18723 | 9.13e-04 | 4.81e-03 | 45 |
| GO:002261329 | Skin | cSCC | ribonucleoprotein complex biogenesis | 302/4864 | 463/18723 | 5.13e-72 | 3.22e-68 | 302 |
| GO:0008380112 | Skin | cSCC | RNA splicing | 263/4864 | 434/18723 | 2.45e-53 | 5.13e-50 | 263 |
| GO:0000375112 | Skin | cSCC | RNA splicing, via transesterification reactions | 201/4864 | 324/18723 | 4.07e-43 | 5.10e-40 | 201 |
| GO:0000377112 | Skin | cSCC | RNA splicing, via transesterification reactions with bulged adenosine as nucleophile | 197/4864 | 320/18723 | 1.45e-41 | 1.14e-38 | 197 |
| GO:0000398112 | Skin | cSCC | mRNA splicing, via spliceosome | 197/4864 | 320/18723 | 1.45e-41 | 1.14e-38 | 197 |
| GO:007182629 | Skin | cSCC | ribonucleoprotein complex subunit organization | 140/4864 | 227/18723 | 5.54e-30 | 3.16e-27 | 140 |
| GO:002261829 | Skin | cSCC | ribonucleoprotein complex assembly | 136/4864 | 220/18723 | 2.60e-29 | 1.25e-26 | 136 |
| GO:190331126 | Skin | cSCC | regulation of mRNA metabolic process | 162/4864 | 288/18723 | 5.90e-28 | 2.46e-25 | 162 |
| Page: 1 2 3 |
| Pathway ID | Tissue | Disease Stage | Description | Gene Ratio | Bg Ratio | pvalue | p.adjust | qvalue | Count |
| Page: 1 |
Top |
Cell-cell communication analysis |
| Identification of potential cell-cell interactions between two cell types and their ligand-receptor pairs for different disease states |
| Ligand | Receptor | LRpair | Pathway | Tissue | Disease Stage |
| Page: 1 |
Top |
Single-cell gene regulatory network inference analysis |
| Find out the significant the regulons (TFs) and the target genes of each regulon across cell types for different disease states |
| TF | Cell Type | Tissue | Disease Stage | Target Gene | RSS | Regulon Activity |
| ∗The dot plots of a searched regulon are shown for all cell subpopulations in each disease state of each tissue based on the regulon specific score inferred using pySCENIC and by calculating the average expression. |
| Page: 1 |
Top |
Somatic mutation of malignant transformation related genes |
| Annotation of somatic variants for genes involved in malignant transformation |
| Hugo Symbol | Variant Class | Variant Classification | dbSNP RS | HGVSc | HGVSp | HGVSp Short | SWISSPROT | BIOTYPE | SIFT | PolyPhen | Tumor Sample Barcode | Tissue | Histology | Sex | Age | Stage | Therapy Types | Drugs | Outcome |
| RBMXL1 | SNV | Missense_Mutation | c.479C>G | p.Pro160Arg | p.P160R | Q96E39 | protein_coding | deleterious(0) | probably_damaging(0.913) | TCGA-3C-AALK-01 | Breast | breast invasive carcinoma | Female | <65 | I/II | Chemotherapy | docetaxel | SD | |
| RBMXL1 | SNV | Missense_Mutation | novel | c.417N>G | p.Asn139Lys | p.N139K | Q96E39 | protein_coding | tolerated(0.43) | benign(0.01) | TCGA-S3-AA10-01 | Breast | breast invasive carcinoma | Female | >=65 | I/II | Chemotherapy | cytoxan | CR |
| RBMXL1 | SNV | Missense_Mutation | rs199719717 | c.925C>T | p.Arg309Cys | p.R309C | Q96E39 | protein_coding | tolerated(0.12) | possibly_damaging(0.68) | TCGA-2W-A8YY-01 | Cervix | cervical & endocervical cancer | Female | <65 | I/II | Chemotherapy | cisplatin | CR |
| RBMXL1 | SNV | Missense_Mutation | novel | c.1133N>A | p.Gly378Glu | p.G378E | Q96E39 | protein_coding | tolerated(0.27) | possibly_damaging(0.861) | TCGA-IR-A3LA-01 | Cervix | cervical & endocervical cancer | Female | <65 | I/II | Chemotherapy | cisplatin | CR |
| RBMXL1 | SNV | Missense_Mutation | novel | c.668N>C | p.Arg223Thr | p.R223T | Q96E39 | protein_coding | deleterious(0) | benign(0.33) | TCGA-JW-A5VL-01 | Cervix | cervical & endocervical cancer | Female | <65 | I/II | Unknown | Unknown | SD |
| RBMXL1 | SNV | Missense_Mutation | novel | c.77C>T | p.Thr26Ile | p.T26I | Q96E39 | protein_coding | deleterious(0) | benign(0.026) | TCGA-VS-A953-01 | Cervix | cervical & endocervical cancer | Female | <65 | I/II | Unknown | Unknown | PD |
| RBMXL1 | SNV | Missense_Mutation | rs748002776 | c.716N>A | p.Arg239Gln | p.R239Q | Q96E39 | protein_coding | deleterious(0.02) | possibly_damaging(0.73) | TCGA-ZJ-AAXT-01 | Cervix | cervical & endocervical cancer | Female | <65 | III/IV | Unknown | Unknown | SD |
| RBMXL1 | SNV | Missense_Mutation | rs549912567 | c.992N>A | p.Arg331Gln | p.R331Q | Q96E39 | protein_coding | tolerated(0.16) | benign(0.313) | TCGA-AA-A010-01 | Colorectum | colon adenocarcinoma | Female | <65 | I/II | Chemotherapy | folinic | CR |
| RBMXL1 | SNV | Missense_Mutation | rs374309282 | c.754N>T | p.Arg252Cys | p.R252C | Q96E39 | protein_coding | deleterious(0) | probably_damaging(0.912) | TCGA-AY-6197-01 | Colorectum | colon adenocarcinoma | Male | <65 | I/II | Unknown | Unknown | SD |
| RBMXL1 | SNV | Missense_Mutation | rs549912567 | c.992G>A | p.Arg331Gln | p.R331Q | Q96E39 | protein_coding | tolerated(0.16) | benign(0.313) | TCGA-AG-A002-01 | Colorectum | rectum adenocarcinoma | Male | <65 | I/II | Unknown | Unknown | SD |
| Page: 1 2 3 4 5 |
Top |
Related drugs of malignant transformation related genes |
| Identification of chemicals and drugs interact with genes involved in malignant transfromation |
| (DGIdb 4.0) |
| Entrez ID | Symbol | Category | Interaction Types | Drug Claim Name | Drug Name | PMIDs |
| Page: 1 |

Copyright 2023-Present -The University of Texas Health Science Center at Houston |