
|
|||||
|
 | |
| |
| |
| |
| |
| |
|
Gene: RALA |
Gene summary for RALA |
| Gene information | Species | Human | Gene symbol | RALA | Gene ID | 5898 |
| Gene name | RAS like proto-oncogene A | |
| Gene Alias | HINCONS | |
| Cytomap | 7p14.1 | |
| Gene Type | protein-coding | GO ID | GO:0000266 | UniProtAcc | P11233 |
Top |
Malignant transformation analysis |
| Identification of the aberrant gene expression in precancerous and cancerous lesions by comparing the gene expression of stem-like cells in diseased tissues with normal stem cells |
| Entrez ID | Symbol | Replicates | Species | Organ | Tissue | Adj P-value | Log2FC | Malignancy |
| 5898 | RALA | LZE4T | Human | Esophagus | ESCC | 9.21e-23 | 8.13e-01 | 0.0811 |
| 5898 | RALA | LZE7T | Human | Esophagus | ESCC | 1.06e-11 | 9.83e-01 | 0.0667 |
| 5898 | RALA | LZE8T | Human | Esophagus | ESCC | 5.27e-04 | 1.85e-01 | 0.067 |
| 5898 | RALA | LZE20T | Human | Esophagus | ESCC | 2.46e-08 | 3.77e-01 | 0.0662 |
| 5898 | RALA | LZE22D1 | Human | Esophagus | HGIN | 1.46e-05 | 2.55e-01 | 0.0595 |
| 5898 | RALA | LZE22T | Human | Esophagus | ESCC | 1.06e-04 | 8.83e-01 | 0.068 |
| 5898 | RALA | LZE24T | Human | Esophagus | ESCC | 7.31e-19 | 7.83e-01 | 0.0596 |
| 5898 | RALA | LZE22D3 | Human | Esophagus | HGIN | 3.25e-03 | 4.68e-01 | 0.0653 |
| 5898 | RALA | LZE21T | Human | Esophagus | ESCC | 4.60e-05 | 6.21e-01 | 0.0655 |
| 5898 | RALA | LZE6T | Human | Esophagus | ESCC | 4.39e-08 | 7.33e-01 | 0.0845 |
| 5898 | RALA | P1T-E | Human | Esophagus | ESCC | 8.47e-19 | 1.36e+00 | 0.0875 |
| 5898 | RALA | P2T-E | Human | Esophagus | ESCC | 1.28e-44 | 9.53e-01 | 0.1177 |
| 5898 | RALA | P4T-E | Human | Esophagus | ESCC | 3.56e-56 | 1.40e+00 | 0.1323 |
| 5898 | RALA | P5T-E | Human | Esophagus | ESCC | 7.72e-22 | 6.32e-01 | 0.1327 |
| 5898 | RALA | P8T-E | Human | Esophagus | ESCC | 4.15e-37 | 8.42e-01 | 0.0889 |
| 5898 | RALA | P9T-E | Human | Esophagus | ESCC | 1.89e-38 | 1.10e+00 | 0.1131 |
| 5898 | RALA | P10T-E | Human | Esophagus | ESCC | 2.23e-46 | 1.01e+00 | 0.116 |
| 5898 | RALA | P11T-E | Human | Esophagus | ESCC | 9.09e-25 | 1.22e+00 | 0.1426 |
| 5898 | RALA | P12T-E | Human | Esophagus | ESCC | 4.27e-59 | 1.21e+00 | 0.1122 |
| 5898 | RALA | P15T-E | Human | Esophagus | ESCC | 6.05e-55 | 1.23e+00 | 0.1149 |
| Page: 1 2 3 4 5 6 7 |
| Tissue | Expression Dynamics | Abbreviation |
| Esophagus | 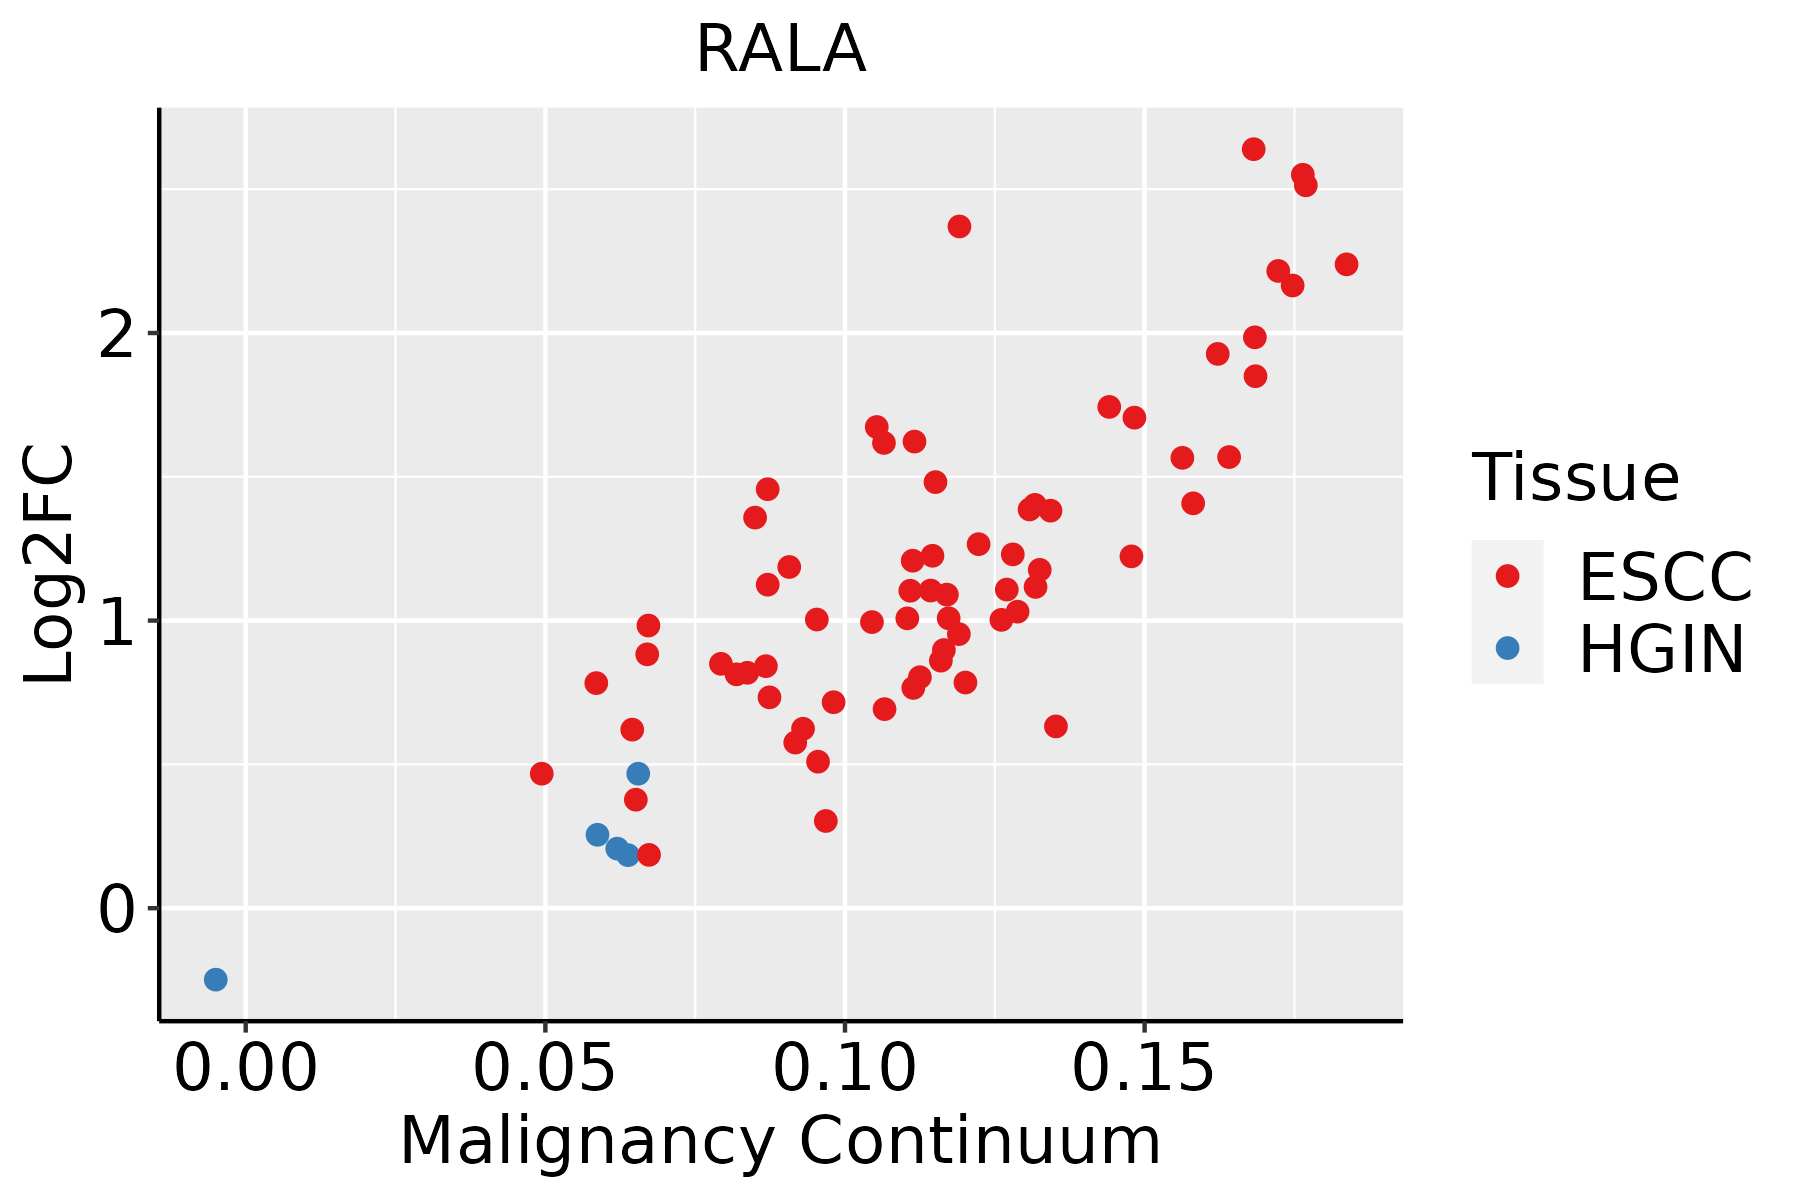 | ESCC: Esophageal squamous cell carcinoma |
| HGIN: High-grade intraepithelial neoplasias | ||
| LGIN: Low-grade intraepithelial neoplasias | ||
| Liver | 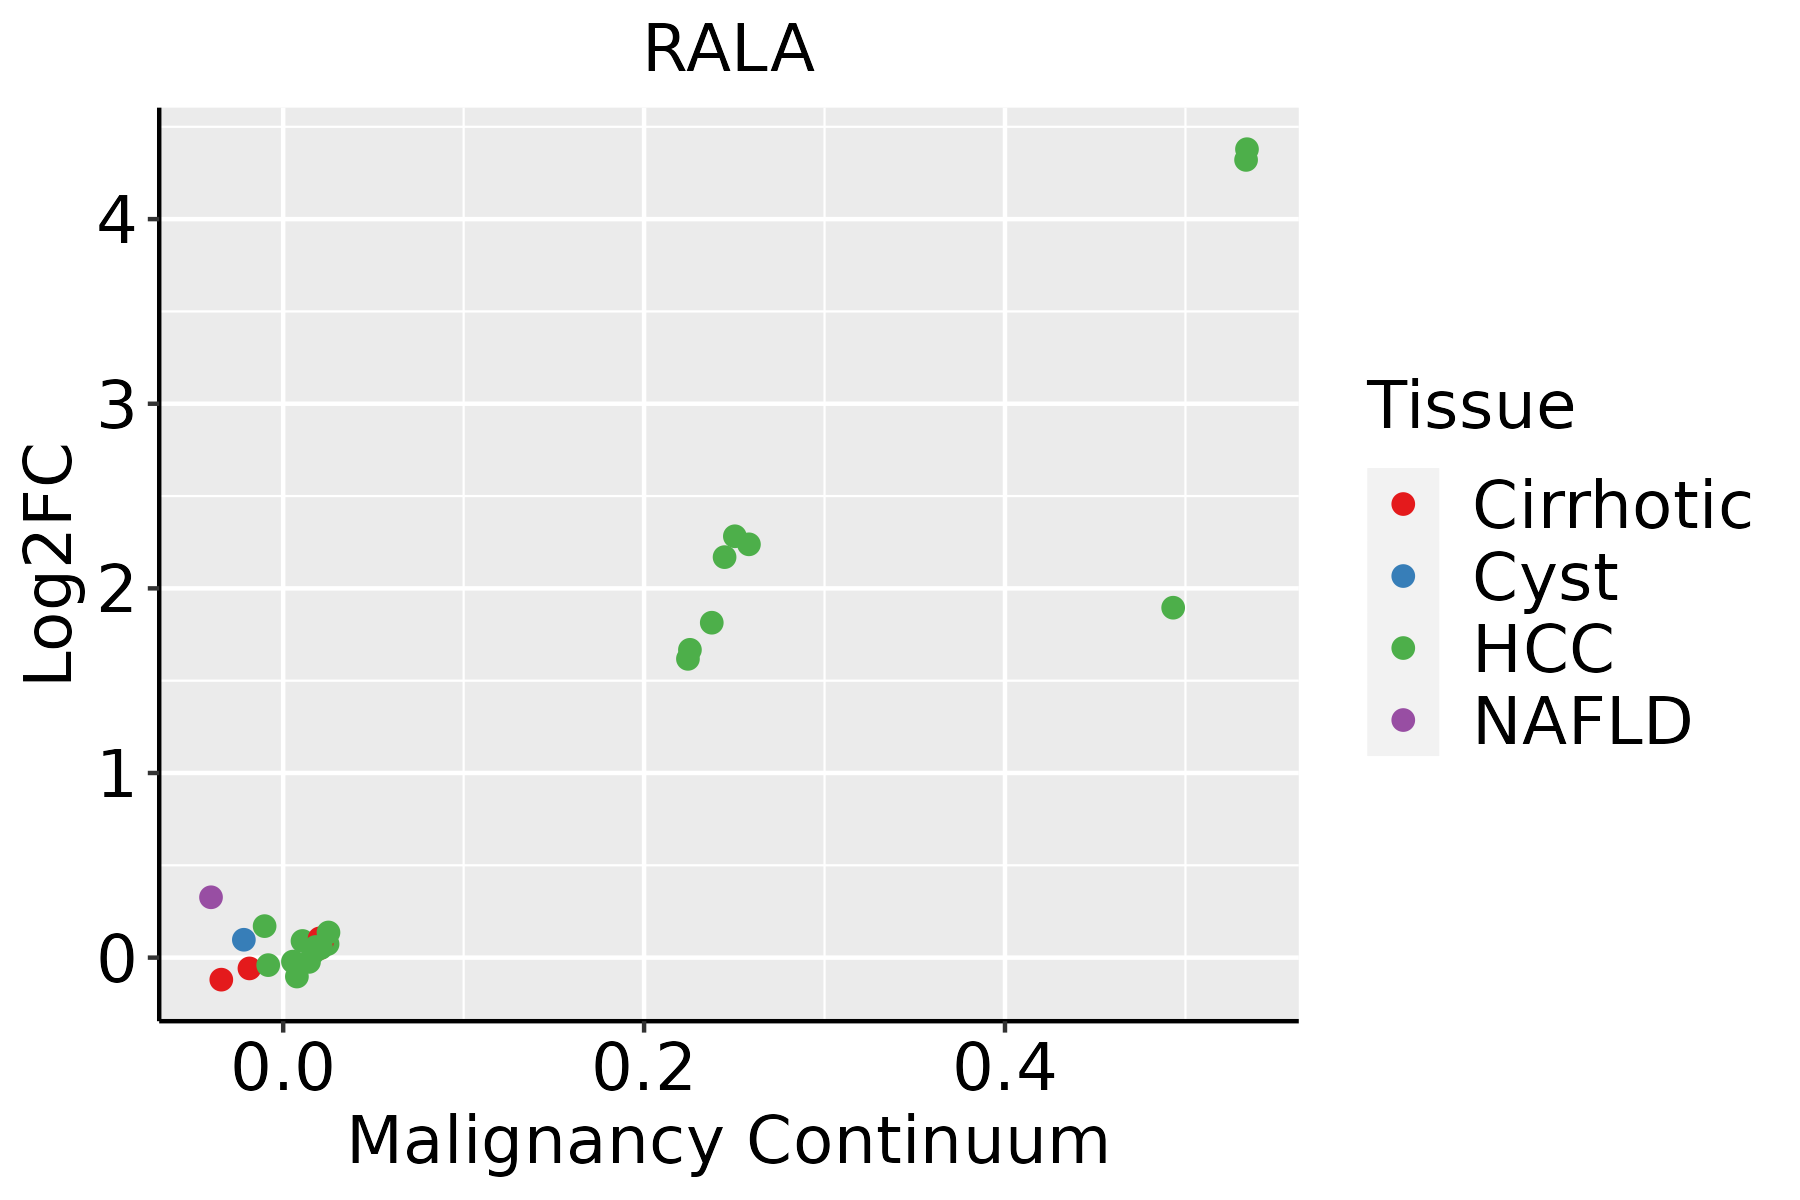 | HCC: Hepatocellular carcinoma |
| NAFLD: Non-alcoholic fatty liver disease | ||
| Lung | 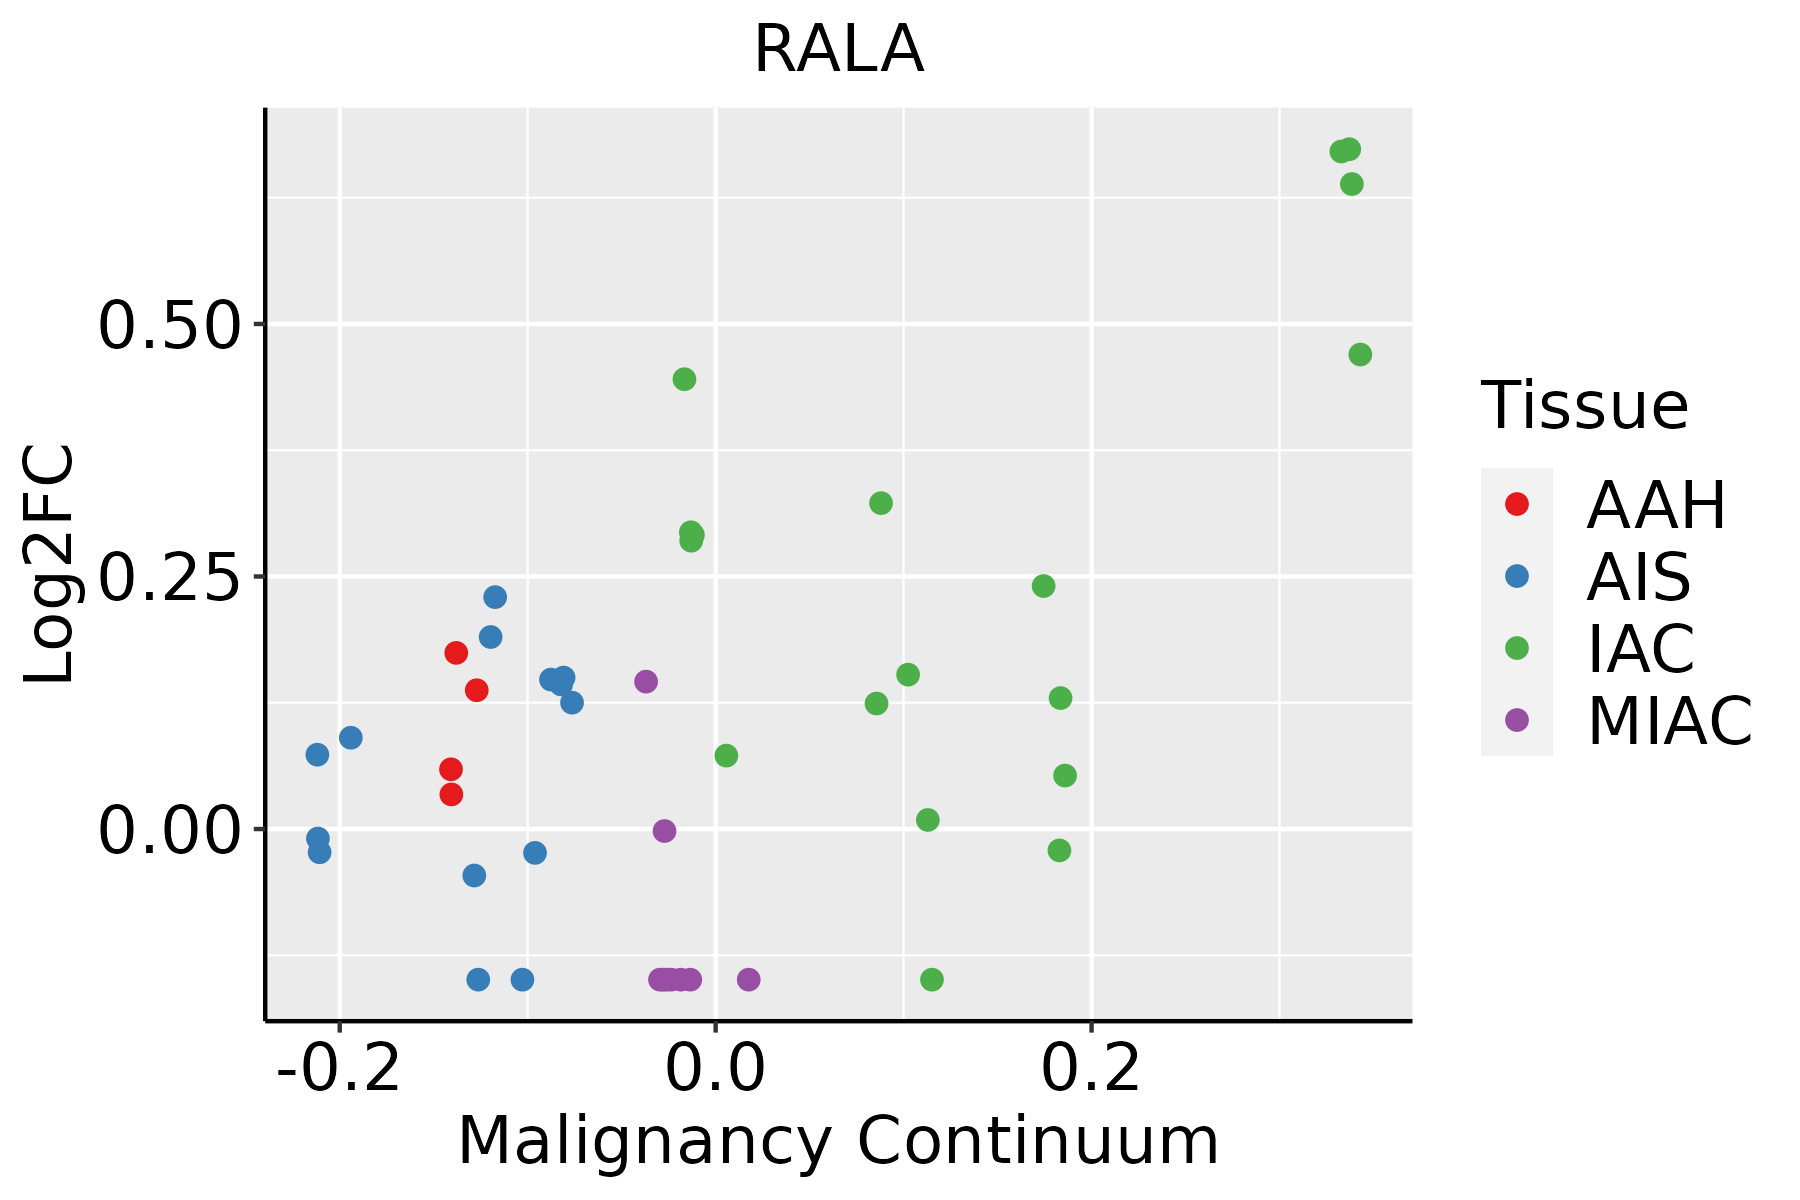 | AAH: Atypical adenomatous hyperplasia |
| AIS: Adenocarcinoma in situ | ||
| IAC: Invasive lung adenocarcinoma | ||
| MIA: Minimally invasive adenocarcinoma | ||
| Oral Cavity | 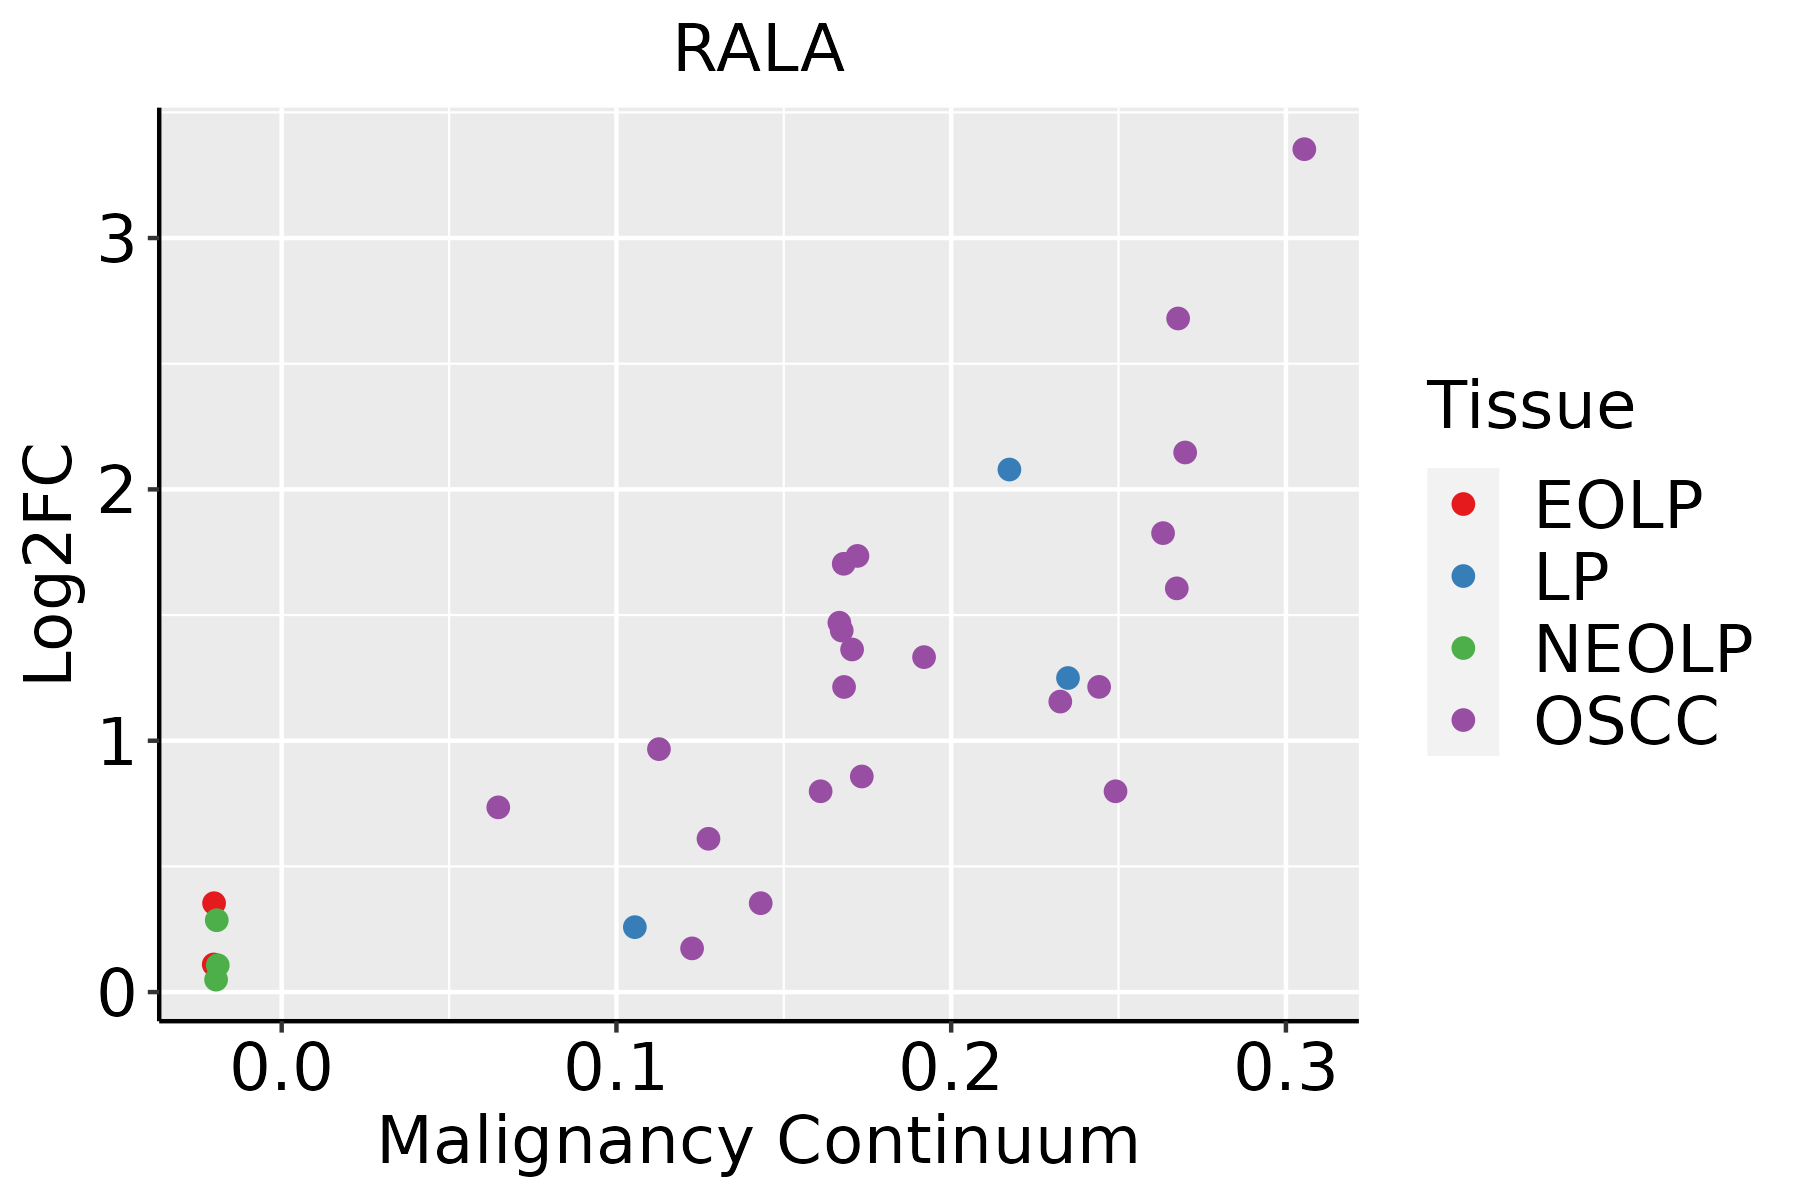 | EOLP: Erosive Oral lichen planus |
| LP: leukoplakia | ||
| NEOLP: Non-erosive oral lichen planus | ||
| OSCC: Oral squamous cell carcinoma | ||
| Prostate | 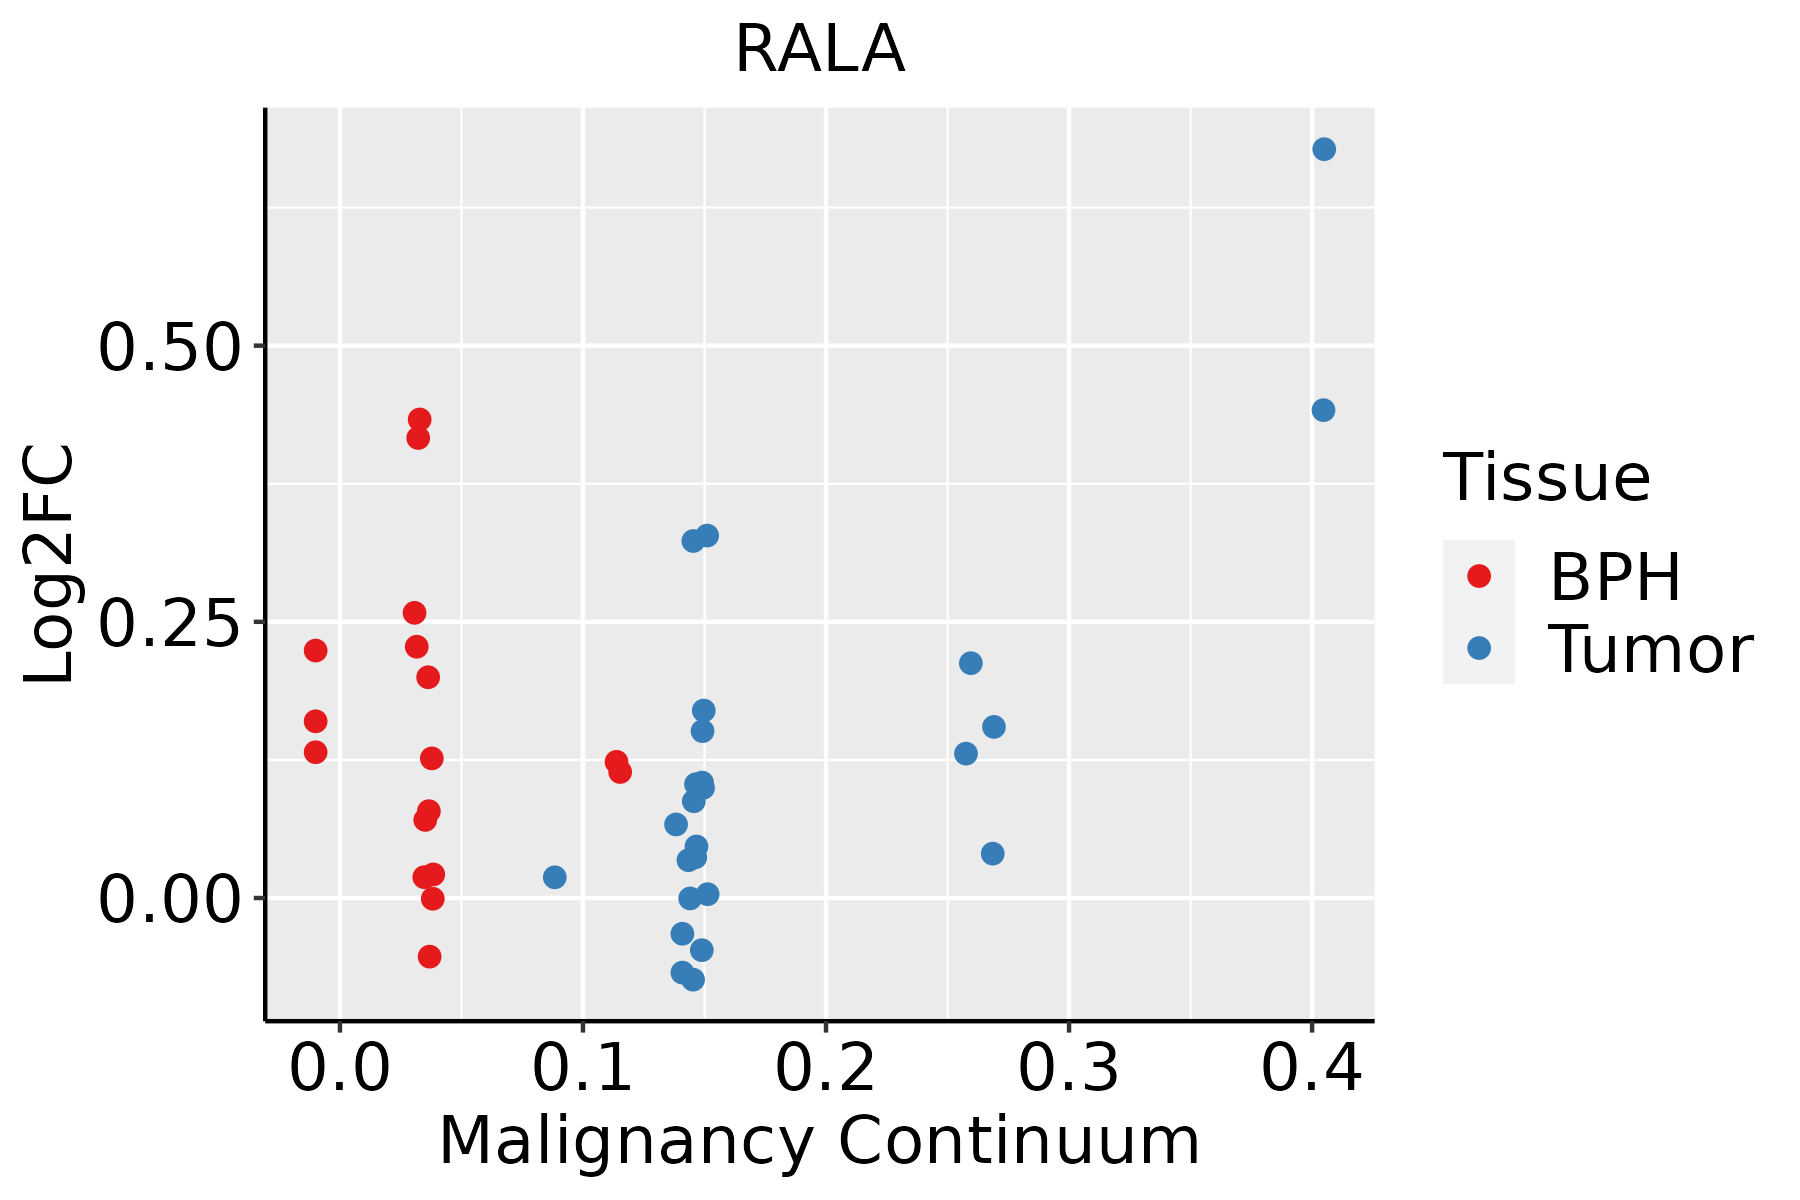 | BPH: Benign Prostatic Hyperplasia |
| Skin |  | AK: Actinic keratosis |
| cSCC: Cutaneous squamous cell carcinoma | ||
| SCCIS:squamous cell carcinoma in situ | ||
| Thyroid | 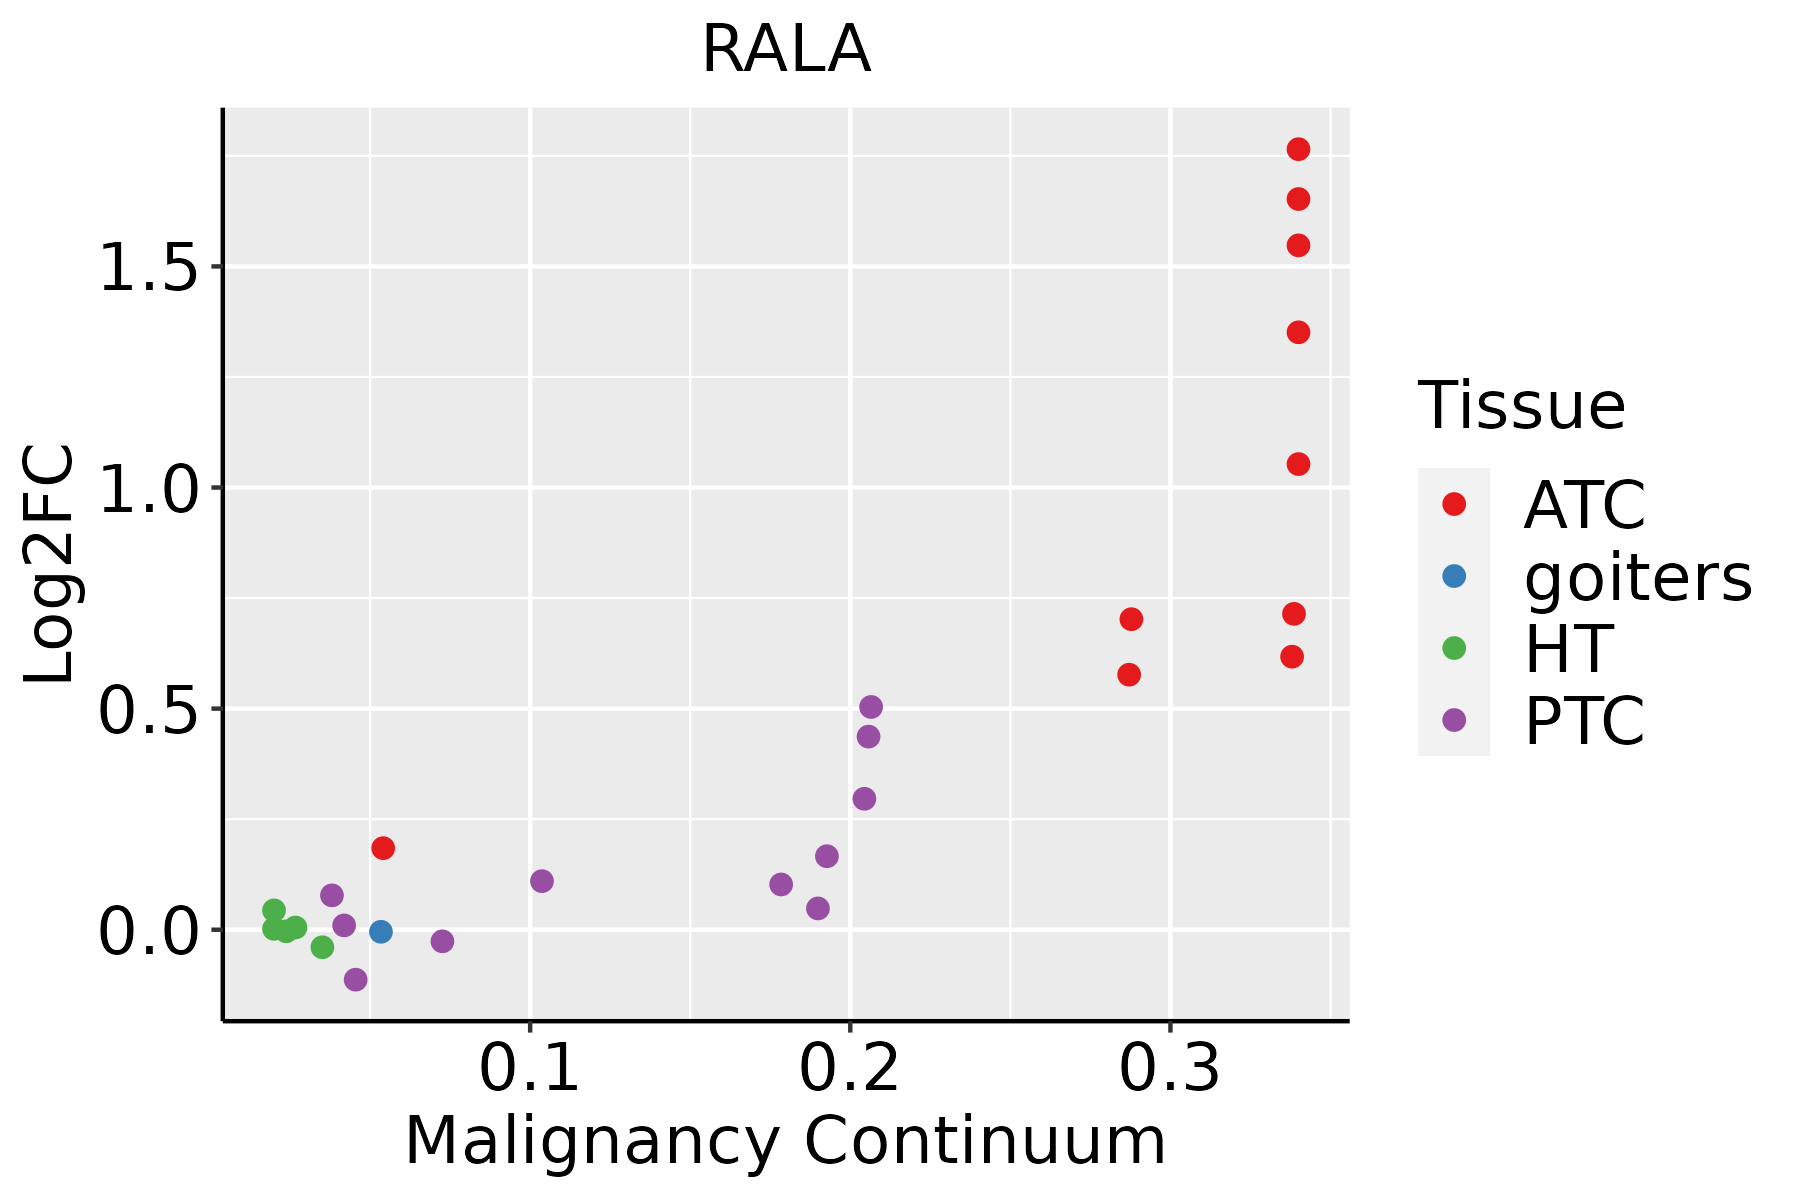 | ATC: Anaplastic thyroid cancer |
| HT: Hashimoto's thyroiditis | ||
| PTC: Papillary thyroid cancer |
| ∗log2FC in expression of this searched gene in stem-like cells from each diseased tissue sample relative to stem-like cells in normal samples in each tissue plotted against the malignancy continuum. Samples are colored based on if they are from different disease stage. |
Top |
Malignant transformation related pathway analysis |
| Find out the enriched GO biological processes and KEGG pathways involved in transition from healthy to precancer to cancer |
| Tissue | Disease Stage | Enriched GO biological Processes |
| Colorectum | AD |  |
| Colorectum | SER |  |
| Colorectum | MSS |  |
| Colorectum | MSI-H |  |
| Colorectum | FAP |  |
| ∗Top 15 enriched GO BP terms are showed in the bar plot of each disease state in each tissue. Each row represents a significant GO biological process which is colored according to the -log10(p.adjust). |
| Page: 1 2 3 4 5 6 7 8 9 |
| GO ID | Tissue | Disease Stage | Description | Gene Ratio | Bg Ratio | pvalue | p.adjust | Count |
| GO:006060614 | Esophagus | ESCC | tube closure | 66/8552 | 89/18723 | 4.24e-08 | 7.76e-07 | 66 |
| GO:000726510 | Esophagus | ESCC | Ras protein signal transduction | 201/8552 | 337/18723 | 1.44e-07 | 2.30e-06 | 201 |
| GO:00219159 | Esophagus | ESCC | neural tube development | 101/8552 | 152/18723 | 1.78e-07 | 2.79e-06 | 101 |
| GO:00163316 | Esophagus | ESCC | morphogenesis of embryonic epithelium | 98/8552 | 147/18723 | 2.12e-07 | 3.27e-06 | 98 |
| GO:000183814 | Esophagus | ESCC | embryonic epithelial tube formation | 83/8552 | 121/18723 | 2.78e-07 | 4.08e-06 | 83 |
| GO:003514815 | Esophagus | ESCC | tube formation | 96/8552 | 148/18723 | 1.86e-06 | 2.16e-05 | 96 |
| GO:00721759 | Esophagus | ESCC | epithelial tube formation | 86/8552 | 132/18723 | 4.81e-06 | 5.10e-05 | 86 |
| GO:003153218 | Esophagus | ESCC | actin cytoskeleton reorganization | 72/8552 | 107/18723 | 5.03e-06 | 5.31e-05 | 72 |
| GO:006056210 | Esophagus | ESCC | epithelial tube morphogenesis | 187/8552 | 325/18723 | 9.95e-06 | 9.44e-05 | 187 |
| GO:003134616 | Esophagus | ESCC | positive regulation of cell projection organization | 201/8552 | 353/18723 | 1.19e-05 | 1.11e-04 | 201 |
| GO:006049118 | Esophagus | ESCC | regulation of cell projection assembly | 110/8552 | 188/18723 | 2.60e-04 | 1.58e-03 | 110 |
| GO:012003218 | Esophagus | ESCC | regulation of plasma membrane bounded cell projection assembly | 108/8552 | 186/18723 | 4.37e-04 | 2.46e-03 | 108 |
| GO:01200347 | Esophagus | ESCC | positive regulation of plasma membrane bounded cell projection assembly | 64/8552 | 105/18723 | 1.15e-03 | 5.70e-03 | 64 |
| GO:00901411 | Esophagus | ESCC | positive regulation of mitochondrial fission | 16/8552 | 21/18723 | 4.47e-03 | 1.76e-02 | 16 |
| GO:00002662 | Esophagus | ESCC | mitochondrial fission | 28/8552 | 42/18723 | 4.90e-03 | 1.89e-02 | 28 |
| GO:00072654 | Liver | NAFLD | Ras protein signal transduction | 66/1882 | 337/18723 | 8.43e-08 | 7.09e-06 | 66 |
| GO:00313465 | Liver | NAFLD | positive regulation of cell projection organization | 57/1882 | 353/18723 | 2.19e-04 | 3.73e-03 | 57 |
| GO:00725947 | Liver | NAFLD | establishment of protein localization to organelle | 62/1882 | 422/18723 | 1.48e-03 | 1.64e-02 | 62 |
| GO:007259412 | Liver | Cirrhotic | establishment of protein localization to organelle | 189/4634 | 422/18723 | 1.01e-19 | 2.45e-17 | 189 |
| GO:00705857 | Liver | Cirrhotic | protein localization to mitochondrion | 65/4634 | 125/18723 | 4.91e-11 | 2.77e-09 | 65 |
| Page: 1 2 3 4 5 6 7 8 9 10 11 12 13 |
| Pathway ID | Tissue | Disease Stage | Description | Gene Ratio | Bg Ratio | pvalue | p.adjust | qvalue | Count |
| hsa0513239 | Esophagus | HGIN | Salmonella infection | 69/1383 | 249/8465 | 3.02e-06 | 4.47e-05 | 3.55e-05 | 69 |
| hsa05132115 | Esophagus | HGIN | Salmonella infection | 69/1383 | 249/8465 | 3.02e-06 | 4.47e-05 | 3.55e-05 | 69 |
| hsa05132211 | Esophagus | ESCC | Salmonella infection | 191/4205 | 249/8465 | 6.51e-19 | 5.45e-17 | 2.79e-17 | 191 |
| hsa0521020 | Esophagus | ESCC | Colorectal cancer | 69/4205 | 86/8465 | 4.06e-09 | 4.13e-08 | 2.11e-08 | 69 |
| hsa0521216 | Esophagus | ESCC | Pancreatic cancer | 62/4205 | 76/8465 | 7.37e-09 | 6.85e-08 | 3.51e-08 | 62 |
| hsa05132310 | Esophagus | ESCC | Salmonella infection | 191/4205 | 249/8465 | 6.51e-19 | 5.45e-17 | 2.79e-17 | 191 |
| hsa05210110 | Esophagus | ESCC | Colorectal cancer | 69/4205 | 86/8465 | 4.06e-09 | 4.13e-08 | 2.11e-08 | 69 |
| hsa0521217 | Esophagus | ESCC | Pancreatic cancer | 62/4205 | 76/8465 | 7.37e-09 | 6.85e-08 | 3.51e-08 | 62 |
| hsa0513214 | Liver | NAFLD | Salmonella infection | 55/1043 | 249/8465 | 8.48e-06 | 3.09e-04 | 2.49e-04 | 55 |
| hsa0513215 | Liver | NAFLD | Salmonella infection | 55/1043 | 249/8465 | 8.48e-06 | 3.09e-04 | 2.49e-04 | 55 |
| hsa0513222 | Liver | Cirrhotic | Salmonella infection | 121/2530 | 249/8465 | 2.47e-10 | 5.13e-09 | 3.16e-09 | 121 |
| hsa052107 | Liver | Cirrhotic | Colorectal cancer | 39/2530 | 86/8465 | 1.67e-03 | 8.01e-03 | 4.94e-03 | 39 |
| hsa052126 | Liver | Cirrhotic | Pancreatic cancer | 34/2530 | 76/8465 | 4.20e-03 | 1.63e-02 | 1.00e-02 | 34 |
| hsa0513232 | Liver | Cirrhotic | Salmonella infection | 121/2530 | 249/8465 | 2.47e-10 | 5.13e-09 | 3.16e-09 | 121 |
| hsa0521012 | Liver | Cirrhotic | Colorectal cancer | 39/2530 | 86/8465 | 1.67e-03 | 8.01e-03 | 4.94e-03 | 39 |
| hsa0521211 | Liver | Cirrhotic | Pancreatic cancer | 34/2530 | 76/8465 | 4.20e-03 | 1.63e-02 | 1.00e-02 | 34 |
| hsa0513242 | Liver | HCC | Salmonella infection | 178/4020 | 249/8465 | 5.90e-15 | 1.98e-13 | 1.10e-13 | 178 |
| hsa0521022 | Liver | HCC | Colorectal cancer | 65/4020 | 86/8465 | 8.85e-08 | 1.23e-06 | 6.87e-07 | 65 |
| hsa0521221 | Liver | HCC | Pancreatic cancer | 54/4020 | 76/8465 | 2.50e-05 | 1.64e-04 | 9.12e-05 | 54 |
| hsa0513252 | Liver | HCC | Salmonella infection | 178/4020 | 249/8465 | 5.90e-15 | 1.98e-13 | 1.10e-13 | 178 |
| Page: 1 2 3 4 |
Top |
Cell-cell communication analysis |
| Identification of potential cell-cell interactions between two cell types and their ligand-receptor pairs for different disease states |
| Ligand | Receptor | LRpair | Pathway | Tissue | Disease Stage |
| Page: 1 |
Top |
Single-cell gene regulatory network inference analysis |
| Find out the significant the regulons (TFs) and the target genes of each regulon across cell types for different disease states |
| TF | Cell Type | Tissue | Disease Stage | Target Gene | RSS | Regulon Activity |
| ∗The dot plots of a searched regulon are shown for all cell subpopulations in each disease state of each tissue based on the regulon specific score inferred using pySCENIC and by calculating the average expression. |
| Page: 1 |
Top |
Somatic mutation of malignant transformation related genes |
| Annotation of somatic variants for genes involved in malignant transformation |
| Hugo Symbol | Variant Class | Variant Classification | dbSNP RS | HGVSc | HGVSp | HGVSp Short | SWISSPROT | BIOTYPE | SIFT | PolyPhen | Tumor Sample Barcode | Tissue | Histology | Sex | Age | Stage | Therapy Types | Drugs | Outcome |
| RALA | SNV | Missense_Mutation | c.242N>G | p.Asn81Ser | p.N81S | P11233 | protein_coding | tolerated(0.74) | benign(0.048) | TCGA-AN-A0AK-01 | Breast | breast invasive carcinoma | Female | >=65 | I/II | Unknown | Unknown | SD | |
| RALA | SNV | Missense_Mutation | novel | c.449A>G | p.Asn150Ser | p.N150S | P11233 | protein_coding | tolerated(0.17) | benign(0) | TCGA-2W-A8YY-01 | Cervix | cervical & endocervical cancer | Female | <65 | I/II | Chemotherapy | cisplatin | CR |
| RALA | SNV | Missense_Mutation | novel | c.547A>G | p.Ser183Gly | p.S183G | P11233 | protein_coding | tolerated(0.23) | benign(0) | TCGA-2W-A8YY-01 | Cervix | cervical & endocervical cancer | Female | <65 | I/II | Chemotherapy | cisplatin | CR |
| RALA | SNV | Missense_Mutation | c.421N>A | p.Glu141Lys | p.E141K | P11233 | protein_coding | tolerated(0.12) | possibly_damaging(0.562) | TCGA-EK-A3GK-01 | Cervix | cervical & endocervical cancer | Female | <65 | I/II | Unknown | Unknown | SD | |
| RALA | SNV | Missense_Mutation | c.334N>G | p.Leu112Val | p.L112V | P11233 | protein_coding | deleterious(0.02) | possibly_damaging(0.837) | TCGA-CA-6718-01 | Colorectum | colon adenocarcinoma | Male | <65 | I/II | Unknown | Unknown | PD | |
| RALA | SNV | Missense_Mutation | c.62N>C | p.Gly21Ala | p.G21A | P11233 | protein_coding | deleterious(0.01) | probably_damaging(1) | TCGA-CK-5913-01 | Colorectum | colon adenocarcinoma | Female | <65 | I/II | Unknown | Unknown | SD | |
| RALA | SNV | Missense_Mutation | c.197T>A | p.Ile66Asn | p.I66N | P11233 | protein_coding | deleterious(0) | probably_damaging(0.994) | TCGA-D5-6930-01 | Colorectum | colon adenocarcinoma | Male | >=65 | I/II | Unknown | Unknown | SD | |
| RALA | SNV | Missense_Mutation | novel | c.605N>T | p.Arg202Ile | p.R202I | P11233 | protein_coding | deleterious(0.02) | possibly_damaging(0.736) | TCGA-AJ-A5DW-01 | Endometrium | uterine corpus endometrioid carcinoma | Female | <65 | I/II | Unknown | Unknown | SD |
| RALA | SNV | Missense_Mutation | novel | c.274N>T | p.Val92Phe | p.V92F | P11233 | protein_coding | deleterious(0.01) | probably_damaging(0.963) | TCGA-B5-A1N2-01 | Endometrium | uterine corpus endometrioid carcinoma | Female | >=65 | III/IV | Chemotherapy | paclitaxel | PD |
| RALA | SNV | Missense_Mutation | c.593N>T | p.Arg198Ile | p.R198I | P11233 | protein_coding | deleterious(0.01) | benign(0.218) | TCGA-BS-A0UV-01 | Endometrium | uterine corpus endometrioid carcinoma | Female | <65 | III/IV | Unknown | Unknown | SD |
| Page: 1 2 3 |
Top |
Related drugs of malignant transformation related genes |
| Identification of chemicals and drugs interact with genes involved in malignant transfromation |
| (DGIdb 4.0) |
| Entrez ID | Symbol | Category | Interaction Types | Drug Claim Name | Drug Name | PMIDs |
| 5898 | RALA | CELL SURFACE | VITAMIN E | 16861802 |
| Page: 1 |

Copyright 2023-Present -The University of Texas Health Science Center at Houston |